저작자표시-비영리-변경금지 2.0 대한민국 이용자는 아래의 조건을 따르는 경우에 한하여 자유롭게
l 이 저작물을 복제, 배포, 전송, 전시, 공연 및 방송할 수 있습니다. 다음과 같은 조건을 따라야 합니다:
l 귀하는, 이 저작물의 재이용이나 배포의 경우, 이 저작물에 적용된 이용허락조건 을 명확하게 나타내어야 합니다.
l 저작권자로부터 별도의 허가를 받으면 이러한 조건들은 적용되지 않습니다.
저작권법에 따른 이용자의 권리는 위의 내용에 의하여 영향을 받지 않습니다. 이것은 이용허락규약(Legal Code)을 이해하기 쉽게 요약한 것입니다.
Disclaimer
저작자표시. 귀하는 원저작자를 표시하여야 합니다.
비영리. 귀하는 이 저작물을 영리 목적으로 이용할 수 없습니다.
변경금지. 귀하는 이 저작물을 개작, 변형 또는 가공할 수 없습니다.
교육학 석사 학위논문
Study on the detection of hydroquinone using graphene and Zn/Al layered double hydroxide
composite
그래핀 - Zn/Al 이중층 수산화물 복합체를 이용한
하이드로퀴논 검출 연구
2013년 2월
서 울 대 학 교 대 학 원
과학교육과 화학전공
권 연 지
Study on the detection of hydroquinone using graphene and Zn/Al layered double hydroxide
composite
그래핀 - Zn/Al 이중층 수산화물 복합체를 이용한
하이드로퀴논 검출 연구
지도교수 홍 훈 기
이 논문을 교육학 석사학위 논문으로 제출함
2013 년 2 월
서 울 대 학 교 대 학 원 과학교육과 화학전공
권 연 지
권연지의 교육학 석사학위 논문을 인준함
2013 년 2 월
위 원 장 ( 인 )
부위원장 ( 인 )
위 원 ( 인 )
CO N TEN T
List of Schemes and Tables iii
List of Figures ⅳ
Abstract ⅶ
Study on the detection of hydroquinone using graphene and Zn/Al layered double hydroxide composite
1. Introduction 2
2. Experimental Section 6
2.1 Apparatus and reagents 6
2.2 Preparation of the graphene oxide 7
2.3 Preparation of the modified electrodes 8
3. Results and Discussion 10
3.1 The characterization of G-LDH films 10
3.2 Cyclic voltammetric responses of the modified GCEs to HQ 19
3.3 Effect of scan rate 22
3.4 pH effect 24
3.5 Simultaneous determination of HQ CA and RE 27 3.6 Amperometric response of the G-LDH/GCE 32 3.7 Stability and reproducibility of the G-LDH/GCE 37
3.8 Sample analysis using G-LDH/GCE 38
4. Conclusions 40
5. References 41
List of Schemes and Tables
Scheme 1. Electrodeposition of G-LDH/GCE for detection of HQ 9
Table 1. Comparison of analytical performance of other electrodes 36
Table 2. Determination of HQ in local tap water samples 39
List of Figures
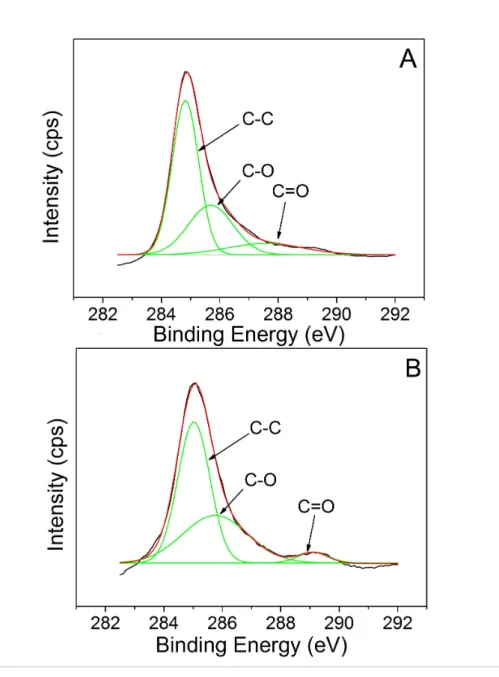
Figure 1. XPS patterns of electrodeposited GO (A) and G-LDH (B). 11
Figrue 2. Wide-scan XPS patterns of Graphene (a) and G-LDH composite
(b). 13
Figure 3. SEM images of LDH (A), graphene (B) and G-LDH (C) films on GCE.
15
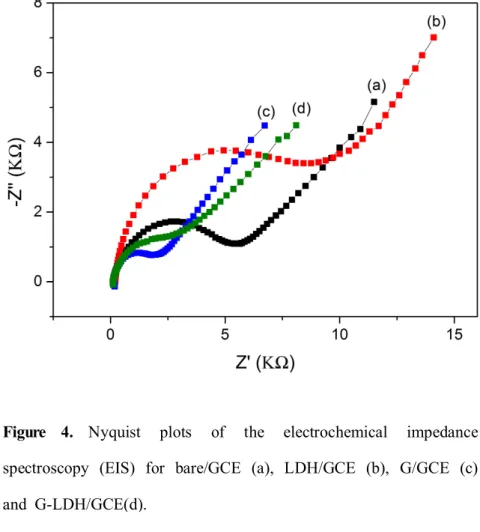
Figure 4. Nyquist plots of the electrochemical impedance spectroscopy (EIS) for bare/GCE (a), LDH/GCE (b), G/GCE (c) and G-LDH/GCE(d). 18
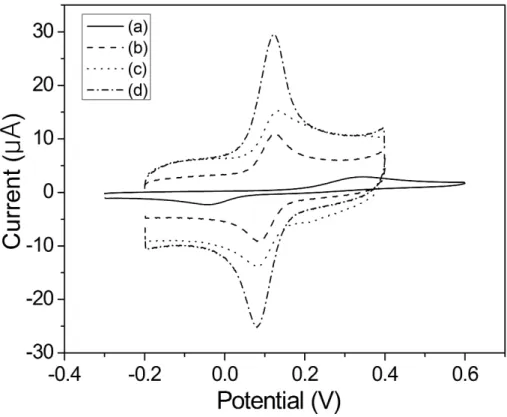
Figure 5. Cyclic voltammograms of 0.1mM HQ in 0.1M PBS (pH=6.5) at bare GCE (a), LDH/GCE (b), G/GCE (c) and G-LDH/GCE(d). Scan rate:
100mV/s. 21
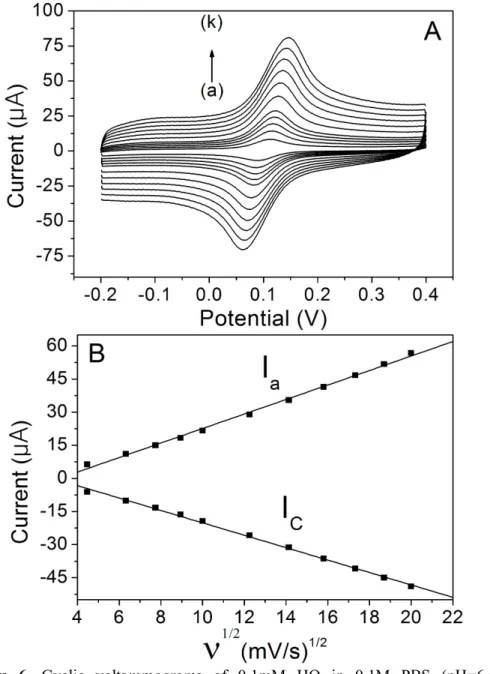
Figure 6. Cyclic voltammograms of 0.1mM HQ in 0.1M PBS (pH=6.5) at G-LDH/GCE at different scan rates; (a)-(k) 20, 40, 60, 80, 100, 150, 200, 250, 300, 350 and 400 mV/s (A). Plots of anodic and cathodic peak currents vs. square root of scan rate (B). 23
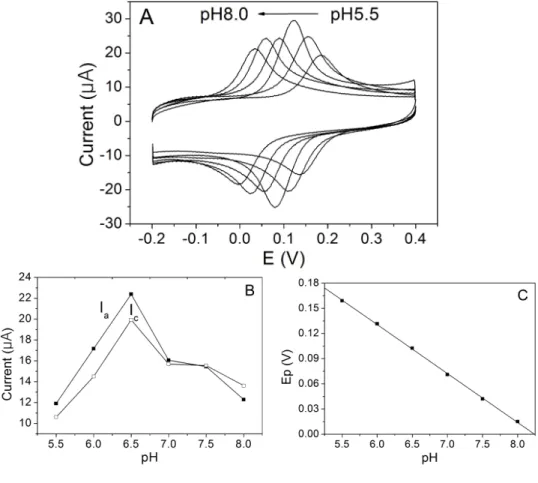
Figure 7. The effect of pH on the Cyclic voltammograms (A), peak current response (B) and the redox peak potential (C) of 0.1mM HQ in 0.1M PBS (pH=6.5) at G-LDH/GCE with scan rate 100mV/s. 26
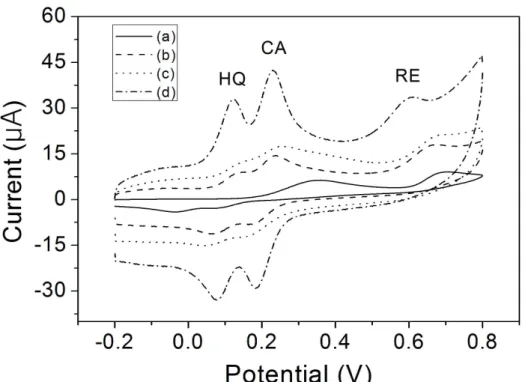
Figure 8. Cyclic voltammograms of HQ, CA and RE (0.1mM of each) in 0.1M PBS(pH=6.5) at bare GCE (a), LDH/GCE (b), G/GCE (c) and
G-LDH/GCE(d). Scan rate: 100mV/s. 29
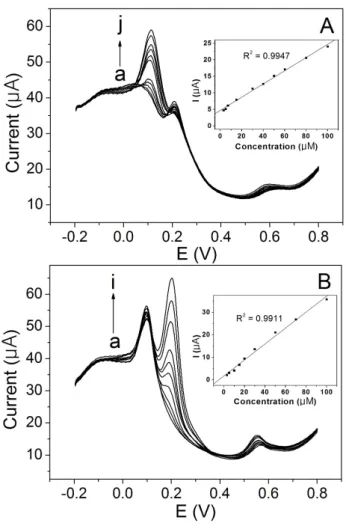
Figure 9. Differential pulse voltammograms of HQ at G-LDH/GCE in the presence of 25μM CA and 50μM RE in 0.1M PBS (pH=6.5). HQ concentrations (from a to j): 3, 5, 7, 15, 30, 40, 50, 60, 80 and 100μM (A), Differential pulse voltammograms of CA at G-LDH/GCE in the presence of 25μM HQ and 50μM RE in 0.1M PBS (pH=6.5). CA concentrations (from a to i): 3, 5, 10, 15, 20, 30, 50, 70 and 100μM (B).
31
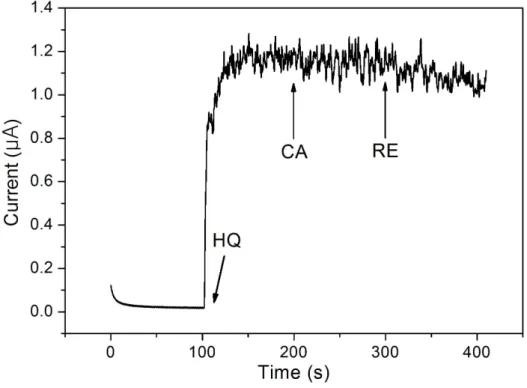
Figure 10. Amperometric response of the G-LDH/GCE to the sequential addition of 25μM HQ, 25μM CA and 25μM RE under stirring 0.1M PBS (pH=6.5). The applied potential at the modified working electrode was
0.125V. 33
Figure 11. Amperometric response of the G-LDH/GCE to successive injection of 25μM HQ in 0.1M PBS (pH=6.5) under stirring. Applied
potential: 0.125V. Insert: the calibration curve of the amperometric current
vs. concentration of HQ. 35
Abstract
Electrodeposition of graphene oxide – Zn/Al layered double hydroxide composite for determination of hydroquinone
Yeonji Kwon
Department of Chemistry Education The graduate School
Seoul National University
A graphene-Zn/Al layered double hydroxide composite film was simultaneously prepared by electrochemical deposition on the surface of a glassy carbon electrode (G-LDH/GCE) from the mixture solution containing GO and nitrate salts of Zn2+
and Al3+. The modified electrode showed good electrochemical performances toward the simultaneous electrochemical detection of hydroquinone(HQ), catechol(CA) and resorcinol(RE) due to the unique properties of graphene(G) and LDH such as large active surface area, facile electronic transport and high electrocatalytic activity. The redox characteristics of G-LDH/GCE were investigated with cyclic voltammetry and differential pulse voltammetry. The
well-separated oxidation peak potentials, corresponding to the oxidation of HQ, CA and RE, were observed at 0.126 V, 0.228 V and 0.620 V respectively. The amperometric response of the modified electrode exhibited that HQ can be detected without interference of CA and RE. Under the optimized conditions, the oxidation peak current of HQ is linear with the concentration of HQ from 6.0 μM to 325.0 μM with the detection limit of 0.077μM (S/N=3). The modified electrode was successfully applied to the direct determination of HQ in a local tap water, showing reliable recovery data.
Key words: graphene, layered double hydroxide, hydroquinone, electrodeposition, simultaneous detection, cyclic voltammetry, differential pulse voltammetry
Student number: 2010-23586
Electrodeposition of graphene oxide – Zn/Al layered double hydroxide
composite for determination of
hydroquinone
1. Introduction
Hydroquinone (HQ), known as 1,4-dihydroxybenzene, is a phenolic compound which is widely used in depigmenting agents, medicines, cosmetic products, antioxidant and photography chemicals.[1] Because it is hazardous to human health and has low levels of degradability in the environment, it is considered as an environmental pollutants to be monitored in aquatic environment by the US Environmental Protection Agency (EPA) and the European Union (EU).[2] Therefore, it is necessary to develop highly selective and sensitive analytical methods for the detection of hydroquinone.
So far several analytical methods such as capillary electrochromatography[2], chromatography[3], and spectrophotometry[4] have been developed to analyze HQ. However, most of these methods have some disadvantages such as complicated pretreatment, time-consuming, low sensitivity and high cost.
Electrochemical methods provide not only an easy and rapid way in environmental analysis but also simple operation, low cost, cheap instrument, high sensitivity, excellent selectivity, and fast response. In environmental samples, HQ often coexists with its isomers such as catechol (1,2-dihydroxybenzene, CA) and resorcinol (1,3-dihydroxybenzene, RE), and the three isomers of dihydroxybenzene have similar structures and properties.
Therefore, it is important to detect HQ without any interference from CA and RE. When using electrochemical methods, more attentions are focused on the simultaneous determination of HQ and CA because their redox peaks are
overlapped at ordinary electrodes. For example, Qi and Zhang reported that a simple and high selective electrochemical method for simultaneous determination of HQ and CA has been developed at a glassy carbon electrode modified with multiwall carbon nanotubes(MWCNT).[5] Other chemical modification methods using GCE for simultaneous determination of HQ and CA were reported by Wang[6] et al. with penicillamine, Zhao[7] et al. with a composite of MWCNT and negatively charged polyamidosulfonic acid, and Yin[8] et al. with graphene-chitosan composite film.
Layered double hydroxides (LDHs), known as hydrotalcite-like multifunctional materials or anionic clays, are generally represented by the formula [MⅡ1-xMⅢx(OH)2]x+ (An-)x/n∙mH2O, where M2+ and M3+ are divalent and trivalent metal cations, respectively, and anion(An-) located in the gallery between the layers. [9] The layered structures have received many attentions because of their attractive properties such as large surface area, tunable composition, exchangeable anions, thermal stability, chemical inertia, well-defined layered structure and low cost.[10] Using these properties, LDHs have been widely investigated for a wide range of areas such as catalysis, biocatalysis, sensors, drug delivery and adsorbents.[11]-[13] Recently, many reports have demonstrated the successful utilization of LDH as an electrode modification material.[14]-[15] Despite its usefulness, the weak conductivity of LDH sometimes results in poor charge transport restricting its electrochemical performance. However, the incorporation of conducting materials into LDHs has shown improved electrical properties. For example, all the composite
films of carbon nanotube/Zn/Al-LDH[16], graphene/Ni/Al-LDH[17], graphene/Co/Al-LDH[18], activated carbon/Co/Al-LDH[19], and gold nanoparticle/Mg/Al-LDH[20] show improved electrochemical activities on HQ detection[16], supercapacitor materials[17]-[19] and methanol oxidation[20].
Graphene(G), a monolayer of carbon atoms in a closely packed honeycomb two-dimensional lattice, has attracted considerable attentions due to its unique structure, electronic transport property, chemical property, large surface area and excellent electrocatalytic characteristics compared to other carbon-based materials.[21]-[23] For these reasons, graphene has been applied to a wide range of electrical fields such as nanocomposites, chemical and biosensors, batteries, supercapacitors, and nanoelectronics.[24]-[27] Graphene oxide (GO), known as a precursor for graphene synthesis by either thermal or chemical reduction process[28], has a two-dimensional plane and good electrical characteristics. Furthermore, GO is more hydrophilic than graphene and can be easily dispersed in an aqueous solution because it contains oxygen functional groups (e.g. -OH, C-O-C, -COOH, etc). Recently, GO in a solution can be electrochemically reduced directly to yield graphene on an electrode surface using electrochemical methods.[29]-[30]
In this work, we demonstrate a new procedure using graphene to improve the electrocatalytic function of LDH as a support material for simultaneous determination of HQ, CA and RE. The composite film, consisting of graphene and LDH, presented the advantages such as large surface area, unique electrochemical properties and strong electrocatalytic activity due to
synergic and native characteristics of the two components. The composite film is simultaneously formed on the surface of GCE by electrodeposition from the mixture solution containing colloidal GO and nitrate salts of Zn2+ and Al3+ as components forming LDH in one pot. This synthesis is simple, facile, fast and inexpensive for the fabrication of the modified electrode compared to other previous reports [17]-[18] using immobilization and hydrothermal methods. The proposed method exhibited good analytical performances in the simultaneous determination of HQ, CA and RE and has been applied to determination of HQ in a local tap water sample with high sensitivity and fast response.
2. Experimental Section
2.1
Apparatus and regentsThe Electrochemical measurements were carried out with a conventional three-electrode system (CHI 842B and 760B C.H. Instruments, Inc., U.S.A).
A bare or modified glassy carbon electrode (GCE) was used as a working electrode while Ag/AgCl/ KCl (3.0M), and Pt wire were used as the reference and counter electrodes, respectively. All measurements were carried out at room temperature. The X-ray photoelectron spectroscopy (XPS) was performed with a AXIS-HSi (Kratos Analytical Co., UK) using Mg Kα radiation at a power of 150W. Images of the modified electrode surface were obtained using a field emission scanning electron microscopy (FE-SEM, Hitachi S-4800). Electrochemical impedance spectroscopy (EIS) measurements were performed in the presence of 5 mM K3[Fe(CN)6] as a redox probe and 0.1M KCl in the frequency range from 0.01 to 100,000 Hz. The amplitude of the applied sine wave potential was 5 mV with the formal potential set at 0.25V. The differential pulse voltammograms were obtained by scanning the potential from -0.2 to 0.8V with the following pulse amplitude, 0.05V; pulse width, 0.05s; sample width, 0.0167s; pulse period, 0.2s.
Graphite powder (400 mesh), Zn(NO3)2∙6H2O, Al(NO3)3∙9H2O, CA, HQ and RE were purchased from Sigma-Aldrich (USA). All other reagents were of analytical grade and were used as received without further purification.
Phosphate buffer solution (PBS, 0.1M) was prepared by mixing a stock solution of 0.1M NaH2PO4, and 0.1M Na2HPO4, and the pH was adjusted by NaOH or HCl. All solutions were prepared with deionized water obtained from an ultrapure water purification system (LabTech, Korea) with a resistivity of not less than 18.2 MΩ cm.
2.2 Preparation of the graphene oxide
Graphene oxide (GO) was prepared using a modified Hummers method [31].
0.5 g of graphite powder was oxidized by hot solution(80℃) of concentrated H2SO4 (2.5 mL) containing K2S2O8 (0.25g) and P2O4 (0.25g). Then it was kept stirring for 6 hours. After that, the mixture was diluted with 50ml of deionized water. The product was obtained by filtering using 0.2μm micromembrane filter (Whatman), washed, and dried at 40℃. The preoxidized GO was placed in concentrated H2SO4 at 0℃. KMnO4 (1.5g) was gradually added with stirring and cooling, so that the temperature of the mixture remain below 20℃. Then, it was refluxed in 35℃ water bath for 2 hours.
Next, it was diluted with 23ml of deionized water, and refluxed in 90℃
water bath for 30 minutes. Then 70mL of deionized water and 1.25ml of 30% H2O2 are slowly put into the product. The obtained GO was washed with 10% HCl and deionized water until it was neutral and then it was filtered. The exfoliated GO was centrifuged to remove aggregated GO.
2.3 Preparation of the modified electrodes
Prior to the modification, the GCEs (3 mm in diameter) were polished with 0.3 and 0.05μm alumina powder/water slurry on a polishing pad. The GCE was then rinsed, after which it was sonicated in deionized water and ethanol for each 5minute. The graphene-layered double hydroxide composite modified GCE (G-LDH/GCE) was constructed by slight modifying reported methods previously.[14],[32] The polished and cleaned GCEs were immersed in 0.1M HClO4 and then were carried out using a potential cycling between -0.2 and 1.8V at a scan rate of 50mv/s for 10 minutes. After rinsing the electrode with deionized water, it was dried at room temperature. The G-LDH composite film was electrodeposited onto the electrode surface by cathodic reduction using a solution containing 12.5mM Zn(NO3)2∙6H2O as the Zn2+
source, 7.5mM Al(NO3)3∙9H2O as the Al3+ source, 1.2M KNO3 as the supporting electrolyte and GO aqueous solution (1mg/ml). Cathodic deposition was performed by applying potential of -1.65V for 120s under stirring. After the electrodeposition process, the modified electrode was rinsed with deionized water to remove physical adsorbed material. For comparison with the G-LDH/GCE, the LDH/GCE and G/GCE were also fabricated under the same experimental conditions. The LDH/GCE was electrodeposited using a solution containing 12.5mM Zn(NO3)2∙6H2O, 7.5mM Al(NO3)3∙9H2O, and 1.2M KNO3. The G/GCE was electrodeposited using a solution containing a GO aqueous solution (1mg/ml) and 1.2 M KNO3 as the supporting electrolyte.
Scheme 1. Electrodepositon of G-LDH/GCE for detection of HQ
3 Results and Discussion
3.1 The characterization of G-LDH films
The XPS survey spectra of electrodeposited GO and G-LDH composite were shown in Figure1. The Figure 1 (A) shows the C 1s spectrum of the GO obtained by electrodeposition from a same procedure with the aim of obtaining a G-LDH in the absence of Zn2+ and Al3+. The spectrum consists of the C-C, C-O and C=O bonding, corresponding to the peak at 284.8, 285.7 and 287.5. The result is consistent with the typical XPS spectrum of the graphene. In addition, the areas of the three C1s components of the electrodeposited GO show that the carbon and oxygen ratio (C/O) is about 8.0. These results demonstrate that the electrodeposited GO is reduced to graphene. The Figure 1 (B) shows the C1s spectrum of the G-LDH composite. The GO was simultaneously electrodeposited in company with Zn2+ and Al3+ as source of LDH. The Figure 1 (B) indicated that the carbon and oxygen signals were also observed in the XPS spectrum. In addition, the result is well consistent with the XPS spectrum of the pure graphene.
Therefore, the GO in the G-LDH is reduced to graphene.
Figure 1. XPS patterns of electrodeposited GO (A) and G-LDH (B).
Figure 2 shows wide-scan XPS spectra for the graphene (G) and G-LDH samples. Only C and O peaks were observed in G sample, whereas secific metal peaks can not be observed in graphene sample. On the other hand the G-LDH sample contained not only C and O peaks but also Zn and Al peaks. This result indicates that the G-LDH composite were coexistence of G sheets and LDH films, demonstrating that electrodeposition method can produce the G-LDH composite.
Figrue 2. Wide-scan XPS patterns of Graphene (a) and G-LDH composite (b).
The morphologies of the electrodeposited materials on GCE are shown in Figure 3. Figure 3 (A) typically shows that the electrodeposited LDH films have a layered structure on the surface of glassy carbon electrode. The presence of well-defined layered structure can increase the effective surface area and accumulate more analytes in the gallery between the layers and on the electrode surface. Figure 3 (B) shows a SEM image of graphene electrodeposited from a solution containing GO and 1.2 M KNO3 as the supporting electrolyte. We can observe that the electrodeposited graphene consists of transparent and wrinkled silk-like surface, which is associated with the presence of ultrathin graphene nanosheets. These unique features of graphene films are highly beneficial in maintaining a high surface area on the electrode. The G-LDH composite is shown in Figure 3 (C). It can be seen that the G-LDH composite film comprises not only a layered structure coming from traditional hydrotalcite anionic clays but also a wrinkled silk-like two-dimensional graphene nanosheet structure. This result indicates that the G-LDH composite can be fabricated by electrodeposition with the mixture electrolytes solution containing GO colloidal particles, di- and trivalent metal cations consisting of the LDH structure itself.
Figure 3. SEM images of LDH (A), graphene (B) and G-LDH (C) films on GCE.
Electrochemical impedance spectroscopy measurements can be used to evaluate the effect of LDH, G and G-LDH films on the kinetics of a redox reaction at the modified GCE electrodes.
Figure 4 presents the complex impedance plots for a bare and various modified GCEs at a potential of 0.25 V in the presence of 5 mM Fe(CN)63-/4-. The Nyquist plots for the electrodes is characterized by a semicircle at high frequency and a linear Warburg line at an angle of 45° in the low frequency region. The semicircle corresponds to a parallel combination of the charge transfer resistance with the double layer capacitance, while the linear response is related to mass transfer effects. The impedance plots for GCEs modified by the electrodeposition differ significantly from that of the bare electrode. As shown in Figure 4, all the electrodes show the linear line at an angle of 45° in the low frequency region. However, the diameter of the semicircle is largely different each other. For example, the semicircle of LDH/GCE (8.8 kΩ) increased as compared to that of the bare GCE (5.5 kΩ). This result suggests that the LDH acts as an insulating material due to its weak electrochemical characteristics. The semicircle of G/GCE (2.1 kΩ) decreases dramatically due to the fast electron transfer and excellent electrocatalytic characteristics of graphene. When LDH is co-electrodeposited with G, the semicircle slightly increases compared to that of the G/GCE, indicating that the charge transfer resistance of the G-LDH/GCE (2.7 kΩ) is larger than that of the G/GCE.
These impedance results show that the exfoliated G nanosheets could
improve the electrochemical properties of GCE modified with LDH only when G is combined with LDH.
Figure 4. Nyquist plots of the electrochemical impedance spectroscopy (EIS) for bare/GCE (a), LDH/GCE (b), G/GCE (c) and G-LDH/GCE(d).
3.2 Cyclic voltammetric responses of the modified GCEs to HQ
Figure 5 shows cyclic voltammograms of HQ at bare GCE (a), LDH/GCE (b), G/GCE (c), and G-LDH/GCE (d) in 0.1M PBS (pH 6.5). At the bare GCE, the anodic and cathodic peak potentials of HQ were at 0.34 and -0.05V, respectively. The peak potential separation (ΔEp) was 0.39V. This large ΔEp indicates that the electrochemical redox process of HQ exhibits kinetically quite slow electron transfer characteristics at the bare GCE. On the other hand, at the LDH/GCE (b), the oxidation peak potential negatively shifts to 0.125V, and the reduction peak potential positively shifts to 0.080V with a peak separation (ΔEp) value of 0.045V. This large shifts in the peak potential and large decrease in the ΔEp indicate that the reversibility of HQ is greatly improved by electrochemical catalytic activity of LDH films on GCE. This can be attributed to the structural features of layered double hydroxide and chemical inertia of LDH films. These results show that the presence of LDH on the GCE surface can lead to the accumulation of more HQ molecules into the gallery between the positively charged lamellar structure, resulting in the large surface area on the electrode surface. Hence, the effective surface of the electrode is increased. However, dramatically enhanced electrochemical signal of HQ cannot be observed at the LDH/GCE.
Similarly, at the G/GCE (c), the anodic and cathodic peak potentials of HQ appeared at 0.134 and 0.080V, respectively, and the ΔEp value for HQ was 0.054V. These electrochemical traits demonstrate that the electrochemical
reversibility of HQ is substantially improved due to the unique properties of graphene, which accelerates the electron transfer and increases active surface area of the electrode. However, there is no peak current enhancement which is favorable to detection of HQ. As shown in Figure 5 (d), at the G-LDH/GCE, the anodic and cathodic peak potentials of HQ appeared at 0.124 and 0.080V, respectively, and the ΔEp value for HQ was 0.051V.
These electrochemical characteristics seem to be quite similar to those data observed at both the LDH/GCE and G/GCE. However, remarkable increases of the anodic and cathodic peak currents were observed. The redox peak currents of HQ observed at the G-LDH/GCE were 11.02, 3.01 and 2.6 fold higher than those at the bare GCE, LDH/GCE and G/GCE, respectively.
These facts indicate that the incorporation of G into the LDH matrix can efficiently promote the weak conductivity due to poor charge transport of LDH. Besides, G-LDH composite have a larger electroactive surface area than those of the individual components, demonstrating that combining the advantageous characteristics of G and LDH can exhibit excellent electrical conductivity and catalytic activity toward the redox reaction of HQ.
Furthermore, the ratio of the anodic (Ipa) and cathodic (Ipc) peak current (Ipa/Ipc) is close to 1, which is a typical characteristics of a quasi-reversible process.
Figure 5. Cyclic voltammograms of 0.1mM HQ in 0.1M PBS (pH=6.5) at bare GCE (a), LDH/GCE (b), G/GCE (c) and G-LDH/GCE(d). Scan rate:
100mV/s.
3.3 Effect of scan rate
The effect of scan rate on the voltammetric response of the G-LDH/GCE in 0.1M PBS containing 0.1mM HQ was investigated. As shown in Figure 6(A), both the anodic and cathodic peak currents of HQ increased with an increase in the scan rate from 20 to 400mV/s. The redox peak currents show a good linear relationship with the square root of the scan rate (Figure 6(B)). The regression equations were Ipa(uA)= 3.28 ν1/2 - 10.2 and Ipc(uA) = 7.98 - 2.82 ν1/2 with the same correlation coefficient R of 0.997, respectively.
These results strongly suggest that the HQ oxidation and reduction are under diffusion control process at the modified electrode.
Figure 6. Cyclic voltammograms of 0.1mM HQ in 0.1M PBS (pH=6.5) at G-LDH/GCE at different scan rates; (a)-(k) 20, 40, 60, 80, 100, 150, 200, 250, 300, 350 and 400 mV/s (A). Plots of anodic and cathodic peak currents vs. square root of scan rate (B).
3.4 pH effect
In order to optimize the buffer pH condition of detecting HQ at the G-LDH/GCE, as shown in Figure 7 (A), the redox peak potential and peak current of hydroquinone were investigated over a pH range of 5.5 ~ 8.0 in phosphate buffer solution. Figure 7 (B) presents that the redox peak currents increased until the pH value reached 6.5 and then decreased. The maximum peak current was obtained at pH of 6.5. Thus, we have chosen 6.5 as the optimum pH value for the electrochemical detection of HQ. When the pH value is higher than 8.0, the peak current rapidly decreases. This could be due to the shortage of proton participating in the electrochemical reaction of hydroquinone. At the higher pH solution, hydroquinone molecule is deprotonated to its mono- and dianion form, which might bring in electrostatic repulsion from G-LDH composite film. This could make the redox reaction of hydroquinone more difficult resulting in low peak current.
As shown in Figure 7 (C), the redox peak potential, Ep= (Epa+Epc)/2, of HQ shifts to more negative values with an increase in the pH values. The linear regression equations are Ep(V) = 0.480-0.058 pH (R=0.999) for HQ.
The slopes of Ep vs. pH are close to the theoretical value of 58.5mV/pH, indicating that a two electrons and two protons process occurs at G-LDH/GCE. All these electrochemical features of HQ observed in Figure 7 were also obtained quite similarly for the electrochemical reaction of CA
and RE as dihydroxybenzene isomers (data not shown) in the same experimental condition as in Figure 7.
Figure 7. The effect of pH on the Cyclic voltammograms (A), peak current response (B) and the redox peak potential (C) of 0.1mM HQ in 0.1M PBS (pH=6.5) at G-LDH/GCE with scan rate 100mV/s.
3.5 Simultaneous determination of HQ CA and RE
CA and RE are the isomers of HQ and usually coexist in test samples.
Therefore, it is important to remove the interference of the isomers for the selective determination of HQ. At first, the electrochemical determination of HQ, CA and RE in the mixture was investigated using cyclic voltammetry.
Cyclic voltammograms of an equimolar (0.10 mM) concentration mixture of HQ, CA and RE in 0.1M PBS (pH=6.5) are shown in Figure 8. An overlapped wide oxidation peak at about 0.36V is observed at the bare GCE (a), indicating that the bare GCE cannot separate oxidation peaks of HQ and CA. Although the redox peak of HQ can be barely separated from that of CA at the LDH/GCE (b) and G/GCE (c), their peak currents are not large enough to be separated from the mixture solution. This trend could be worse in the low micro-molar concentration mixture of dihydroxybenzene isomers. In contrast, at G-LDH/GCE (d), the anodic and cathodic peak of HQ and CA are well developed and their peak currents are much higher than those at the LDH/GCE and G/GCE. For HQ, the Ipa is 4.2 and 3.7 times higher than those at LDH/GCE and G/GCE, respectively. At the same time, three well-separated oxidation peak potentials were observed at 0.126 V, 0.228 V and 0.620 V corresponding to the oxidation of HQ, CA and RE, respectively. The anodic (ΔEpa) and cathodic (ΔEpc) peak potential differences between HQ and CA are up to 105mV and 104mV, respectively, which suggest that the simultaneous determination
of HQ, CA and RE are considerably more sensitive compared with those at LDH/GCE and G/GCE.
Figure 8. Cyclic voltammograms of HQ, CA and RE (0.1mM of each) in 0.1M PBS(pH=6.5) at bare GCE (a), LDH/GCE (b), G/GCE (c) and G-LDH/GCE(d). Scan rate: 100mV/s.
For the simultaneous and quantitative determination of HQ and CA at the G-LDH/GCE, differential pulse voltammetry was used because of its higher current sensitivity and better resolution. The individual determination of HQ or CA in their mixtures was investigated when the concentration of one species changed, whereas others remained constant. Figure 9 (A) showed the differential pulse voltammogram of HQ with its different concentrations in 0.1 M phosphate buffer solution (pH 6.5) containing 25.0 µM CA and 50.0 µM RE. The anodic peak current of HQ is proportional to its concentration from 3.0 µM to 100.0 µM, as shown in the inset of Figure 9 (A). Similarly, the oxidation peak current of CA linearly increases with its concentration from 3.0 µM to 100.0 µM when keeping the concentration of HQ and RE constant at 25.0 µM and 50.0 µM as shown in Figure 9 (B).
Therefore, the G-LDH/GCE provides sensitive, selective, and quantitative determination of HQ and CA without interference for each other.
Figure 9. Differential pulse voltammograms of HQ at G-LDH/GCE in the presence of 25μM CA and 50μM RE in 0.1M PBS (pH=6.5). HQ concentrations (from a to j): 3, 5, 7, 15, 30, 40, 50, 60, 80 and 100μM (A), Differential pulse voltammograms of CA at G-LDH/GCE in the presence of 25μM HQ and 50μM RE in 0.1M PBS (pH=6.5). CA concentrations (from a to i): 3, 5, 10, 15, 20, 30, 50, 70 and 100μM (B).
3.6 Amperometric responses of the G-LDH/GCE
We also investigated the amperometric response of the G-LDH/GCE to the oxidation of HQ. From Figure 10, it can be seen that an increase of the oxidation current was obtained with the addition of 25μM HQ under stirring electrolyte solution at the applied potential of 0.125V. Afterward the injection of identical concentrations of CA and RE, there were only negligible current responses generated by CA and RE when compared with the dramatic current increase due to the addition of HQ. This behavior shows that the existence of CA and RE are not interfering in the selective determination of HQ at the G-LDH/GCE.
Figure 10. Amperometric response of the G-LDH/GCE to the sequential addition of 25μM HQ, 25μM CA and 25μM RE under stirring 0.1M PBS (pH=6.5). The applied potential at the modified working electrode was 0.125V.
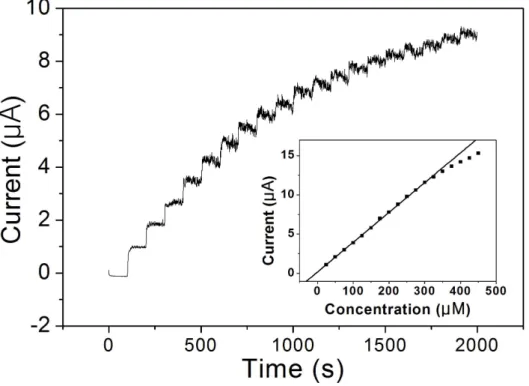
Figure 11 displays a typical amperometric response of the G-LDH/GCE upon the successive addition of HQ in the 0.1 M PBS (pH 6.5) aqueous solution under stirring at 0.125 V. A remarkable increase of the oxidation current was observed upon a subsequent addition of HQ. Inset is the calibration curve of the oxidation peak current vs. the concentration of HQ. A linear response was observed in the range from 6 μM to 325 μM with a correlation coefficient of 0.991, and the regression equation was ipa(μA)=0.169+0.038μM.
The detection limit is 0.077μM with a signal-to-noise ratio of 3, and the time to reach the 98% steady state response is less than 3s. The electroanalytical characteristics of some electrodes using other modification strategies to detect HQ are summarized in Table 1. The sensitivity and detection limit of our new strategy improve those of the other reported modified electrodes.
Figure 11. Amperometric response of the G-LDH/GCE to successive injection of 25μM HQ in 0.1M PBS (pH=6.5) under stirring. Applied potential:
0.125V. Insert: the calibration curve of the amperometric current vs.
concentration of HQ.
Electrode Method Linear range(μM)
Limit of
Detection Reference
LDHf/GCE DPV 12-800 9 14
Graphene/GCE DPV 1-50 0.015 33
Graphene-chitosan/GCE DPV 1-300 0.75 8
MWCNT/GCE DPV 1-100 0.75 5
Penicillamine/GCE DPV 15-115 1 6
PASA/MWCNT/GCE DPV 6-400 1 7
Mesoporous carbon
modified/GCE Amperometry 10-200 0.076 34
Pt-graphene
modified/GCE DPV 20-145 6 35
MWNTs/multielectrode
array Amperometry 1-100 0.3 36
Activated/GCE DPV 0.5-200 0.16 37
Mesoporous platinum
electrode DPV 20-1000 - 38
G-LDH/GCE Amperometry 6-325 0.077 This
work
Table 1. Comparison of analytical performance of on different modified electrodes.
LDHf: Zn/Al layered double hydroxide film; MWCNT: multiwall carbon nanotubes; PASA: poly-amidosulfonic acid.
3.7 Stability and reproducibility of the G-LDH/GCE
The stability of the G-LDH/GCE was investigated by measuring the current response with a 0.1mM HQ. After 100 continuous potential scanning cycles, the anodic and cathodic peak currents remain more than 98% of the initial current response, respectively. In addition, there was no observed peak potential shift in the cyclic voltammograms of HQ, indicating that the G-LDH composite on the surface of GCE is stable. To compare the reproducibility further, five different GCEs were modified with G-LDH composite film. And these electrodes were kept at room temperature for a week after their first measurements with a 0.1 mM HQ. A week later, those electrodes were measured again and the peak currents of them remained more than 97% and the relative standard deviation (R.S.D) was calculated 1.1%, which indicated that the G-LDH composite on the surface of GCE shows an acceptable level of reproducibility.
3.8 Sample analysis using G-LDH/GCE
In order to ascertain applicability of the newly devised electrode for the selective determination of HQ, local tap water samples were tested for quantitative analysis. The spike and recovery experiments were performed by measuring the amperometric responses to the samples containing the known concentrations of HQ because the amount of HQ was unknown in local tap water samples. The analytical performance of the G-LDH/GCE from the sample recovery tests are summarized in Table 2, showing that the recovery of HQ were in the range from 97.9% to 103.3%. These results demonstrates that the G-LDH/GCE could be exploited for the determination of HQ content in real samples.
Sample
No. Added HQ (μM) HQ found (μM) RSD (%) Recovery (%)
1 30 29.38 4.71 97.9
2 15 15.50 4.21 103.3
3 10 9.8 3.5 98.14
Table 2 Determination of HQ in local tap water samples.
4. Conclusion
This study has demonstrated that graphene and layered double hydroxides composite can be easily constructed using a co-electrodeposition technique on the surface of bare GCE, and that the G-LDH composite modified GCE is fairly stable and reproducible in the electrochemical determination of HQ.
Well-separated peaks and the significantly enhanced peak currents of dihydroxybenzene isomers were observed at the G-LDH/GCE, which clearly indicates that the modified electrode can be utilized for selective and sensitive detection of HQ simultaneously by using cyclic voltammetry and DPV. Under optimum conditions, the G-LDH/GCE showed well-separated oxidation peak potentials in a mixture of HQ, CA and RE. It also showed a low detection limit, good linearity and reliable recovery data in local tap water samples. These results demonstrate that the G-LDH/GCE can be used to analyze environmental samples containing HQ.
5. References
[1]. Rueda, M. E.; Sarabia, L. A.; Herrero, A.; Ortiz, M. C. Analytica Chimica Acta 2003, 479, 173.
[2]. Xie, T.; Liu, Q.; Shi, Y.; Liu, Q. Journal of Chromatography A 2006, 1109, 317.
[3]. Fujino, K.; Yoshitake, T.; Kehr, J.; Nohta, H.; Yamaguchi, M. Journal of Chromatography A 2003, 1012, 169.
[4]. Sirajuddin; Bhanger, M. I.; Niaz, A.; Shah, A.; Rauf, A. Talanta 2007, 72, 546.
[5]. Qi, H.; Zhang, C. Electroanalysis 2005, 17, 832.
[6]. Wang, L.; Huang, P. F.; Bai, J. Y.; Wang, H. J.; Zhang, L. Y.; Zhao, Y. Q. Microchimica Acta 2007, 158, 151.
[7]. Zhao, D.-M.; Zhang, X.-H.; Feng, L.-J.; Jia, L.; Wang, S.-F. Colloids and Surfaces B: Biointerfaces 2009, 74, 317.
[8]. Yin, H.; Zhang, Q.; Zhou, Y.; Ma, Q.; liu, T.; Zhu, L.; Ai, S.
Electrochimica Acta 2011, 56, 2748.
[9]. Cavani, F.; Trifirò, F.; Vaccari, A. Catalysis Today 1991, 11, 173.
[10]. de Melo, J. V.; Cosnier, S.; Mousty, C.; Martelet, C.; Jaffrezic-Renault, N. Analytical Chemistry 2002, 74, 4037.
[11]. Williams, G. R.; O'Hare, D. Journal of Materials Chemistry 2006, 16, 3065.
[12]. Touati, S.; Mansouri, H.; Bengueddach, A.; de Roy, A.; Forano, C.;
Prevot, V. Chemical Communications 2012, 48, 7197.
[13]. Sels, B.; Vos, D. D.; Buntinx, M.; Pierard, F.; Kirsch-De Mesmaeker, A.; Jacobs, P. Nature 1999, 400, 855.
[14]. Li, M.; Ni, F.; Wang, Y.; Xu, S.; Zhang, D.; Chen, S.; Wang, L.
Electroanalysis 2009, 21, 1521.
[15]. Gong, J.; Wang, L.; Song, D.; Zhu, X.; Zhang, L. Biosensors and Bioelectronics 2009, 25, 493.
[16]. Bai, P.; Fan, G.; Li, F. Materials Letters 2011, 65, 2330.
[17]. Gao, Z.; Wang, J.; Li, Z.; Yang, W.; Wang, B.; Hou, M.; He, Y.; Liu, Q.; Mann, T.; Yang, P.; Zhang, M.; Liu, L. Chemistry of Materials 2011, 23, 3509.
[18]. Wang, L.; Wang, D.; Dong, X. Y.; Zhang, Z. J.; Pei, X. F.; Chen, X.
J.; Chen, B.; Jin, J. Chemical Communications 2011, 47, 3556.
[19]. Malak-Polaczyk, A.; Vix-Guterl, C.; Frackowiak, E. Energy & Fuels 2010, 24, 3346.
[20]. Wang, Y.; Zhang, D.; Tang, M.; Xu, S.; Li, M. Electrochimica Acta 2010, 55, 4045.
[21]. Zhang, Y.; Tan, Y.-W.; Stormer, H. L.; Kim, P. Nature 2005, 438, 201.
[22]. Li, D.; Muller, M. B.; Gilje, S.; Kaner, R. B.; Wallace, G. G. Nat Nano 2008, 3, 101.
[23]. Wu, X.; Hu, Y.; Jin, J.; Zhou, N.; Wu, P.; Zhang, H.; Cai, C.
Analytical Chemistry 2010, 82, 3588.
[24]. Wang, D.; Choi, D.; Li, J.; Yang, Z.; Nie, Z.; Kou, R.; Hu, D.; Wang, C.; Saraf, L. V.; Zhang, J.; Aksay, I. A.; Liu, J. ACS Nano 2009, 3, 907.
[25]. Wang, Y.; Li, Y.; Tang, L.; Lu, J.; Li, J. Electrochemistry Communications 2009, 11, 889.
[26]. Shan, C.; Yang, H.; Song, J.; Han, D.; Ivaska, A.; Niu, L. Analytical Chemistry 2009, 81, 2378.
[27]. Guo, P.; Song, H.; Chen, X. Electrochemistry Communications 2009, 11, 1320.
[28]. Chen, D.; Feng, H.; Li, J. Chemical Reviews 2012.
[29]. Chen, L.; Tang, Y.; Wang, K.; Liu, C.; Luo, S. Electrochemistry Communications 2011, 13, 133.
[30]. Guo, H.-L.; Wang, X.-F.; Qian, Q.-Y.; Wang, F.-B.; Xia, X.-H. ACS Nano 2009, 3, 2653.
[31]. Kovtyukhova, N. I.; Ollivier, P. J.; Martin, B. R.; Mallouk, T. E.;
Chizhik, S. A.; Buzaneva, E. V.; Gorchinskiy, A. D. Chemistry of Materials 1999, 11, 771.
[32]. Yarger, M. S.; Steinmiller, E. M. P.; Choi, K.-S. Inorganic Chemistry 2008, 47, 5859.
[33]. Du, H.; Ye, J.; Zhang, J.; Huang, X.; Yu, C. Journal of Electroanalytical Chemistry 2011, 650, 209.
[34]. Bai, J.; Guo, L.; Ndamanisha, J. C.; Qi, B. Journal of Applied Electrochemistry 2009, 39, 2497.
[35]. Li, J.; Liu, C.-y.; Cheng, C. Electrochimica Acta 2011, 56, 2712.
[36]. Zhang, D.; Peng, Y.; Qi, H.; Gao, Q.; Zhang, C. Sensors and Actuators B: Chemical 2009, 136, 113.
[37]. Ahammad, A. J. S.; Sarker, S.; Rahman, M. A.; Lee, J.-J.
Electroanalysis 2010, 22, 694.
[38]. Ghanem, M. A. Electrochemistry Communications 2007, 9, 2501.
국문초록
Study on the detection of
hydroquinone using graphene and Zn/Al layered double hydroxide
composite
권연지
과학교육과 화학전공 서울대학교 대학원
하이드로퀴논은 벤젠고리에 두 개의 수산화기가 파라위치에 붙어있는 구 조의 페놀화합물 이다. 하이드로퀴논은 의약품, 화장품 원료, 염료, 사진 현상제 등 다양한 용도로 널리 사용되고 있다. 또한 하이드로퀴논은 자연 에서 발견 시 오염물질로 간주 되어, 하이드로퀴논을 검출하기 위한 다양 한 방법들이 연구되어왔다. 그중 전기화학적인 방법은 쉽고 빠르며 검출
을 하기 위한 비용이 적어 널리 사용되고 있다. 따라서 본 연구에서는 전 기화학적인 방법을 이용하여 하이드로퀴논을 검출하였다. 보다 선택적이 고, 낮은 농도까지 선형적으로 검출하기 위하여 Zn/Al 이중층수산화물- 그래핀 전극을 개발하여 이를 하이드로 퀴논을 분리 검출하는데 적용하였 다.
금속 이중층수산화물은 이온교환성 성질, 열적 안정성, 화학적 안정성, 층상구조 등의 특징으로 인하여 하이드로 퀴논을 검출하는데 사용되어왔 다. 하지만 전기화학에서 적용할시 낮은 전자전달 능력으로 인한 약한 전 기 전도성이 단점으로 지적되고 있다. 따라서 본 연구에서는 금속 이중층 수산화물에 그래핀을 도입하여 단점을 보완하고자 하였다.
그래핀은 탄소원자가 벌집모양으로 연결된 평면적 구조를 가진 물질로서 높은 전자 전도성과 뛰어난 안정성으로 인해 다양한 분야에서 응용되고 있는 소재이다. 따라서 본 연구에서는 그래핀의 빠른 전자전달 능력과 높 은 전자 전도성을 도입하여 금속이중층수산화물의 단점을 보완하였으며, 이 복합물을 하이드로퀴논을 검출하는데 적용하였다. 그 결과 최적 조건 하에서 하이드로 퀴논 의 농도가 6~325μM 의 범위 내에서 전류 값 이 농도에 선형적으로 비례하였으며, 검출 한계는 0.077μM 로 타 연구와 비 교 시 낮은 검출한계를 얻을 수 있었다. 또한 하이드로퀴논을 검출하는데 방해가 될 수 있는 하이드로퀴논의 이성체인 카테콜과 레소시놀로 부터 하이드로퀴논을 성공적으로 분리 검출할 수 있었다. 또한 본 연구에서 개 발한 방법으로 실제 수돗물을 이용하여 검출하였을 때 에도 성공적으로 적용할 수 있음을 확인하였다.
따라서 본 연구에서 제조한 Zn/Al 이중층수산화물-그래핀 전극을 이용
하여 다양한 실제 샘플에서 하이드로 퀴논을 선택적으로 검출하는데 적용 할 수 있을 것이라 기대된다.
핵심되는 말: 하이드로퀴논, 그래핀, 이중층상수산화물, 순환 전압-전류법
학번: 2010-23586