저작자표시-비영리-변경금지 2.0 대한민국 이용자는 아래의 조건을 따르는 경우에 한하여 자유롭게
l 이 저작물을 복제, 배포, 전송, 전시, 공연 및 방송할 수 있습니다. 다음과 같은 조건을 따라야 합니다:
l 귀하는, 이 저작물의 재이용이나 배포의 경우, 이 저작물에 적용된 이용허락조건 을 명확하게 나타내어야 합니다.
l 저작권자로부터 별도의 허가를 받으면 이러한 조건들은 적용되지 않습니다.
저작권법에 따른 이용자의 권리는 위의 내용에 의하여 영향을 받지 않습니다. 이것은 이용허락규약(Legal Code)을 이해하기 쉽게 요약한 것입니다.
Disclaimer
저작자표시. 귀하는 원저작자를 표시하여야 합니다.
비영리. 귀하는 이 저작물을 영리 목적으로 이용할 수 없습니다.
변경금지. 귀하는 이 저작물을 개작, 변형 또는 가공할 수 없습니다.
경영학박사학위논문
Essays on Corporate Strategies to Counter the Enforcement of Gift Taxes on the Benefits Tunneled through Abnormal Related-Party Sales
일감몰아주기 증여세 과세 도입에 대응한 기업의 전략에 대한 연구
2016 년 8 월
서울대학교 대학원 경영학과 경영학 전공
정 희 선
ABSTRACT
Essays on Corporate Strategies to Counter the Enforcement of Gift Taxes on the
Benefits Tunneled through Abnormal Related-Party Sales
Heesun Chung Business School Seoul National University
In this dissertation, which comprises of two related but independent essays, I examine how firms engage in strategies to counter the enforcement of gift taxes on the benefits tunneled through abnormal related-party sales (RPS). Prior studies document that related-party transactions (RPT) are a viable tool of transferring the wealth within a business group into the ultimate shareholders (Chang and Hong 2000; Liu et al. 2008; Jian and Wong 2010). Especially, in the products or services market, provided that buyers purchase their necessary inputs mostly from the related suppliers without any reasonable comparison for the quality or price of the products or services from non-related suppliers, the related sellers can increase sales volume easily, which may in turn increase their operating income. And this benefit will finally contribute to boosting the wealth of their shareholders, thereby widening wealth inequality and deteriorating fair competition in the industry. As a way to curb abnormal level of RPS transactions, regulators introduced gift taxes on the benefits tunneled through these transactions in 2012, which is
levied to the ultimate individual controlling shareholders. Below, I briefly explain the two essays in my dissertation.
The first essay examines whether and how managers reduce RPS transactions after the enforcement of gift taxes on RPS. Prior studies present the competing hypotheses for the role of RPT.
“Efficiency enhancing view” argues that firms engage in RPT with intent to reduce transaction costs in an imperfect market. On the other hand, “tunneling view” posits that RPT is a viable channel for transferring the wealth within a business group into the ultimate shareholders. From the tunneling view, the Korean regulators have had long concerns over abnormal amounts of RPS, and enforced gift taxes on the benefits tunneled through these transactions in 2012, which are levied to the ultimate individual controlling shareholders.
Since such taxes increase with the ratio of RPS to total sales above 30%, the sellers (beneficiary firms) whose shareholders are expected to pay the gift taxes may have incentives to reduce RPS after 2012.
However, this tax incentive may conflict with the purpose to enhance business efficiencies through RPS.
Using 1,456 firm-year observations over 2010-2013 and employing a difference-in-differences approach, I find that beneficiary firms are likely to reduce their RPS transactions after 2012, compared with non-beneficiary firms. However, this phenomenon is pronounced solely in the abnormal components of RPS estimated based on Jian and Wong’s (2010) methodology, not in its normal components. In addition, it is documented that the tendency of beneficiary firms to reduce RPS is more prevalent when they are in competitive markets than in non-competitive markets, or when the individual controlling shareholders have a higher percentage of ownership. These results suggest that gift taxes on RPS seem to induce managers of
beneficiary firms to reduce RPS transactions, especially when the resulting non-tax costs of losing business efficiencies (the following tax savings) are expected to be lower (higher).
In the second essay, I examine whether and how managers manage operating income (OI) in response to the introduction of gift taxes on RPS. Prior literature documents that managers opportunistically shift items within the income statement (e.g.
classifying operating expenses as non-operating expenses) to inflate core earnings. The second essay examines whether a firm changes its classification shifting (CS) behaviors driven by the tax incentive of its controlling shareholders. In Korea, if a firm recognizes abnormal levels of RPS after 2012, its individual controlling shareholders should pay gift taxes on the benefits tunneled through such transactions. And the taxable amount is calculated based on the after-tax OI generated by RPS that exceed 30% of total sales. This suggests that controlling shareholders of beneficiary firms may pressure managers to manipulate OI downward. However, this tax incentive may conflict with financial reporting incentive to inflate OI.
Using 1,460 firm-year observations from 2010 to 2013 and employing a difference-in-differences approach, I find that beneficiary firms exhibit a significant decline in OI-inflating CS activities after 2012, compared with non-beneficiary firms. Furthermore, this phenomenon tends to be more prominent when beneficiary firms do not finance in the public market, or when the percentage of shares owned by individual controlling shareholders is higher. These results suggest that gift taxes on RPS seem to deter managers from engaging in OI-inflating CS activities, especially when the financial reporting concerns over how to report OI are lower, or when the resulting tax savings are expected to be higher.
Keywords: related-party sales, tunneling, gift taxes, transaction costs, classification shifting, operating income
Student Number: 2011-30166
TABLE OF CONTENTS
Essay 1. Do Managers Reduce Related-Party Sales to Counter the Enforcement of Gift Taxes on the Benefits Tunneled through Abnormal Related-Party Sales?
I. Introduction...2
II. Institutional Background, Literature Review and Hypothesis Development...8
2.1. The enforcement of gift taxes on the benefits tunneled through abnormal RPS...8
2.2. RPS-reducing decision: Trade-off between non-tax and tax costs...9
2.3. The effect of non-tax costs on RPS-reducing decision...10
2.4. The effect of tax costs on RPS-reducing decision...13
III. Sample and Research Design ...14
3.1. Sample selection...14
3.2. Empirical model...16
3.2.1. Measuring normal/ abnormal RPS...16
3.2.2. Measuring market competition...17
3.2.3. Regression models ...18
IV. Empirical Results...22
4.1. Descript statistics...22
4.2. Main results...24
4.2.1. Test of H1a...24
4.2.2. Test of H1b...27
4.2.3. Test of H2...29
4.3. Sensitivity tests and additional analyses...30
4.3.1. Alternative definitions of variables ...30
4.3.2. Sensitivity tests for RPS-reducing decision...31
4.3.3. Implications for the subsequent social costs ...32
V. Conclusions...34
References...37
Appendix I. Normal/ Abnormal RPS Regressions...41
Essay 2. Do Managers Manage Earnings Using Classification Shifting to Counter the Enforcement of Gift Taxes on the Benefits Tunneled through Abnormal Related-Party Sales? I. Introduction...56
II. Institutional Background, Literature Review and Hypothesis Development...61
2.1. The enforcement of gift taxes on the benefits tunneled through abnormal RPS...61
2.2. The change in classification shifting behavior after the enforcement of gift taxes on RPS...62
2.3. The cross-sectional differences in financial reporting incentives ...65
2.4. The cross-sectional differences in tax reporting incentives ...67
III. Sample and Research Design ...67
3.1. Sample selection...67
3.2. Empirical model...69
IV. Empirical Results...75
4.1. Descript statistics...75
4.2. Main results...77
4.2.1. Test of H1...78
4.2.2. Test of H2...79
4.2.3. Test of H3...80
4.3. Sensitivity tests and additional analyses...81
4.3.1. Sensitivity tests for firm performance effects...81
4.3.2. Alternative definitions of variables...82
4.3.3. Controlling for the effect of change in accounting standards...83
4.3.4. Sensitivity tests for financial reporting costs...85
4.3.5. Trade-off between RPS-reducing decision and earnings management using CS...85
V. Conclusions...86
References...89
국문초록...107
LIST OF TABLES
Essay 1. Do Managers Reduce Related-Party Sales to Counter the Enforcement of Gift Taxes on the Benefits Tunneled through Abnormal Related-Party Sales?
Table 1 Variable Definitions...42
Table 2 Sample Distribution...43
Table 3 Descriptive Statistics ...44
Table 4 Pearson Correlation Matrix...45
Table 5 Univariate Tests between Beneficiary and Non-beneficiary Firms...48
Table 6 RPS-Reducing Decision to Counter the Enforcement of Gift Taxes on the Benefits Tunneled through Abnormal Level of RPS: H1a...49
Table 7 Market Competition and RPS-Reducing Decision: H1b...50
Table 8 Individual Controlling-Shareholder Ownership and RPS-Reducing Decision: H2...52
Table 9 Implications for the Subsequent Social Costs...53
Essay 2. Do Managers Manage Earnings Using Classification Shifting to Counter the Enforcement of Gift Taxes on the Benefits Tunneled through Abnormal Related-Party Sales? Table 1 Variable Definitions...93
Table 2 Sample Distribution...94
Table 3 Descriptive Statistics ...95
Table 4 Pearson Correlation Matrix...96 Table 5 Univariate Tests between Beneficiary and
Non-beneficiary Firms...97 Table 6 Regression of Unexpected Core Earnings on Transitory
Non-Operating Expenses as a Percentage of Sales Using Alternative Measures of Expected Core
Earnings...98 Table 7 The Change in Classification Shifting Behavior to
Counter the Enforcement of Gift Taxes on the Benefits Tunneled through Abnormal RPS: Hypothesis 1...99 Table 8 The Effect of Public Financing on the Change in
Classification Shifting Behavior: Hypothesis 2...100 Table 9 The Effect of Individual Controlling-shareholder
Ownership on the Change in Classification Shifting Behavior: Hypothesis 3...102 Table 10 Sensitivity Tests and Additional Analyses...104
Essay 1. Do Managers Reduce Related-Party Sales to Counter the Enforcement of Gift Taxes on the Benefits Tunneled through Abnormal Related-Party Sales?
I. Introduction
There are two competing hypotheses in determining the role of related-party transactions (hereafter, RPT) within a business group.
First, the efficiency enhancing view argues that firms can reduce transaction costs1) through RPT in an imperfect market (Williamson 1975). In contrast, the tunneling view posits that RPT provides a convenient channel through which the wealth within a business group can be transferred into the ultimate shareholders at the expense of minority shareholders (Chang and Hong 2000; Liu et al. 2008). From the tunneling view, regulators in Korea have had long concerns about abnormal levels of related-party sales (hereafter, RPS).2) Specifically, through these transactions, sellers which are generally in the low layer of the pyramidal business group can abnormally inflate their sales volume without any competition with other suppliers in the industry for the quality or price of the products or services. This deteriorates fair competition in the industry. Furthermore, since the benefit will finally lead to boosting the wealth of the ultimate shareholders, it results in widening wealth inequality. Accordingly, as 1) Dahlman (1979) presents that transaction costs consist of search and information costs, bargaining and decision costs, policing and enforcement costs: whereas search and information costs are costs of determining that the required good is available on the market, bargaining costs are the costs required to come to an acceptable agreement with the other party in the transaction. Lastly, policing and enforcement costs are the costs of confirming the other party follows the terms of the contract.
2) A business group can transfer or tunnel its wealth to the ultimate owner through various tactics. For example, the affiliated firm can give each other high (or low) interest rate loans, manipulate transfer prices, or sell assets to each other at above or below market prices (Bertrand et al.
2002). As one of these ways, Korean regulators have been recently concerned about its abnormal scale in products or services markets, and introduced gift taxes on such abnormal levels of RPS in 2012.
a way to curb these transactions, the regulators enforced gift taxes on the benefits tunneled through abnormal levels of RPS3) in 2012.
Given that the tax increases with the ratio of RPS to total sales above 30%, sellers (hereafter, beneficiary firms), whose shareholders are expected to pay gift taxes on RPS may have incentives to reduce RPS transactions after 2012. This is consistent with the purpose that the regulators introduced such gift taxes.
However the aforementioned efficiency enhancing view suggests that reducing RPS may incur non-tax costs of losing business efficiencies.
These imply that managers will face a trade-off between tax and non-tax costs in deciding whether or not to reduce RPS transactions to counter the enforcement of gift taxes on RPS. Therefore, I view that it is an interesting empirical question to examine whether and how beneficiary firms change their RPS activities after 2012, and which implications we can infer from the results.
To the extent that PRS plays aforesaid two competing roles, I assume that a firm’s decision whether or not to reduce the levels of RPS after 2012 will depend on the reason why a business group has engaged in RPS transactions. Specifically, if it has arranged RPS in a normal business process driven by the incentives to enhance business efficiencies4), it is likely to retain it even after 2012 because curtailing
3) The Korean tax law stipulates the abnormally high levels of RPS, based on the ratio of RPS to total sales above 30%.
4) Vertical integration and the following RPS transactions may be desirable in a way to enhance business efficiencies and firm performance. As a relevant example, Muller (2009) presents that whereas Toyota outsources little and Japanese automaker-supplier relations are strategically segmented between partner- and arm’s length suppliers, US automakers have outsourced much and relations got worse, which induces the US automakers to face ongoing crisis. This implies that supplier relationship may be decisive for firm performance, and related suppliers can be one solution.
the existing transactions and making new contracts with other non-related parties may incur high transaction costs that outweigh the resulting tax savings (Khanna and Palepu 1997, 2000). On the other hand, in a case that a business group has exploited RPS with other purposes such as a tool for tunneling its wealth to the ultimate shareholders, it would likely accomplish that aim through the other cost-effective channels instead of RPS that may incur tax costs to its ultimate shareholders. To specify these predictions, I adopt the following two approaches.
First, as a way to identify a firm’s intention of engaging in RPS transactions, Jian and Wong (2010) suggest classifying RPS into normal and abnormal components by using RPS model. Specifically, they assume that whereas the predicted term in the RPS model, referred to as normal RPS, is related to a firm's normal business activities, the error term, referred to as abnormal RPS, captures other incentives such as tunneling, propping an d earnings management (Jian and Wong 2010; Chen et al. 2012; Yeh et al. 2012). This implies that whereas reducing normal components of RPS can be detrimental to a firm’s operations, curtailing abnormal RPS does not likely cause such damages. Thus, I postulate that beneficiary firms are more (less) likely to reduce abnormal (normal) RPS after 2012, compared with non-beneficiary firms that are not associated with the enforcement of gift taxes on RPS.
In addition, I follow the argument of Aghion et al. (2006) that a firm’s necessity for RPS depends on market competition. To further discuss, I presume that with regard to abnormal levels of RPS-transactions, the final decision maker will be a buyer presumably in the upper layer of a pyramidal business group. The final decision maker, a buyer can have many outside options to
choose at competitive prices from non-related providers in competitive markets than in non-competitive markets. This implies that although a buyer stops the existing purchases from related suppliers, they can be replaced with the ones from non-related suppliers at relatively low opportunistic costs, in the former markets than in the latter markets (Williamson 1975, 1985). On the other hand, in the non-competitive markets where a buyer has lower bargaining power than a supplier, the buyer may have stronger incentives to formulate its internal markets to limit bargaining inefficiencies, and thus, is likely to be reluctant to reduce related-party purchases (RPP). Therefore, I predict that beneficiary firms are more likely to reduce abnormal levels of RPS transactions when they are in competitive markets than in non-competitive markets.
Lastly, I also consider managers’ differential concerns over shareholder-level tax costs. Specifically, I assume that the decision of whether or not to reduce abnormal levels of RPS will be influenced by the percentage of shares owned by individual controlling shareholders for the following reasons. First, a high percentage of controlling-shareholder ownership by itself indicates high gift tax costs because the formula to calculate gift taxes on RPS includes that percentage. Second, a higher percentage of controlling-shareholder ownership implies that those controlling shareholders can pressure managers to reduce RPS activities for their tax purposes. Therefore, I predict that beneficiary firms will exhibit higher decrease in RPS transactions after 2012, when the percentage of shares owned by individual controlling shareholders is higher.
My empirical findings are summarized as follows. First, I find that beneficiary firms are likely to decrease their RPS activities after 2012, compared with non-beneficiary firms. Second, it is documented
that these phenomena are pronounced only in the abnormal components of RPS, not in its normal parts. Furthermore, beneficiary firms are shown to exhibit higher decrease in RPS transactions when they are in competitive markets than in non-competitive markets.
Lastly, my findings reveal that the tendency of beneficiary firms to reduce RPS transactions after 2012 is more prevalent when the percentage of shares owned by individual controlling shareholders is higher. These findings suggest that the enforcement of gift taxes on RPS induces managers of beneficiary firms to reduce their RPS activities, especially when the expected tax savings outweigh the resulting costs of losing business efficiencies. My test results are robust to alternative definitions of beneficiary firms, normal/ abnormal RPS and competitive/ non-competitive markets. In the further analysis, I find that although beneficiary firms reduce their RPS transactions after 2012, their total sales do not change significantly.
This study contributes to the literature on RPT. First, this is the first study to examine a trade-off between tax and non-tax costs in managers’ decisions on RPS transactions. The enforcement of gift taxes on RPS in Korea offers a natural setting for a study to examine how managers adjust the levels of RPS transactions according to their relevant concerns over tax and non-tax costs.
Second, while prior studies have investigated the two competing roles of RPS within a business group (Chang and Hong 2000; Jian and Wong 2010; Peng et al. 2011; Chen et al. 2012; Yeh et al. 2012), there is little research to examine how managers can change the levels of RPS depending on their purposes to engage in it. My findings show that after abnormal levels of RPS may incur additional costs to their shareholders, managers tend to adjust the levels according to the intention that they carry out such transactions. I believe that this
study will enlarge our understanding of how RPS transactions are arranged within a business group.
My findings also provide important policy implications. First, my further analysis reveals that even though beneficiary firms stop abnormal levels of RPS, they seem to replace them with non-RPS, thereby implicating that the enforcement of gift taxes on RPS do not shrink market size of those firms. Second, with regard to the finding of H1b that the tendency of beneficiary firms to reduce RPS transactions after 2012 is more prevalent in competitive markets than in non-competitive markets, this indirectly suggests that non-related suppliers in the former markets seem to secure a new channel for their sales transactions, thereby implicating that the opportunities for sales transactions are shared between related and non-related suppliers. This is also consistent with the intention of regulators to enforce such gift taxes. Lastly, my findings reveal that whereas business groups with tunneling incentives may lessen the gift tax liability of ultimate shareholders by reducing the levels of RPS transactions, those with efficiency-enhancing purposes are likely to assume the tax burden unless they take another action to avoid it.
This suggests that the relevant regulations need to be revised in a way to tax the suitable beneficiaries, not to obstruct normal business activities.
This study proceeds as follows. Section II analyzes the related institutional background, discusses the prior literature and develops the hypotheses. Section III details sample selection and research design. Section IV lays out descriptive statistics, the main empirical results, and the results of additional analyses. Finally, Section V sets forth my conclusion.
II. Institutional Background, Literature Review and Hypothesis Development
2.1. The enforcement of gift taxes on the benefits tunneled through abnormal related-party sales
Prior studies argue and document that business groups use RPT to tunnel resources to the ultimate shareholders at the expense of minority shareholders (Chang and Hong 2000; Liu et al. 2008).
Relatedly, Peng et al. (2011) point out that tunneling is the major behavior of controlling shareholders when firms affiliated with a business group engage in RPT. Especially, considering that more than two-thirds of firms in East Asia are controlled by a single shareholder, separation of management from ownership control is rare, which facilitates relation-based business networks (Ball et al. 2003;
Claessens et al. 2003; Hwa et al. 2011). Thus, managers’ decisions on RPS transactions are likely to be under the influence of family-controls, and they seem to arrange such transactions for the benefits of controlling shareholders at the expense of minority shareholders. In line with this tunneling view, the Korean regulators have had long concerns over abnormal levels of RPS, and as a relevant sanction to limit these transactions, they enforced gift taxes on the benefits tunneled through such transactions in 2012, which is levied to the ultimate individual controlling shareholders. And the taxable income is calculated by multiplying the following three components: 1) after-tax operating income, 2) ratio of RPS to total sales above 30%, and 3) percentage of shares owned by any individual controlling shareholder above 3%. The first two components in the formula indicate that after-tax operating income generated by abnormal levels of RPS is regarded as the benefits tunneled through
those transactions. In addition, the last component should be multiplied because gift taxes are levied at each individual level.
Specifically, any individual controlling shareholder should calculate his/her own taxable income by multiplying after-tax operating income generated by abnormal levels of RPS and the percentage of his/her ownership above 3%.
2.2. RPS-reducing decision: Trade-off between non-tax and tax costs
Since high levels of RPS may incur gift tax costs to the individual controlling shareholders after 2012, a business group may have weak incentives to arrange RPS transactions above the threshold designated by law, which likely induces beneficiary firms to reduce their RPS transactions. This conjecture seems to be supported by the government statistics and the related prior study. For example, Fair Trade Commission (hereafter, FTC) presents that overall, the largest 49 business groups reduce the amounts of RPS as well as the ratio of RPS over total sales after 2012. More relevantly, Lee et al.
(2015) document that beneficiary firms reduce the ratio of RPS to total sales after 2012, compared with non-beneficiary firms.
However, this RPS-reducing decision oriented by tax incentives can be obstructive to the positive role of RPS, if any. For example, prior studies argue that information asymmetry between suppliers and buyers in an imperfect market makes it costly to establish reliable contractual relationships, and these bargaining costs can be largely reduced through RPS by forming their own internal market (Williamson 1975; Khanna and Palepu 1997, 2000). Especially, the Korean business group setting seems to have confirmed this argument: after the Korean War in 1950, there was scarce business
infrastructure such as reliable suppliers. Accordingly, entrepreneurs had to rely on internal markets to acquire necessary inputs for their business, which induces such a business group to be extremely diversified and highly integrated so far (Chang and Choi, 1988; Chang and Hong 2000). These imply that RPS have played a constructive role in limiting bargaining inefficiencies in Korea. Thus, although RPS transactions came to be costly after the enforcement of gift taxes on RPS, beneficiary firms may be reluctant to decrease it. Relatedly, the media states that the gift taxes are levied even on a normal transaction, which hinders business activities. These discussions imply that there is a trade-off between tax and non-tax costs in the RPS-reducing decision in response to the enforcement of gift taxes on RPS. Thus, I predict that after 2012, beneficiary firms are likely to reduce RPS, when the resulting non-tax costs (tax savings) are expected to be low (high).
2.3. The effect of non-tax costs on RPS-reducing decision In the first analysis, I assume that a firm’s decision on whether or not to reduce RPS transactions after 2012 will be influenced by a business group’s purposes to engage in it. For example, if a business group has engaged in RPS with intent to transfer its wealth to the ultimate shareholders, it is likely to search for the other cost-effective channels to accomplish that aim, rather than to engage in RPS transactions that may incur gift tax costs to the ultimate shareholders. However, provided that RPS have been used in a normal business process to enhance business efficiencies, such business groups are likely to retain it because giving up the existing transactions and making new contracts with non-related parties may incur high transaction costs that may outweigh the
resulting tax savings (Khanna and Palepu 1997, 2000). Consequently, I conjecture that whereas beneficiary firms with tunneling incentives likely reduce RPS after 2012, those with efficiency-enhancing purposes will have weak incentives to make such a tax-oriented decision. To specify these two sorts of incentives in RPS transactions, I adopt the following two approaches.
Jian and Wong (2010) classify RPT as normal or abnormal components in a similar way of drawing discretionary accounting accruals. Specifically, they view that in the RPS model, the predicted term that is determined by industry classification and some firm characteristics such as size, leverage and growth, is associated with normal business activities, and thus refer to it as normal RPS. On the other hand, they regard the error term as being related to purposes other than normal business process, thereby referring to it as abnormal RPS. Following these classifications, Jian and Wong (2010) document that firms tend to prop up earnings by using abnormal RPS to their controlling owners. This methodology has been extensively used in the recent literature. For example, Yeh et al.
(2012) find that abnormal levels of RPS are positively correlated with the condition that firms plan to issue seasoned equity next period and the condition of a decrease in the reported earnings. These findings support the presumption that abnormal RPS estimated based on the methodology of Jian and Wong (2010) is associated with incentives other than normal business activities. Based on these findings, I posit that reducing the abnormal components of RPS will be less harmful to a firm's operations compared with reducing its normal components, and hypothesize as follows:
H1a: After the enforcement of gift taxes on related-party sales in 2012, beneficiary firms are more (less) likely to reduce abnormal
(normal) related-party sales compared with non-beneficiary firms.
In addition, a firm’s necessity for RPS can be captured by the extent of market competition following the argument of Aghion et al.
(2006). For the discussions, I first need to identify who initiates abnormal levels of RPS transactions within a business group. I assume that a buyer that is likely in the upper layer of a pyramidal business group will determine whether to formulate internal market by setting up a related supplier or to purchase their necessities from outside non-related parties. In competitive markets, the natural final decision makers, buyers are better informed about their transacting parties’ actions (Hart 1983), implying the existence of low information asymmetry. In addition, they seem to have many options to choose at competitive prices from non-related suppliers in competitive markets, implying that they have higher bargaining power than suppliers.
Accordingly, buyers in such markets may have weak incentives to formulate internal market from a transaction cost perspective (Aghion et al. 2006). Nonetheless, if a business group is vertically integrated and arranges abnormal levels of RPS in competitive markets, these transactions are likely to be associated with purposes other than limiting bargaining inefficiencies. On the other hand, suppliers in non-competitive markets have higher bargaining power than buyers do, and influence buyers' operations by raising prices, lowering quality, or reducing availability of their products. In these markets, RPT seem to be a useful tool for buyers to limit bargaining inefficiencies (Williamson 1975, 1985). Taken together, these discussions suggest that reducing RPT is more harmful to a business group in non-competitive markets than that in competitive markets.
Therefore, I predict that beneficiary firms in competitive markets will
exhibit a higher decrease in RPS after 2012 than those in non-competitive markets, and hypothesize as follows:
H1b: After the enforcement of gift taxes on related-party sales in 2012, beneficiary firms are more likely to reduce related-party sales when they are in competitive markets than in noncompetitive markets.
2.4. The effect of tax costs on RPS-reducing decision
From a tax perspective, I conjecture that the decision on whether or not to reduce RPS transactions after 2012 will depend on managers' concerns over shareholder-level tax costs. Specifically, I assume that the percentage of shares owned by individual controlling shareholders is an important factor to induce managers to curtail their RPS transactions after 2012, for the following reasons: First, a high percentage of controlling-shareholder ownership implies that such shareholders can pressure managers to reduce RPS transactions for their gift tax purposes. In addition, a high percentage of controlling-shareholder ownership by itself indicates high gift tax costs because gift taxes on RPS are calculated by reflecting that component. These suggest that beneficiary firms with a high percentage of individual controlling-shareholder ownership are more likely to reduce RPS transactions after 2012. Thus, I hypothesize as follows:
H2: After the enforcement of gift taxes on related-party sales in 2012, beneficiary firms are more likely to reduce related-party sales when the percentage of shares owned by individual controlling shareholders is higher.
III. Sample and Research Design
3.1. Sample selection
My initial sample comprises firms affiliated with business group according to the Monopoly Regulation and Fair Trade Act, referred to as chaebols from 2010 to 2013. They are large business groups where controlling shareholders can exert control over all group affiliates through indirect pyramidal and circular ownership structure (La Porta et al. 1999; Almeida et al. 2011). RPS are mostly arranged by these large conglomerate organizations as a way of tunneling or propping.5) Relatedly, the Korean National Tax Service (hereafter, NTS) presents that gift taxes on abnormal levels of RPS have been mostly levied by controlling shareholders of chaebols after its enforcement.6) Accordingly, I use chaebols to test my hypotheses.
I obtain the list of chaebols from the OPNI website operated by FTC. In addition, I manually collect such affiliated firms' data on RPS and ownership structure from financial statement footnotes and the public announcement of the current status of chaebols, which are provided in the DART website operated by Financial Supervisory Service. I obtain the financial information data of these firms from the KIS-Value database, which is operated by the Korean Information Service (KIS).7) I only include firms audited by external auditors, following the Act on External Audit of Corporations, and exclude finance companies from the sample because their financial reporting
5) Johnson et al. (2000) argue that the expropriation threat is especially big in business groups.
6) The NTS reports that they collected KRW 186 billion and KRW 124 billion for the fiscal years of 2012 and 2013, respectively, as gift taxes on RPS. Among these, 43.09% and 82.53% were levied from the individual controlling shareholders of chaebols in 2012 and 2013, respectively.
7) KIS is the largest credit-rating agency in Korea and is affiliated with Moody’s Investors Services.
environment differs from that of other companies. The difference-in-differences methodology employed for my hypotheses tests requires two-year observations immediately before and after gift taxes on RPS are enforced, respectively. In addition, to test my hypotheses with balanced panel data, if any required data during the four consecutive years for a firm is missing, I remove the whole observations of that firm. Finally, the final sample consists of 1,456 firm-year observations.8)
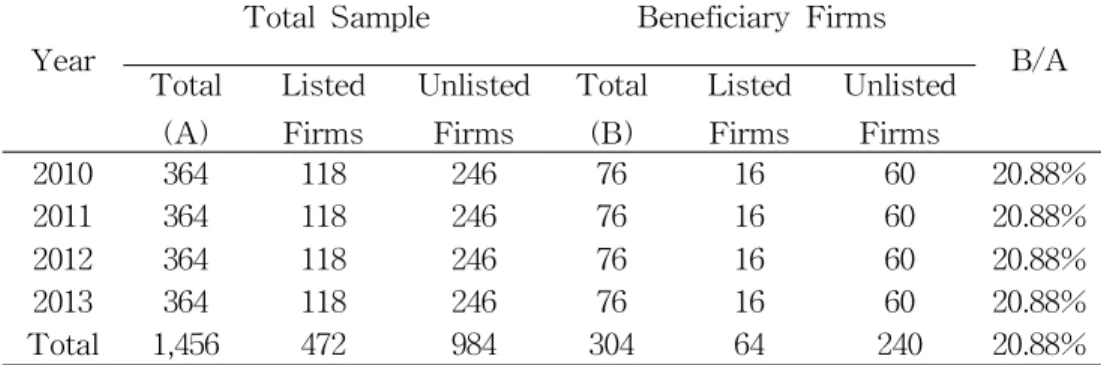
Table 2 shows the number of observations by year for the total and beneficiary samples. Firm are classified as beneficiary firms, if all the following conditions are satisfied based on the year of 2011, which is just before the enforcement of gift taxes on abnormal levels of RPS: 1) the ratio of RPS over total sales exceeds 30%, and 2) the percentage of shares owned by any individual controlling shareholder is above 3%.9) In addition, considering that gift taxes on RPS are calculated based on after-tax operating income generated by abnormal levels of RPS, if the value is negative for the previous two consecutive years, I assume that these firms will retain the negative performance after 2012, and classify these firms as non-beneficiary firms.10) As a result, among 1,456 observations, 304 firm-years are 8) The final sample does not include firms that were merged with the ones within that business group after 2012, because the controlling shareholders of those firms have already avoided gift taxes on RPS by transforming RPS transactions into inside ones within a firm.
9) Gift taxes are levied at the individual level. Accordingly, the tax law stipulates that if any controlling shareholder is a corporation, any individual controlling shareholder of such a corporate shareholder will be subjected to gift taxes on RPS. Thus, I consider both direct and indirect ownership.
10) Among firms that satisfy the aforementioned two requirements in the full sample, 20 firm-years report negative after-tax operating income for the two consecutive years of 2010 and 2011. Although I reclassify these observations into beneficiary firms, the results remain qualitatively similar.
classified as beneficiary firms whose individual controlling shareholders are expected to pay gift taxes on their abnormal levels of RPS after 2012. Table 2 shows that the ratio of beneficiary firms to total firms is about 20.88%. This ratio is much higher than the ratio provided by the NTS (12.90%) based on the actual gift tax return of 2012. Such a higher ratio in my sample seems to be reasonable, considering that it is based on the ex-ante expectation in 2011, before the potential beneficiary firms actually engage in viable tactics to decrease the shareholder-level tax costs (e.g. RPS-reducing decision, operating income management, etc.).
[Insert Table 2 here]
3.2. Empirical model
3.2.1. Measuring normal/ abnormal RPS
As a proxy to identify a firm’s incentives in engaging in RPS, I use the concept of normal and abnormal RPS, adopting the methodology of Jian and Wong (2010). They classify RPS into normal and abnormal components, by using the following model:
RPSjt = α0 + α1TAjt + α2DEBTjt + α3GROWTHjt
+Industry fixed effects + εjt, (1) where for firm j and year t, RPS is the ratio of domestic related-party sales to total sales11); TA is a natural logarithm of total assets; DEBT is total debts divided by total assets; GROWTH is the change in total assets from the previous year to the current year divided by lagged total assets; PROS is return on sales in the previous year; LISTED is an indicator variable that equals one if the firm is listed in the capital market, and zero otherwise; AGE is a
11) Gift taxes on RPS are applied only to domestic RPS, not to foreign RPS. Thus, I use domestic RPS measures in the RPS model.
natural logarithm of firm age; all other variables are as previously defined. I also include controls for industry fixed effects and run the regression year-by-year. In Eq. (1), whereas the estimated predicted value is classified as normal RPS, the residual term is the measure of abnormal RPS. The regression results are presented in Appendix 1.
The RPS model for the four years has an adjusted R-square ranging from 0.1039 to 0.1164. The coefficients on TA are negative and statistically significant in all the four years, indicating that small firms are more likely to engage in RPS. DEBT is significantly negative only in 2012. The industry of professional, scientific and technical activities is shown to have high ratio of RPS to total sales.
3.2.2. Measuring market competition
As an alternative way to identify a firm’s necessity for RPS, I use a degree of market competition, industry Herfindahl index (IHERF). The Herfindahl index is extensively used as a proxy for industry concentration and competition, which is calculated as follows (Berger and Hann 2007):
IHERFj =
[sij/Sj]2, (2)
where for industry j and firm i, s is a firm’s sales in the industry, as defined by a two-digit Standard Industrial Classification code; S is the sum of sales for all firms in the industry; s/S is a firm’s market share in the industry; n is the number of firms in the industry. A high IHERFj implies a low level of industry competition for industry j. My interest variable PMC is the rank transformation of one minus IHERF. Therefore, a high PMC implies a high level of industry competition.12)
12) When I estimate the industry Herfindahl index, I do not restrict the
3.2.3. Regression models
H1 predicts that beneficiary firms are more (less) likely to reduce abnormal (normal) RPS after 2012, compared with non-beneficiary firms. To test this prediction, I employ the difference-in-differences methodology. Specifically, if firms are expected to belong to beneficiary firms after 2012, they may have incentives to decrease their RPS transactions after that year with intent to reduce the shareholder-level tax costs. By contrast, non-beneficiary firms may not have differential incentives in engaging in RPS before and after 2012. Accordingly, I include non-beneficiary firms to control for changes in RPS that are unrelated to the enforcement of gift taxes on RPS. Thus, the sample firms consist of beneficiary firms, plus a benchmark group of non-beneficiary firms. I first confirm whether beneficiary firms engage in RPS-reducing strategy after 2012, compared with non-beneficiary firms, by using the following model of Eq. (3-a) (Jian and Wong 2010). And then I examine whether this phenomenon is shown in determining normal or abnormal RPS through Eq. (3-b) as follows:
RPSjt = β0 + β1BFjt + β2POSTjt + β3BFjt*POSTjt + β4TAjt
+ β5DEBTjt + β6GROWTHjt + β7PROSjt + β8LISTEDjt
+ β9AGEjt + β10CSHjt + β11TOP10jt + Year Effects
+ Industry Effects + εjt, (3-a)
NRPSjt (or ABRPSjt) = β0 + β1BFjt + β2POSTjt
+ β3BFjt*POSTjt + β4PROSjt + β5LISTEDjt + β6AGEjt
+ β7CSHjt + β8TOP10jt + εjt (3-b) where for firm j and year t, NRPS is the predicted value from the
sample to firms affiliated with business group, and use all firm-year observations audited by external auditors which include both listed and unlisted firms during my sample period.
RPS model of Eq. (1); ABRPS is the residual term from Eq. (1); BF is an indicator variable that equals one if the firm satisfies the following conditions in 2011, and zero otherwise: 1) the firm does not report after-tax operating loss for the previous two consecutive years, 2) ratio of RPS over total sales exceeds 30%, and 3) the percentage of shares owned by any individual controlling shareholder is above 3%13); PROS is return on sales in the previous year; LISTED is an indicator variable that equals one if the firm is listed in the capital market, and zero otherwise; AGE is a natural logarithm of firm age;
CSH is the percentage of shares owned by controlling shareholders;
TOP10 is an indicator that equals one if the firm belongs to top10 business groups; all other variables are as previously defined. In Eq.
(3-a), the variable of interest is the interaction term, BF*POST which captures the change of RPS in beneficiary firms after 2012, relative to the corresponding change in non-beneficiary firms. The negative coefficient of β3 will evidence the existence of RPS-reducing decisions of beneficiary firms after 2012. After such a test, I replace the dependent variable RPS with NRPS or ABRPS in Eq. (3-b).
H1a predicts that the coefficient on BF*POST is significantly negative only in the regression estimated for the dependent variable, ABRPS, not in that for the dependent variable, NRPS.
As for control variables, PROS is included following Jian and Wong (2010) and Chen et al. (2012). In addition, I include a firm’s listing status (LISTED) because my sample comprises both listed and unlisted firms, and a firm's dependency on RPS and its purposes for those transactions are expected to differ between the two groups.
Specifically, unlisted firms are more likely to engage in RPS 13) Holding companies are classified as non-beneficiary firms irrespective of whether or not to satisfy the requirements, because those shareholders are exempted from gift taxes on RPS according to the current tax law.
transactions with tunneling incentives compared with listed firms. For firm age (AGE), I expect that beneficiary firms tend to be relatively at the initial stage of their operations. Firms with higher controlling-shareholder ownership are more likely to engage in RPS transactions with tunneling incentives because the benefits from such transactions are expected to be higher for those firms. Lastly, I include TOP10 business groups dummy (TOP10) as a proxy for political costs. Politically sensitive firms are expected to less engage in abnormal levels of RPS transactions in order to allay public criticism or government intervention in their business affairs (Raffournier 2006). On the other hand, it is also likely that such visible business groups can avoid close scrutiny from regulators by exploiting their connections, and possibly engage in RPS transactions more (Depoers 2000).
Next, H1b predicts that beneficiary firms in competitive markets have stronger incentives to reduce RPS after 2012, relative to those in non-competitive markets. To test this prediction, I use the following models of Eqs. (4-a) and (4-b) for the full and beneficiary sample, respectively (Aghion et al. 2006):
RPSjt = β0 + β1BFjt + β2HPMCjt + β3POSTjt
+ β4BFjt*HPMCjt + β5HPMCjt*POSTjt + β6BFjt*POSTjt
+ β7BFjt*POSTjt*HPMCjt + β8TAjt + β9DEBTjt
+ β10GROWTHjt + β11PROSjt + β12LISTEDjt + β13AGEjt
+β14CSHjt + β15TOP10jt + Year Effects
+ Industry Effects + εjt, (4-a)
NRPSjt (or ABRPSjt) = β0 + β1BFjt + β2HPMCjt + β3POSTjt
+ β4BFjt*HPMCjt + β5HPMCjt*POSTjt + β6BFjt*POSTjt
+ β7BFjt*POSTjt*HPMCjt + β8PROSjt + β9LISTEDjt
+ β10AGEjt + β11CSHjt + β12TOP10jt + εjt (4-b) where for firm j and year t, HPMC is an indicator variable that
equals one if the industry Herfindahl index of the firm is below the median, and zero otherwise; all other variables are as previously defined. In Eq. (4-a), the variable of interest is BF*POST*HPMC which captures the change of RPS in beneficiary firms in competitive markets, relative to the corresponding change in beneficiary firms in non-competitive markets. The negative coefficient of β7 will support the argument of H1b that the tendency of beneficiary firms to cut the ratio of RPS to total sales will be more prevalent in competitive markets than in non-competitive markets. Especially, in Eq. (4-b), if the coefficient on BF*POST*HPMC is negative only for the regression with ABRPS as a dependent variable, not for that with NRPS as a dependent variable, it will strongly support H1a as well as H1b.
Lastly, to test H3 whether managers’ differential concerns about the shareholder-level tax costs influence their decisions to reduce RPS transactions after 2012, I use the following model of Eqs.
(5-a) and (5-b) for the beneficiary firm sample:
(Beneficiary sample)
RPSjt = β0 + β1HICSHjt + β2POSTjt + β3HICSHjt*POSTjt
+ β4TAjt + β5DEBTjt + β6GROWTHjt + β7PROSjt
+ β8LISTEDjt + β9AGEjt + β10CSHjt + β11TOP10jt
+ Year Effects + Industry Effects + εjt (5-a) NRPSjt (or ABRPSjt) = β0 + β1HICSHjt + β2POSTjt
+ β3HICSHjt*POSTjt + β4PROSjt + β5LISTEDjt
+ β6AGEjt + β7CSHjt + β8TOP10jt + εjt (5-b) where for firm j and year t, HICSH is an indicator that equals one if the percentage of shares owned by individual controlling shareholders is above the median; all other variables are as previously defined. In Eq. (5-a), the variable of interest is the interaction term, HICSH *POST which captures the change of RPS
in beneficiary firms with the above-median individual controlling shareholder ownership, relative to the corresponding change in beneficiary firms with the below-median individual controlling shareholder ownership. The negative coefficient on HICSH *POST indicates that the tendency of beneficiary firms to reduce the ratio of RPS to total sales is more prominent when the individual controlling shareholders have a higher percentage of ownership. Further, to test whether the results are robust according to a beneficiary firm's incentives for RPS transactions, I repeat the analysis after replacing RPS with NRPS or ABRPS in Eq. (5-b). If the negative coefficient on HICSH *POST is only pronounced in the regression with ABRPS as a dependent variable, not in that with NRPS as a dependent variable, it will support H1a as well as H2.
IV. Empirical Results
4.1. Descriptive statistics
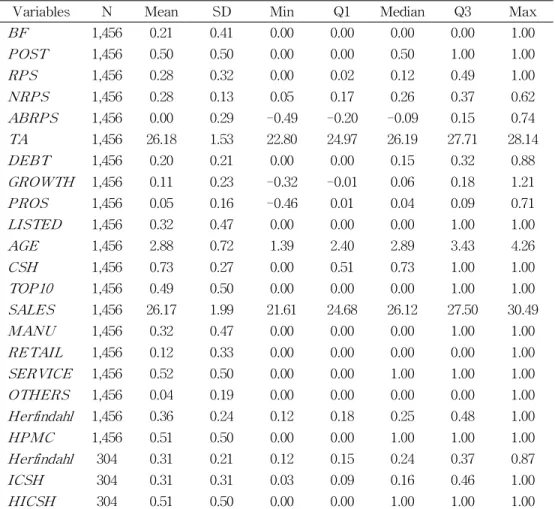
Table 3 presents descriptive statistics for the variables used in my hypotheses tests. All continuous variables are winsorized at the 1% and 99% levels to mitigate the influence of outliers. The mean value of BF is 0.21, indicating that 21% of my sample firms belong to beneficiary firms whose individual controlling shareholders are expected to pay gift taxes on RPS after 2012. RPS has a mean (median) value of 0.28 (0.12). While NRPS has a mean (median) value of 0.28 (0.26), ABRPS has a mean (median) value of 0.00 (-0.09). The mean firm size (TA) is 26.18, which is equivalent to KRW 234,397 million. The mean value of LISTED is 0.32, indicating that 32% of my sample is listed in the capital market. The mean values of MANU and SERVICE, 0.32 and 0.52, respectively, indicate that my sample mostly consists of firms with industry membership of
manufacture and service. While Herfindahl ranges from 0.12 to 1.00 for the full sample, it ranges from 0.12 to 0.87 for the beneficiary sample. This reveals that my beneficiary sample exhibits substantial cross-sectional differences in market competition to test H1b. The mean value of ICSH is 0.31, indicating that the percentage of shares owned by individual controlling shareholders is on average 31% in the beneficiary sample.
[Insert Table 3 here]
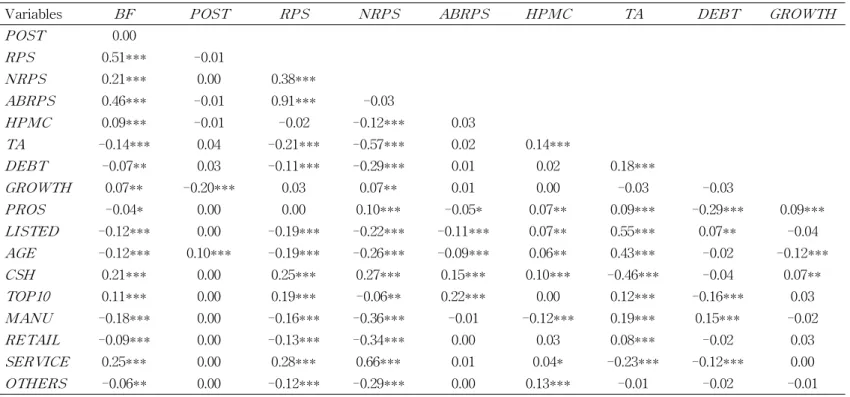
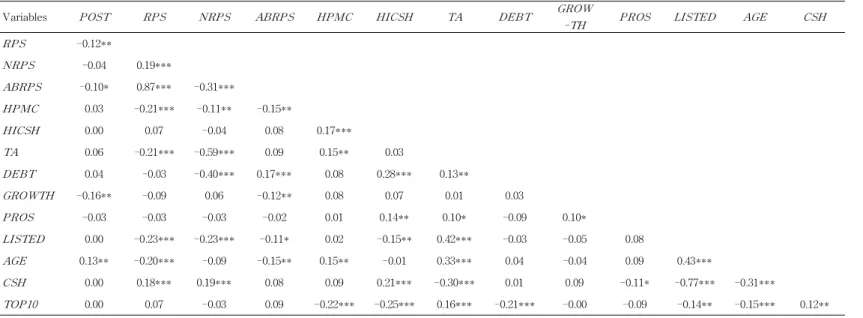
Table 4 reports the correlation matrix for the variables used to test my hypotheses. While Panels A and B show the Pearson correlation coefficients for the full sample (N=1,456), Panel C reports those for the beneficiary sample (N=304).14) In Panel A, the correlation between BF and RPS is positive and significant (p <
0.01), which seems to be natural, considering that beneficiary firms (BF) are defined based on whether or not the ratio of RPS to total sales exceeds 30% in the year of 2011. The positive correlations of BF with both NRPS and ABRPS (coefficient = 0.21 and 0.46; p <
0.01, both) indicate that beneficiary firms report high levels of normal and abnormal RPS compared with non-beneficiary firms. BF is negatively correlated with TA, DEBT, LISTED and AGE, indicating that beneficiary firms mostly consist of firms with smaller size, lower dependence on external financing both in the debt and equity market, and lower age compared with non-beneficiary firms. On the other hand, BF is positively correlated with Growth, CSH, TOP10 and Service. These indicate that beneficiary firms tend to have higher
14) In relation to the multicollinearity among the variables used to test my hypotheses, it does not seem to be problematic because the variance inflation factors for the regression estimations in all the main analyses are less than 2.42, which are reasonably low.
growth opportunity, higher controlling-shareholder ownership, affiliation with top10 business groups and industry membership of service.
In Panel C, the negative and statistically significant correlation between POST and RPS measures are only shown in RPS and ABRPS, non in NRPS. Although these correlations do not control for other factors that influence the decision of RPS transactions, these results suggest the possibility that beneficiary firms may reduce abnormal RPS rather than normal RPS after 2012.
[Insert Table 4 here]
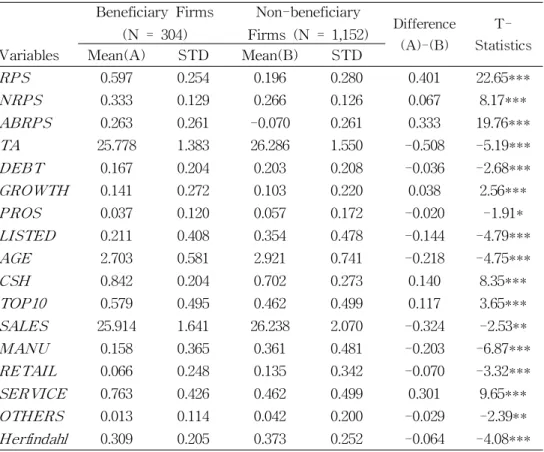
In Table 5, I divide the full sample into two groups, beneficiary and non-beneficiary firms, and report the results of the mean-difference tests for RPS measures and other variables between the two types of firms. The mean of RPS is significantly higher in beneficiary sample (0.597) than in non-beneficiary sample (0.196). In addition, the means of NRPS and ABRPS are also significantly higher in beneficiary sample (0.333 and 0.263) than in non-beneficiary sample (0.266 and -0.070). As expected, in my sample, firms with small size (SIZE), low dependency on external financing both in the debt (DEBT) and equity markets (LISTED), high asset growth (GROWTH), low firm age (AGE), and industry membership of service (SERVICE) are classified as beneficiary firms.
[Insert Table 5 here]
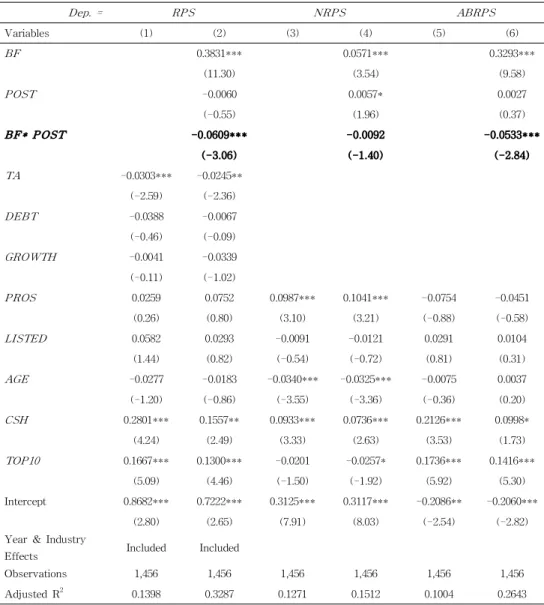
4.2. Main Results 4.2.1. Test of H1a
Table 6 presents the regression results of Eqs. (3-a) and (3-b), in which I examine whether beneficiary firms tend to reduce
normal or abnormal RPS transactions after the enforcement of gift taxes on RPS in 2012, compared with non-beneficiary firms. For the test, I run three sets of regressions, one each for RPS, NRPS, and ABRPS as dependent variables which are presented in Columns (1)-(2), Columns (3)-(4) and Columns (5)-(6), respectively. Whereas Columns (1), (3) and (5) are the regression results without my interest variables BF, POST and BF*POST, Columns (2), (4) and (6) show those with such variables.
First, when RPS is used as a dependent variable, in Column (2), the coefficient on BF is positive (coefficient = 0.3831) and significant (p<0.01), indicating that before 2012, beneficiary firms were more likely to engage in RPS transactions than non-beneficiary firms. The insignificant coefficient on POST indicates that the extent to which non-beneficiary firms engage in RPS transactions is not significantly changed before and after 2012. On the other hand, the coefficient on BF*POST is significantly negative (coeff.= -0.0609;
p<0.01), indicating that beneficiary firms are likely to reduce the ratio of RPS to total sales after 2012, compared with non-beneficiary firm s.15) I attribute these results to the enforcement of gift taxes on RPS in that year. Since RPS may incur tax costs to the individual controlling shareholders of beneficiary firms after 2012, such firms seem to make a decision to decrease the levels of such transactions.
This result is consistent with the finding of Lee et al. (2015), thereby confirming the evidence of RPS-reducing decision of beneficiary firms after 2012.
15) For the reference, the number of firms that reduce RPS transactions after 2012 is 148 (40.7%) of the full sample. These firms consist of 46 beneficiary firms and 102 non-beneficiary firms, which are 60.5% and 33.0% of the beneficiary and non-beneficiary sample, respectively. These statistics also suggest that beneficiary firms tend to reduce RPS transactions more after 2012 compared with non-beneficiary firms.
As for control variables, the coefficient on CSH is shown to be significantly positive as expected. In addition, the significantly positive coefficient on TOP10 supports the argument that their viable political connections allow those large business groups to engage in abnormal levels of RPS transactions. In relation to the economic significance of these results, the estimated coefficient on BF*POST, -0.0609 in Column (2) indicates that, on average, beneficiary firms exhibit a higher decrease in the ratio of RPS to total sales by 156%
after 2012, compared with non-beneficiary firms, when I set all other variables at their respective mean values.16) This finding suggests that the economic impact is substantial.
Turning to the next four columns, I find that the significance in the negative coefficient on BF*POST disappears when NRPS is used as a dependent variable in Column (4). On the other hand, in Column (6), when I use ABRPS as a dependent variable, the coefficient on BF*POST remains negative (-0.0533) and significant (p<0.01). These results indicate that beneficiary firms tend to reduce RPS transactions after 2012, compared with non-beneficiary firms, but not in its normal components, mostly in the abnormal parts, which is consistent with the prediction of my H1a. These suggest that although RPS may incur gift tax costs to the shareholders after 2012, beneficiary firms tend to retain the relevant normal transactions, because reducing normal RPS may incur high costs of losing business efficiencies that may outweigh the expected tax savings.
Instead, they seem to decide to decrease abnormal RPS with
16) When I set all variables to their respective mean values, the average magnitude of the ratio of RPS to total sales estimated from the coefficients reported in Column (2) is 0.2825 (0.2802) for beneficiary firms before (after) 2012, and 0.1964 (0.2005) for non-beneficiary firms before (after) 2012.
comparatively low opportunistic costs.
[Insert Table 6 here]
4.2.2. Test of H1b
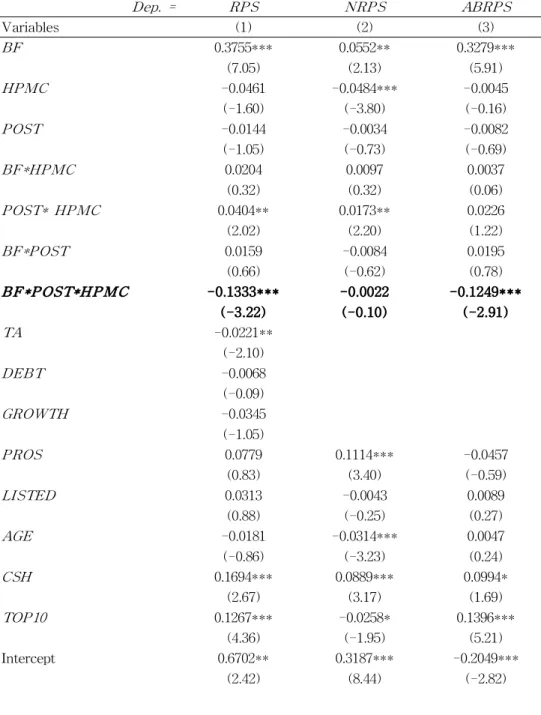
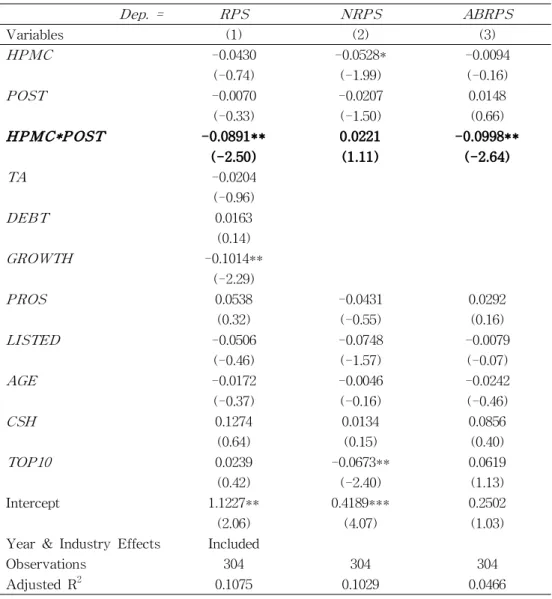
In Table 7, I examine whether a beneficiary firm's incentives to reduce RPS after 2012 depend on market competition. While Panel A shows the regression results for the full sample, Panel B presents those for the beneficiary sample. In each Panel, Columns (1)-(3) present the results for a dependent variable, RPS, NRPS and ABRPS, respectively.
In Panel A, Column (1) reveals that whereas the coefficient on BF*POST is insignificant, that on BF*POST*HPMC is negative and significant (p<0.05). These results indicate that after the enforcement of gift taxes on RPS, beneficiary firms in competitive markets are more likely to decrease their RPS transactions than those in non-competitive markets, consistent with H1b. For the reason, H1b suggests that the natural decision maker in relation to abnormal levels of RPS transactions within a business group, a buyer may have strong incentives to formulate internal market when it is in noncompetitive markets, presumably because of its lower bargaining power in those markets and the resulting needs for its own suppliers.
Consequently, such buyers are less likely to reduce those RPT, and the corresponding related-sellers possibly retain their RPS transactions. On the other hand, in competitive markets, where RPT are likely to be arranged for purposes other than enhancing efficiencies, a business group seems to reduce it with relatively low opportunistic costs. Furthermore, these results indirectly suggest that as a result of the reduced RPS in competitive markets, non-related suppliers in those markets can obtain additional channels to sell their
products or services, thereby implicating that the opportunities of sales transactions are shared between related and non-related suppliers.
In addition, I test whether these results are robust to the classification of normal and abnormal RPS, replacing the dependent variable RPS with NRPS in Column (2) and ABRPS in Column (3).
First, I find that the coefficient on HPMC is negatively significant only in the regression with NRPS as a dependent variable (Column (2)). This suggests that in a case that firms engage in RPS transactions in a normal business process, those in the competitive markets have weaker incentives to formulate internal markets from the transaction costs saving perspective, which strongly supports the argument of Aghion et al. (2006). On the other hand, firms that exploit RPS with tunneling incentives seem to engage in RPS transactions irrespective of market competition before the enforcement of gift taxes on RPS. Next, with regard to my interest variables, the results show that whereas the coefficient on BF*POST is insignificant in Columns (2) and (3), that on BF*POST*HPMC is negative and significant (p<0.05) only in Column (2). This strongly supports the evidence of Table 6 that normal RPS transactions are not sensitive to the enforcement of gift taxes on RPS. On the other hand, abnormal RPS transactions are likely to be influenced by the introduction of such gift taxes, especially when they are in competitive markets than in non-competitive markets.
Although I repeat these regressions only for the beneficiary sample, the results remain qualitatively similar. In Panel B, the coefficient on HPMC*POST is significantly negative only in the regression with RPS or ABRPS as a dependent variable, not in that with NRPS as a dependent variable. Taken together, these results
suggest that the RPS-reducing decision of beneficiary firms after 2012 is mostly driven by those in competitive market, especially for its abnormal components, thereby strongly supporting the argument of H1 that beneficiary firms with purposes other than enhancing business efficiencies are inclined to decrease RPS transactions after such transactions may incur tax costs to their individual controlling shareholders.
[Insert Table 7 here]
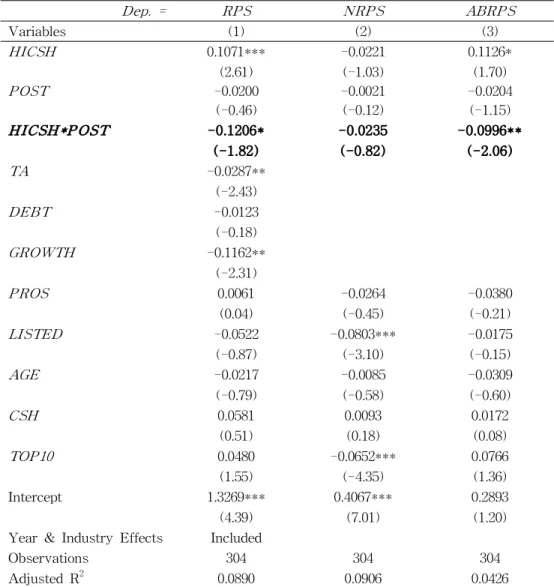
4.2.3. Test of H2
Table 8 presents the regression results to test H2, whether a beneficiary firm's RPS-reducing decision relies on managers' concerns over the shareholder-level tax costs. While Column (1) shows the results of estimating Eq. (5-a) using RPS as a dependent variable, Columns (2) and (3) report those of Eq. (5-b) using NRPS and ABRPS as a dependent variable, respectively.
In Column (1), when I use RPS as a dependent variable, I find that the coefficient on HICSH is positive (0.1071) and significant (p<0.10), indicating that before 2012, beneficiary firms with the above-median individual controlling-shareholder ownership are more likely to engage in RPS transactions than those with the below-median individual controlling-shareholder ownership. On the other hand, the former tends to reduce RPS transactions after 2012, relative to the latter, which is evidenced by the significantly negative coefficient on HICSH*POST (p<0.010). This result is consistent with H2, suggesting that beneficiary firms reduce RPS transactions driven by tax incentives, especially when the expected tax savings are higher.
Turning to the next two Columns, interestingly, I find that
the coefficient on HICSH is insignificant in the regression with NRPS as a dependent variable (Column (2)), but still positively significant (p<0.05) in the regression with ABRPS as a dependent variable (Column (3)). These results imply that RPS transactions of beneficiary firms with higher individual controlling-shareholder ownership are mostly driven by purposes other than normal business activities. In relation to the variable of interest, the negative coefficient on HICSH*POST disappears in the regression with NRPS as a dependent variable. By contrast, it remains significantly negative in the regression with ABRPS as a dependent variable (Column (3)).
To sum up, the results suggest that beneficiary firms tend to reduce abnormal RPS transactions after 2012, especially when they have higher individual controlling-shareholder ownership, thereby strongly supporting both H1 and H2.
[Insert Table 8 here]
4.3. Sensitivity tests and additional analyses 4.3.1. Alternative definitions of variables
I conduct several additional tests to verify the robustness of my findings according to alternative definitions of dependent and test variables. First, I alternatively define NRPS and ABRPS based on varied RPS models from Eq. (1) as follows: 1) I additionally include profitability (PROS), listing status (LISTED) and firm age (AGE) to the RPS prediction model as determining factors; 2) I use gross as well as industry-adjusted RPS as alternative dependent variables; 3) In relation to the industry classification, I replace 2-digit KSIC code with 1-digit code (Jian and Wong 2010). Although I rerun all my main analyses by using the aforementioned alternative measures of normal and abnormal RPS, the regression results remain qualitatively
similar, overall.
Second, as a proxy for market competition, I use rank transformation of one minus Herfindahl index in the main analyses.
As a robustness check, I generate alternative competition measures based on the number of firms in the industry (Chen et al. 2012). In the regression with a natural logarithm of that number as a competition variable, I find that the results remain qualitatively similar to those presented in Table 7.
Third, in relation to the classification of beneficiary and non-beneficiary sample, the tax law requires beneficiary firms to have positive after-tax operating income. In the main analyses, I assume that firms that have reported after-tax operating loss for the previous two consecutive years before 2012 will retain that negative performance after 2012, and exclude those firms in the beneficiary sample. As a sensitivity check, I reclassify them into beneficiary firms if they satisfy the other two requirements as beneficiary firms, and repeat all my main analyses. The results show that my findings are robust to the alternatively defined beneficiary/ non-beneficiary firms.
4.3.2. Sensitivity tests for RPS-reducing decision
Gift taxes on RPS are more intensified after 2013, with the downward adjustment of the threshold in ratio of RPS to total sales (e.g. from 30% to 15%). This indicates that abnormal levels of RPS transactions may incur higher gift tax costs to their individual controlling shareholders after 2013 than in 2012. Thus, I posit that beneficiary firms will have stronger incentives to reduce RPS transactions after 2013 than in 2012. In order to test these intensified incentives in 2013, I repeat my analyses for the two subsamples, each