DOI : 10.3341/jkos.2009.50.11.1680
= 증례보고 = 접수번호 : 50-11-03-10
험프리매트릭스 주파수배가시야검사법과 표준 자동시야검사법의 검사 지표에 대한 비교 분석
남윤표1⋅강성용1⋅박성배2⋅성경림1⋅국문석1
울산대학교 의과대학 서울아산병원 안과학교실1, 차의과대학 분당차병원2
목적: 매트릭스시야검사법과 표준 자동시야검사법의 global index를 비교하였다.
대상과 방법: 정상안 47, 녹내장안 63에 대해 mean deviation (MD)과 pattern standard deviation (PSD)의 상관관계, 녹내장과 정상안 을 감별하는 Areas under receiver operating characteristic curves (AUCs)값, 일정한 특이도에서 민감도 및 cut off값을 분석하였다.
결과: 녹내장안에서 두 시야검사의 MD와 PSD는 상관관계를 보였다(r=0.80, r=0.69). 매트릭스시야검사법의 MD, PSD의 AUC는(0.941, 0.921) 표준 자동 시야검사법과 (0.876, 0.923) 차이를 보이지 않았다(p=0.068, 0.927). 90%의 특이도에서 표준 자동시야검사와 매트 릭스시야검사의 MD의 민감도는 67.9%, 76.4%, cut off값은 -3.10dB과 -3.72dB였다.
결론: 두 시야 검사의 MD와 PSD는 상관관계를 보였고, 녹내장 진단력은 차이를 보이지 않았다. 그러나 유사한 특이도에서 cut off값은 차이를 보이므로 실제 임상에서 주의가 필요할 것이다.
<대한안과학회지 2009:50(11):1680-1685>
■ 접 수 일: 2009년 3월 6일 ■ 심사통과일: 2009년 7월 21일
■ 책 임 저 자: 성 경 림
서울시 송파구 풍납 2동 388-1 울산대학교 서울아산병원 안과 Tel: 02-3010-3680, Fax: 02-470-6440 E-mail: [email protected]
* 이 논문의 요지는 2008년 9월 5th Congress of South East Asia Glaucoma Interest Group에서 포스터로 발표되었음.
녹내장은 특징적인 시신경손상과 시야결손이 진행하는 질 환으로 정의되며 표준 자동시야검사(Standard automated perimetry)는 녹내장을 확진하는 가장 중요한 진단법으로 간주된다. 녹내장성 시신경손상 혹은 시야결손은 대부분 비 가역적이므로 조기 진단하는 것이 환자의 예후에 매우 중요 하다. Frequency doubling technology (FDT) 시야검사는 빛 대신에 되풀이되는 흑백의 줄무늬 표적을 이용한 시야 검사법으로써 비교적 녹내장 초기에 손상 받는 것으로 알 려진 My세포를 자극하는 것을 특징으로 한다.1-3이 My세 포들은 전체 망막신경절세포 중 적은 부분을(3~5%) 이루 고 있어 초기의 작은 손상에도 민감하게 반응하는 것으로 보고한 연구들이 있다.4,5여러 연구들에서 FDT 시야검사는 녹내장 선별 검사법으로 사용되었을 때 표준 자동시야검사 와 필적하는 혹은 더 우수한 진단력을 나타내는 것으로 보 고되었다.5-11
험프리매트릭스 주파수배가시야검사법(Humphrey Matrix frequency doubling technology perimetry, 이하 매트릭스 시야검사법)은 FDT 시야검사의 개선된 version으로써 기존
의 FDT 시야검사보다 작은 크기의, 많은 개수의 표적을 사 용하도록 되어 있다. 매트릭스시야검사법 24~2와 30~2는 표준 자동시야검사법 24~2, 30~2와 같은 수의 검사 위치를 설정하였으며 mean deviation (MD), pattern standard deviation (PSD), glaucoma hemifield test (GHT) classification 등 의 동일한 global index를 나타내어 준다. 매트릭스시야검 사법은 기존의 표준 자동시야검사법보다 검사 시 소요되는 시간이 짧고, 측정 오차도 적은 것으로 보고되고 있다.12-14 이러한 장점을 고려한다면 매트릭스시야검사법은 녹내장을 조기 진단할 수 있는 선별 검사법으로 사용될 수 있을 것이 다. 실제 임상에서 시야검사법의 global index는 자주 사용 되는 지표이므로 매트릭스시야검사법이 임상적으로 유용한 녹내장 선별 검사법이 되려면 global index에 대한 기준이 필요하다. 매트릭스시야검사법의 global index에 대한 몇몇 의 연구 결과들이 있으나 일치되는 견해는 없었다.15-23 새 로운 검사법의 임상적 유용성을 고찰하기 위해서는 기존의 표준 검사법과의 비교가 반드시 선행되어야 한다. 따라서, 매트릭스시야검사법의 global index의 임상적 유용성을 고찰 하기 위해서는 현재 많이 사용되고 있는 표준 자동시야검사 법의 global index와의 상관관계 및 비교가 필요하다고 사료 된다. 본 연구에서 저자들은 매트릭스시야검사법의 global index의 녹내장 진단력에 대해 고찰해 보고 그 결과를 표준 자동시야검사법과 비교, 분석해 보고자하였다.
(A)
Matrix MD (decibel)(B)
Matrix MD (decibel)SAP MD (decibel) SAP MD (decibel)
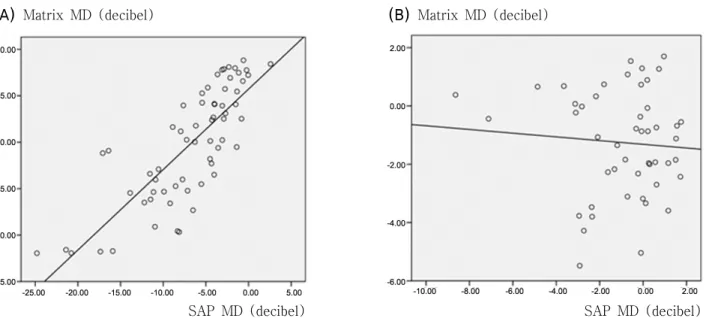
Figure 1.Correlation of mean deviation (MD) between standard automated perimetry (SAP) and Humphrey Matrix (Matrix).
(A) In glaucomatous eyes, MD of SAP and Matrix showed strong correlation (r=0.80, p<0.001). (B) In healthy eyes, MD of SAP and Matrix did not show statistically significant correlation (r=0.077, p=0.607) by Pearson correlation analysis.
대상과 방법
이 연구는 2007년 1월에서 2008년 3월까지 본원 안과 외래를 방문하여 녹내장 혹은 정상안으로 진단받은 환자들 중 본 연구의 기준에 합당한 경우 연속적으로 선택된 환자 들을 대상으로 시행한 연구이다. 모든 환자들은 시행되는 검사에 대하여 설명을 들었고 동의하였으며 모든 검사 과정 과 분석은 Declaration of Helsinki에 의거하여 실행되었다.
모든 환자들은 전안부 세극등검사 및 안저검사, Goldmann 압평 안압계를 이용한 안압 측정, 초음파를 이용한 중심 각막 두께 측정(Pachette2®pachymetry; DGH Technology Inc.;
Exton, PA, USA), 표준 자동시야검사법(Humphrey Field Analyzer 24~2 SITA standard, Carl Zeiss Meditec Inc, Dublin, CA, USA)과 매트릭스시야검사법(Humphrey Matrix frequency doubling technology perimetry 24~2 Carl Zeiss Meditec Inc. Dublin, CA, Welch Allen, Skaneateles Falls, NY, USA)에 의한 시야검사를 시행하였다. 최대 교정시력 이 20/30 이상인 경우, 구면렌즈 대응치 값이 ±6D 이내, 난 시가 ±3D 이내이며, 전안부검사 및 전방각경검사에서 정 상 소견을 보이는 경우로 하였다. 두 가지 시야검사법 모두 신뢰도 지표상 주시 상실이 20% 미만, 가음성과 가양성 반 응이 15% 미만인 경우에만 분석에 포함되었다. 녹내장 이 외에 시야에 영향을 줄 수 있는 다른 안과적, 신경학적 이 상이 있는 경우는 제외하였다. 양안 모두 연구 기준에 부합 할 경우 단안이 무작위로 선택되었다. 정상안은 정상적인 시신경유두소견과 정상적인 시야검사 소견을 보이면서 안
압이 22 mmHg 이하인 경우로 정의하였다. 녹내장은 녹내 장성 시신경 유두변화 즉, 0.6 이상 증가된 시신경유두함몰, 양안 간에 0.2 이상의 시신경 유두 함몰비의 차이, 시신경 유두의 국소결손, 시신경 유두 출혈, 시신경 섬유결손 등의 녹내장성 시신경손상소견 중 하나 이상의 기준을 만족하면서 녹내장성 시야장애가 신뢰할 만한 시야검사에서 2회 이상 확인된 경우 녹내장으로 진단하였다. 녹내장성 시야손상은 Glaucoma hemifield test (GHT)에서 outside normal limit 소견을 보이면서 pattern standard deviation (PSD)가 정상 의 5% 이하로 관찰되는 경우로 정의하였다. 이상의 조건을 만족하는 63안의 녹내장안과 47안의 정상안이 분석에 포 함되었다.
녹내장안에서 표준 자동시야검사법과 매트릭스시야검사법 에서 얻은 각각의 MD와 PSD의 상관 관계를 Pearson corre- lation 분석법으로 알아보고 r 상관계수와 p 값을 산출하였 다. MD와 PSD의 녹내장과 정상안을 감별하는 receiver operating characteristics (ROC) 그래프를 그리고 그 면적 (area under the receiver operating characteristics curve, AUC)을 계산하였다. DeLong의 방법으로 AUC의 통계적인 차이를 조사하였다.24두 가지 시야검사법의 MD, PSD의 민 감도 및 cut off값을 비교하기 위해, ROC 그래프를 이용하여 80%와 90% 특이도에서 MD, PSD의 cut off값을 계산해보 았다. SPSS version 15.0 (SPSS Inc., Chicago, IL, USA)과 MedCalc version 9.6 (Mariakerke, Belgium)이 통계분석 에 사용되었다.
(A)
Matrix PSD (decibel)(B)
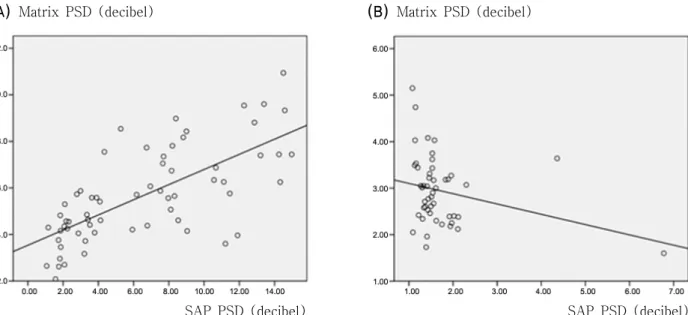
Matrix PSD (decibel)SAP PSD (decibel) SAP PSD (decibel) Figure 2. Correlation of pattern standard deviation (PSD) between standard automated perimetry (SAP) and Humphrey Matrix (Matrix). (A) In glaucomatous eyes, PSD of SAP and Matrix showed strong correlation (r=0.69, p<0.001) (B) In healthy eyes, PSD of SAP and Matrix did not show statistically significant correlation (r=0.074, p=0.272) by Pearson correlation analysis.
Table 1.Sensitivity and cutoff value at 80% and 90% specificity of standard automated perimetry (SAP), Humphrey Matrix (Matrix) mean deviation (MD), and pattern standard deviation (PSD) for discriminating between healthy and glaucomatous eyes
Global index
Sensitivity at 80%
specificity(%)
Cut off value at 80%
specificity(decibel)
Sensitivity at 90%
specificity(%)
Cut off value at 90%
specificity(decibel)
SAP MD 76.9 -2.73 67.9 -3.10
PSD 85.2 1.89 77.3 2.09
Matrix MD 81.3 -3.12 76.4 -3.72
PSD 89.4 3.45 81.3 3.91
결 과
총 63명의 녹내장 환자 중 35명은 남자, 28명은 여자였고 정상인 47명 중 27명은 남자, 20명은 여자였다. 정상인의 연령은 평균 53.6±10.5세, 녹내장 환자의 평균 연령은 56.1
±9.4세로 통계적으로 유의한 차이를 보이지 않았다(p=0.590).
정상안에서 표준 자동시야검사법으로 측정한 평균 MD와 PSD는 -0.95±2.17dB, 1.70±0.89dB, 매트릭스시야검사법 으로 측정한 평균 MD와 PSD는 -1.26±1.79dB, 2.95±0.73dB 였고 녹내장안에서는 표준 자동시야검사법으로 측정한 평 균 MD와 PSD는, -6.83±5.70dB, 6.56±4.25dB, 매트릭스 시야검사법으로 측정한 평균 MD와 PSD는 -10.2±6.16dB, 5.67±1.99dB였다.
표준 자동시야검사법과 매트릭스시야검사법으로 측정한 MD와 PSD는 녹내장안에서 강한 상관관계를 보였으나 (MD;
r=0.80, p<0.001, PSD; r=0.69, p<0.001) 정상안에서는 유 의한 상관관계를 보이지 않았다(MD; r=0.077, p=0.607,
PSD; r=0.272. p=0.074, Fig. 1, 2). 정상안과 녹내장안을 감별하는 AUC를 측정했을 때 표준 자동시야검사법의 MD는 0.876(신뢰구간 0.800~0.931), PSD는 0.923(신뢰구간 0.857
~0.965)였고, 매트릭스시야검사법의 MD는 0.941(신뢰구 간 0.880~0.977), PSD는 0.921(신뢰구간 0.854~0.963) 였다. 표준 자동시야검사법과 매트릭스시야검사법의 MD에 대한 AUC값은 통계적으로 유의한 차이를 보이지 않았고, PSD도 동일한 소견을 보였다(p=0.068, 0.927, Fig. 3A, B).
90%의 특이도에서 표준 자동시야검사법으로 측정한 MD 의 민감도와 cut off 값은 67.9%, -3.10dB, PSD는 77.3%.
2.09dB였고, 매트릭스시야검사법으로 측정한 MD의 민감도 와 cut off 값은 76.4%, -3.72dB, PSD는 각각 81.3%, 3.91 dB였다. 90%와 80%의 특이도를 보일 때 두 시야검사법의 MD, PSD에 대한 민감도와 cut off 값은 Table 1에 기술되어 있다. 대체적으로, 두 가지 시야검사법 모두, PSD는 MD보 다 동일한 특이도에서 민감도가 높았고, cut off 값은 매트 릭스시야검사법에서 표준 자동시야검사법보다 MD는 낮고
(A) (B)
Figure 3.The receiver operating characteristics curves (ROC) for discriminating between healthy and glaucomatous eyes. (A) Area under ROC value of mean deviation for Humphrey Matrix (Matrix, 0.941) and standard automated perimetry (SAP, 0.876) were not significantly different (p=0.068). (B) Area under ROC value of pattern standard deviation for Humphrey Matrix (Matrix, 0.921) and standard automated perimetry (SAP, 0.923) were not significantly different (p=0.927).
PSD는 높은 경향을 보였다.
고 찰
본 연구 결과에 의하면 매트릭스시야검사법의 MD와 PSD 는 표준 자동시야검사법으로 측정한 MD, PSD와 강한 상관 관계를 보이며 이는 이전의 연구 결과들과 유사하다.12,13,22 Artes et al12과 Clement et al22은 녹내장안에서 매트릭스 시야검사법으로 측정했을 때 MD와 PSD 값은 강한 상관관 계를 보인다고 하였고 Leeprechanon et al13은 FDT시야검 사를 시행했을 때 녹내장안에서는 MD와 PSD가 상관관계 를 보이나 정상안에서는 그렇지 않다고 보고하였다. 따라서 녹내장안에서 두 가지 시야검사법의 MD와 PSD가 강한 상 관관계를 보이고 정상안에서는 상관관계를 보이지 않는다 는 본 연구의 관찰 소견은 기존의 연구 결과와 부합함을 알 수 있었다.
본 연구의 분석 결과, MD와 PSD를 연속 변수로 보았을 때 매트릭스시야검사법으로 측정한 AUC 값은 표준 자동시야 검사법으로 측정한 것과 통계적으로 유의한 차이를 보이지 않았다. 매트릭스시야검사법의 MD와 PSD가(0.921~0.941) 표준 자동시야검사법의 MD와 PSD 보다(0.876~0.923) 다 소 높은 AUC 값을 나타내었으나 통계적으로 유의한 차이를 보이지 않았다. 따라서, 두 가지 시야검사법의 MD, PSD는
녹내장과 정상안을 감별하는데 좋은 능력을 가지고 있음을 알 수 있었다. 표준 자동시야검사법과 비교하여 녹내장 진 단력에 있어서 큰 차이가 없음을 고려하면 매트릭스시야검 사법의 MD와 PSD는 적절한 cut off 값이 주어진다면 녹내 장 선별검사에 사용될 수 있을 것이다. 대체로, 두 가지 시 야검사법 모두 같은 특이도에서(80% 혹은 90%) PSD는 MD보다 높은 민감도를 나타내었다. 같은 특이도에서 측정 했을 때 매트릭스시야검사법의 MD는 표준 자동시야검사로 측정한 것보다 cut off 값이 낮았고 PSD는 더 높은 경향을 보였다. 예를 들면 80%의 특이도에서 표준 자동시야검사 법으로 측정한 MD 값은 -2.73dB이었으나 매트릭스시야검 사법으로 측정한 값은 -3.12dB였고, PSD는 표준 자동시야 검사법에서 1.89dB, 매트릭스시야검사법에서 3.45dB였다.
표준 자동시야검사법에서 측정한 MD, PSD가 동일한 특이 도에서 매트릭스시야검사법과 상이한 cut off 값을 가진다 는 결과는 실제 임상에서 고려되어야 할 것이다. 몇몇의 연 구에서 매트릭스시야검사법의 global index의 진단력에 대 해 보고하였는데 그 결과는 차이를 보이고 있다.14,15,22 이 원인 중 하나는 연구에 참가한 대상들이 다르기 때문일 것 이다. 이는 녹내장을 진단하는 방법의 차이에 기인하는 것 인데 Clement et al22은 표준 자동시야검사법으로 녹내장을 진단하고 매트릭스시야검사법의 MD와 PSD의 AUC 값을 0.91과 0.94로 비교적 진단력이 우수한 것으로 보고하였고
Racette et al14은 녹내장성 시신경유두를 가진 경우 녹내장 이라고 정의하고 매트릭스시야검사법의 MD, PSD 측정치 의 AUC 값을 0.763와 0.755로 다소 낮은 값을 보고하였다.
Burgansky-Eliash et al15은 시신경 촬영과 빛간섭 단층촬영 으로 측정한 망막 신경섬유 두께로 녹내장을 정의하였고 매트 릭스시야검사법의 MD, PSD 측정치의 AUC 값을 0.690~0.827 로 보고하였다. Racette et al과 Burgansky et al이 본 연구 결과 혹은 Clement et al의 결과 보다 낮은 AUC값을 보고 한 것은 시신경 유두 소견 혹은 빛간섭 단층촬영 결과 등 구조적인 검사법만으로 녹내장을 진단하였기 때문에 녹내장 의증군 혹은 preperimetric glaucoma 군이 상당히 포함된 것이 원인이 되었을 것으로 사료된다.
결론적으로, 자동 시야검사법과 매트릭스시야검사법의 MD 와 PSD는 녹내장안에서 유의한 상관관계를 보이고, 녹내장 을 진단하는 능력은 유사함을 본 연구를 통해서 알 수 있었 다. 그러나 녹내장 진단 기준이 되는 MD, PSD의 cut off 값 자체는 차이를 보이므로 실제 임상에서 사용할 때에 유의 할 필요가 있을 것으로 사료된다.
참고문헌
1) Quigley HA, Dunkelberger GR, Green WR. Chronic human glau- coma causing selectively greater loss of large optic nerve fibers.
Ophthalmology 1988;95:357-63.
2) Brusini P, Busatto P. Frequency doubling perimetry in glaucoma early diagnosis. Acta Ophthalmol Scand Suppl 1998;23-4.
3) Cello KE, Nelson-Quigg JM, Johnson CA. Frequency doubling technology perimetry for detection of glaucomatous visual field loss. Am J Ophthalmol 2000;129:314-22.
4) Burnstein Y, Ellish NJ, Magbalon M, Higginbotham EJ. Com- parison of frequency doubling perimetry with humphrey visual field analysis in a glaucoma practice. Am J Ophthalmol 2000;129:
328-33.
5) Johnson CA, Samuels SJ. Screening for glaucomatous visual field loss with frequency-doubling perimetry. Invest Ophthalmol Vis Sci 1997;38:413-25.
6) Quigley HA. Identification of glaucoma-related visual field abnor- mality with the screening protocol of frequency doubling tech- nology. Am J Ophthalmol 1998;125:819-29.
7) Sponsel WE, Arango S, Trigo Y, Mensah J. Clinical classification of glaucomatous visual field loss by frequency doubling perimetry.
Am J Ophthalmol 1998;125:830-6.
8) Delgado MF, Nguyen NT, Cox TA, et al. Automated perimetry:
a report by the American Academy of Ophthalmology. Ophthal- mology 2002;109:2362-74.
9) Sample PA, Bosworth CF, Blumenthal EZ, et al. Visual function- specific perimetry for indirect comparison of different ganglion
cell populations in glaucoma. Invest Ophthalmol Vis Sci 2000;41:
1783-90.
10) Bowd C, Zangwill LM, Berry CC, et al. Detecting early glaucoma by assessment of retinal nerve fiber layer thickness and visual func- tion. Invest Ophthalmol Vis Sci 2001;42:1993-2003.
11) Paczka JA, Friedman DS, Quigley HA, et al. Diagnostic capabilities of frequency-doubling technology, scanning laser polarimetry, and nerve fiber layer photographs to distinguish glaucomatous damage.
Am J Ophthalmol 2001;131:188-97.
12) Artes PH, Hutchison DM, Nicolela MT, et al. Threshold and variability properties of matrix frequency-doubling technology and standard automated perimetry in glaucoma. Invest Ophthalmol Vis Sci 2005;46:2451-7.
13) Leeprechanon N, Giangiacomo A, Fontana H, et al. Frequency- doubling perimetry: comparison with standard automated perimetry to detect glaucoma. Am J Ophthalmol 2007;143:263-71.
14) Racette L, Medeiros FA, Zangwill LM, et al. Diagnostic accuracy of the Matrix 24-2 and original N-30 frequency-doubling techno- logy tests compared with standard automated perimetry. Invest Ophthalmol Vis Sci 2008;49:954-60.
15) Burgansky-Eliash Z, Wollstein G, Patel A, et al. Glaucoma detection with matrix and standard achromatic perimetry. Br J Ophthalmol 2007;91:933-8.
16) Patel A, Wollstein G, Ishikawa H, Schuman JS. Comparison of visual field defects using matrix perimetry and standard achromatic peri- metry. Ophthalmology 2007;114:480-7.
17) Spry PG, Hussin HM, Sparrow JM. Clinical evaluation of frequency doubling technology perimetry using the Humphrey Matrix 24-2 threshold strategy. Br J Ophthalmol 2005;89:1031-5.
18) Brusini P, Salvetat ML, Zeppieri M, Parisi L. Frequency doubling technology perimetry with the Humphrey Matrix 30-2 test. J Glau- coma 2006;15:77-83.
19) Mastropasqua L, Brusini P, Carpineto P, et al. Humphrey matrix frequency doubling technology perimetry and optical coherence tomography measurement of the retinal nerve fiber layer thickness in both normal and ocular hypertensive subjects. J Glaucoma 2006;
15:328-35.
20) Hong S, Ahn H, Ha SJ, et al. Early glaucoma detection using the Humphrey Matrix Perimeter, GDx VCC, Stratus OCT, and retinal nerve fiber layer photography. Ophthalmology 2007;114:210-5.
21) Bozkurt B, Yilmaz PT, Irkec M. Relationship between Humphrey 30-2 SITA Standard Test, Matrix 30-2 threshold test, and Heidelberg retina tomograph in ocular hypertensive and glaucoma patients. J Glaucoma 2008;17:203-10.
22) Clement CI, Goldberg I, Healey PR, Graham S. Humphrey matrix frequency doubling perimetry for detection of visual field defects in open-angle glaucoma. Br J Ophthalmol 2009;93:582-8.
23) Cheon HC, Jeung WJ, Rho SH. The comparison of the matrix perimetry and humphrey standard perimetry in various patients group. J Korean Ophthalmol Soc 2007;48:678-65.
24) DeLong ER, DeLong DM, Clarke-Pearson DL. Comparing the areas under two or more correlated receiver operating characteristic curves:
a nonparametric approach. Biometrics 1988;44:837-45.
=ABSTRACT=
Performance of Humphrey Matrix Frequency Doubling Technology Perimetry and Standard Automated Perimetry Global Indices
Yoonpyo Nam, MD1, Sung Yong Kang, MD1, Seong Bae Park, MD2, Kyung Rim Sung, MD, PhD1, Michael S. Kook, MD1
Department of Ophthalmology, University of Ulsan, College of Medicine, Asan Medical Center, Seoul, Korea
Purpose: To evaluate and compare the diagnostic performance of Humphrey Matrix frequency doubling technology perimetry (Matrix) global indices with standard automated perimetry (SAP) for glaucoma discrimination.
Methods: Forty-seven healthy and 63 glaucomatous subjects were included in this study. Glaucoma was defined as having glaucomatous optic disc and glaucomatous visual field defect. Correlations of mean deviation (MD) and pattern standard deviation (PSD) between Matrix and SAP were evaluated. Areas under receiver operating characteristic curves (AUCs) for discriminating healthy from glaucoma, sensitivity, and cut-off value at fixed specificity of MD and PSD were determined in Matrix and SAP.
Results: MD and PSD from Matrix were highly correlated with SAP data in glaucomatous eyes (r =0.80, 0.69 p<0.001, <0.001).
The AUCs of MD and PSD from Matrix (0.941, 0.921) were of comparable diagnostic capability to SAP data (0.876, 0.923, p=0.068, 0.927). The sensitivity at 90% specificity of MD was 67.9% in SAP, 76.4% in Matrix, with the cut off value of MD at 90% specificity at -3.10dB in SAP and -3.72dB in Matrix.
Conclusions: MD and PSD data from Matrix and SAP significantly correlated in glaucomatous eyes and showed similar diagnostic performance for discriminating healthy from glaucoma however, both MD and PSD are scaled differently on SAP and Matrix, which suggests that application of these parameters in a manner similar to that used in SAP should be employed with caution.
J Korean Ophthalmol Soc 2009;50(11):1680-1685 Key Words: Glaucoma, Global index, Visual field
Address reprint requests to Kyung Rim Sung, MD
Department of Ophthalmology, University of Ulsan, College of Medicine, Asan Medical Center
#388-1 Pungnap 2-dong, Songpa-gu, Seoul 138-736, Korea Tel: 82-2-3010-3680. Fax: 82-2-470-6440, E-mail: [email protected]