pISSN: 0378-6471 eISSN: 2092-9374
DOI : 10.3341/jkos.2010.51.3.372
= 증례보고 =
당뇨황반부종에서 시간과 스펙트럼 도메인 빛간섭단층촬영으로 측정한 황반두께의 반복성과 일치도
오세범⋅문준웅⋅김형찬 건국대학교 의학전문대학원 안과학교실
목적: 당뇨황반부종 환자에서 time domain (TD) OCT와 spectral domain (SD) OCT로 황반두께와 총황반부피를 측정해 반복성과 일치 도를 비교해 보고자 하였다.
대상과 방법: 당뇨황반부종 42명, 42안을 대상으로 TD OCT와 SD OCT로 3회 연속 황반두께와 총황반부피를 측정하여 비교하였다.
개체내 표준편차, 변동계수, 급내상관계수로 반복성을, Bland Altman plot으로 일치도를 평가하였다. 또한 Pearson 상관계수를 통해 두 OCT 사이의 상관관계를 알아보았다.
결과: TD OCT와 SD OCT로 측정한 중심와두께, 총황반부피의 개체내 표준편차는 각각 29.67 μm/16.44 μm, 1.26 mm3/0.23 mm3로 SD OCT에서 유의하게 낮았다. 변동계수와 급내상관계수는 TD OCT에서 각각 2.92%, 0.92이었고, SD OCT에서 각각 1.39%, 0.95이었 다. 중심와두께와 총황반부피의 95% 일치도 범위는 각각 88.9 μm, 2.4 mm3이었다. 두 OCT 사이의 모든 황반두께와 총황반부피는 통계적으로 유의한 상관관계를 보였다(p=0.88-0.99).
결론: 당뇨황반부종에서 두 OCT로 측정한 황반두께 및 황반부피는 높은 신뢰성을 보이나 SD OCT에서 더 높은 반복성을 보였다. 두 OCT로 측정한 황반두께 및 황반부피는 낮은 일치도를 보여 상호 교환적이지 않았으나 두 OCT간 유의한 상관관계를 보였다.
<대한안과학회지 2010;51(3):372-378>
■ 접 수 일: 2009년 5월 15일 ■ 심사통과일: 2009년 12월 2일
■ 책 임 저 자: 김 형 찬
서울특별시 광진구 화양동 4-12번지 건국대학교병원 안과
Tel: 02-2030-5270, Fax: 02-2030-5273 E-mail: [email protected]
* 본 논문의 요지는 2009년 대한안과학회 제101회 춘계학술대회에서 구연으로 발표되었음.
황반질환에서 정확하고 신뢰성 있는 황반두께 측정은 진 단, 시력예후, 치료시기 판정, 치료효과 평가에 매우 중요하 다. 황반두께를 측정하는 방법으로 세극등현미경을 이용한 안저검사, 형광안저혈관조영술, 빛간섭단층촬영(optical co- herence tomography, OCT) 등이 있으며, 그 중에서 OCT 는 민감도가 매우 높고 해상력이 높아 망막의 여러 층을 정 확히 알 수 있고 정량적인 측정이 가능하여 황반질환 진단 에 가장 널리 쓰이고 있다.1-5
반복성이란 한 사람이 같은 측정 장비를 이용하여 동일 한 대상을 여러 번 측정했을 때 얼마나 같은 결과를 보일 수 있는지를 알 수 있는 지표로서, 임상에 있어 어떤 측정 장비의 반복성은 그 결과에 대한 해석에 많은 영향을 미칠 수 있다. 지금까지 널리 쓰이고 있는 time domain (TD) OCT의 정상안에 대한 반복성 연구에서 Gurses-Ozden et al은 황반두께의 변동계수가 4.7~6.4%이었고,6 Paunescu
et al은 전체 및 구역별 황반두께의 급내상관계수가 0.55~
0.97로 각각 높은 반복성을 보인다고 하였다.7 정상안 뿐 아니라 당뇨황반부종안에 대한 반복성 연구에서도 황반두 께 측정치는 0.80 이상의 급내상관계수를 보인다는 보고가 있다.8
최근 개발된 spectral domain (SD) OCT는 TD OCT에 비해 50~100배로 스캔속도가 빨라졌고, 높은 해상도를 보 여 망막 내 구조를 더 자세하게 보여줄 수 있다.9,10
저자들은 정상안을 대상으로 한 TD OCT와 SD OCT의 반복성 및 일치도 연구에서 SD OCT에서 TD OCT에 비해 유의하게 더 높은 반복성을 보였고, 두 OCT는 낮은 일치도 를 보여 두 OCT간 상호 교환적이지 않았다는 결과를 보고 하였고, 이러한 결과는 이전의 다른 연구 결과와 같았다.11,12
본 연구의 목적은 당뇨황반부종에서 TD OCT와 SD OCT로 측정한 황반두께와 총황반부피를 비교하여 이들의 반복성(repeatability)과 일치도(agreement)를 알아보고자 하는데 있다.
대상과 방법
2009년 1월부터 2009년 4월까지 본원 안과에서 안저검 사상 유의한 당뇨황반부종으로 진단받고, TD OCT상 중심
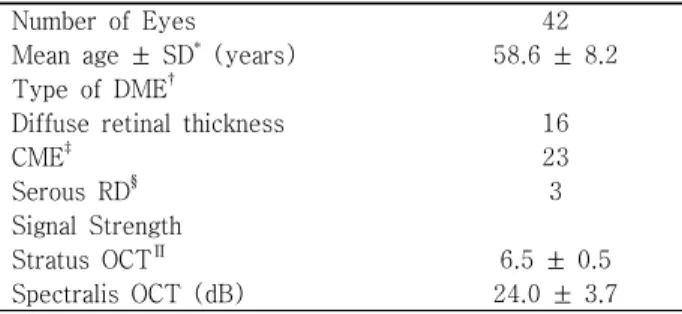
Table 1. Baseline characteristics
Number of Eyes 42
Mean age ±SD* (years) 58.6 ± 8.2 Type of DME†
Diffuse retinal thickness 16
CME‡ 23
Serous RD§ 3
Signal Strength
Stratus OCT∏ 6.5 ± 0.5
Spectralis OCT (dB) 24.0 ± 3.7
*SD=standard deviation; †DME=diabetic macular edema; ‡CME=
cystoid macular edema; §RD=retinal detachment; ∏OCT=
optic coherence tomography.
황반두께가 250 μm 이상이고, 이미지 질 값(image quality score)이 TD OCT에서는 6 이상, SD OCT에서는 16 dB이 상이고, 안구내 다른 질환이 없는 경우를 대상으로 하였다.
망막정맥폐쇄, 망막전막, 유리체황반견인 등의 황반두께 를 증가시킬 수 있는 질환이 있는 경우, 각막혼탁과 백내장 등의 유의한 매체혼탁이 있는 경우, 그리고 이전에 안구내 수술을 받은 경우는 대상에서 제외하였다.
황반두께는 양안이 대상안인 경우 무작위로 한쪽 눈을 선택해 산동 상태에서 단일 검사자에 의해 3회 연속적으로 TD OCT 및 SD OCT를 이용하여 측정하였다. 그리고 두 OCT의 측정 시 피검자에게 검사기구에 대한 설명 없이 하 는 단순 맹검법으로 연구를 진행하였다. TD OCT는 Stratus OCT (Carl Zeiss Meditec, Dublin, CA, USA)를 사용하였 다. 황반두께는 중심와를 지나는 6개의 6 mm 길이의 선형 스캔이 30° 간격으로 방사상 주사를 하는 fast macular map 을 이용하였으며, 황반두께지도(macular thickness map)로 분석하였다. 황반두께지도는 중심와를 중심으로 직경 1 mm 이내의 중심원과 3 mm의 안쪽 원, 그리고 6 mm의 바 깥쪽 원으로 구성되며, 안쪽 원과 바깥쪽 원은 상측, 비측, 하측, 이측의 4분역으로 나누어 모두 9개의 구역이 된다.
측정된 값은 retinal thickness analysis system을 통해 분 석하였다. SD OCT는 Spectralis OCT (Heidelberg Engi- neering, Dossenheim, Germany)를 사용하였다. 황반두께 측정은 래스터 주사(raster scan) 방식으로 황반을 중심으 로 수평, 수직이 각각 768 pixel×496 pixel scan 방식으로 이루어졌다. Spectralis OCT는 Stratus OCT에서와 같이 직경 1, 3, 6 mm의 동심원을 9개 분역으로 나누어 분석하 였다.
통계적 분석은 SPSS version 15.0 (SPSS Inc, Chicago, III) 을 사용하였다. 두 OCT의 측정치는 반복성(repeatability) 을 평가하기 위해 개체내 표준편차[2.77×within subject standard deviation (Sw)], 변동계수(coefficient of varia- tion, CVw) [100×Sw / overall mean], 급내상관계수(in- traclass correlation coefficient, ICC)를 계산하여 비교하 였다. 일치도를 평가하기 위해 Bland and Altman plots을 이용하였다.13 그리고 Pearson 상관계수를 통해 두 OCT 사이의 상관관계에 대해서도 알아보았다.
자료 값과 평균 차이 값의 제곱의 합을 도수의 합으로 나 눈 것이 분산이며, 이것의 제곱근이 표준편차이다. 표준편 차는 절대치 크기로 표현되기 때문에 데이터의 단위가 서 로 다른 값들의 산포도를 비교할 수 없으며 또한 평균이 다 르면 산포도의 정도를 비교하기 곤란한 경우가 있다. 이러 한 경우 단위에 영향을 받지 않는 변동계수, 즉, 표준편차를 평균으로 나눈 값을 사용함으로써 산포도, 즉 데이터의 퍼
짐 정도를 알 수 있다. 변동계수는 값이 작을수록 산포가 크지 않고 특성의 차이가 없는 균일한 것을 의미하게 된다.
급내상관계수(ICC)는 개체간 분산(inter-subject var- iance)을 개체간 분산에 개체내 분산(within subject var- iance)을 더한 총분산(total variance)으로 나눈 값으로서, 반복적인 측정의 일치 정도를 설명하는 값으로 1 에 가까울 수록 높은 반복성을 나타낸다. 두 OCT에 의해 측정된 황반 두께와 총황반부피의 개체내 분산은 log화 된 데이터로 전 환한 후 paired t-test로 비교하였다.14모든 통계적인 유의 성은 p<0.05 미만으로 하였다.
결 과
대상안은 42명, 42안으로 평균 연령은 58.6±8.2세였고, OCT상 당뇨황반부종의 종류는 미만성 망막부종(diffuse retinal thickness)이 16안, 낭포황반부종이 23안, 장액망 막박리가 3안 이었고, 후유리체견인과 견인망막박리 형태 는 보이지 않았다. TD OCT의 signal strength에 해당하는 평균 이미지 질 값(image quality score)은 6.5±0.5이었고, SD OCT는 24.0±3.7dB이었다(Table 1).
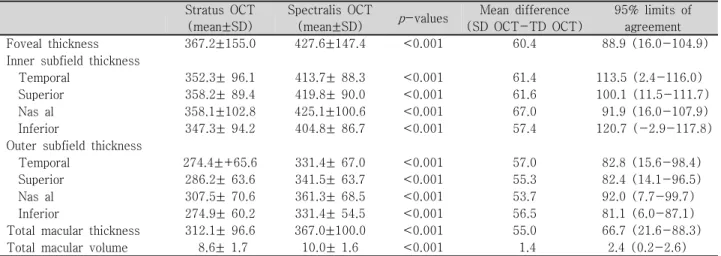
TD과 SD OCT에 의해 측정된 평균값은 중심와두께 (foveal thickness)에서 각각 367.2±155.0 μm와 427.6±
147.4 μm이었고, 총황반두께(total macular thickness)에 서 각각 312.1±96.6 μm와 367.3±100.0 μm, 총황반부피 (total macular volume)에서 각각 8.6±1.7 mm3와 10.0±
1.6 mm3이었으며, SD OCT로 측정한 전체 및 구역별 황반 두께와 총황반부피는 TD OCT로 측정한 것보다 통계적으 로 유의하게 높은 값을 보였다(Table 2).
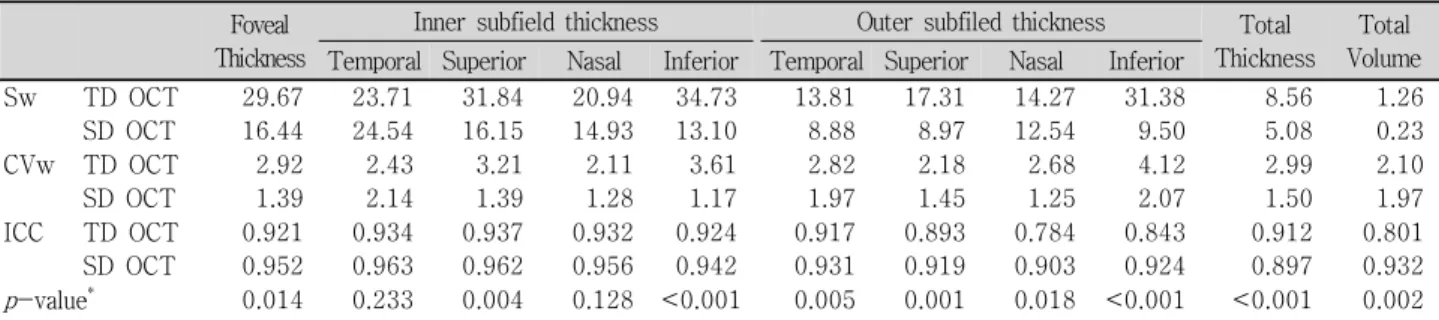
TD OCT와 SD OCT로 측정한 중심와두께, 총황반두께, 총황반부피의 개체내 표준편차는 각각 29.67 μm/16.44 μm, 8.56 μm/5.08 μm, 1.26 mm3/0.23 mm3로 SD OCT에서 높 은 반복성을 보였다. 그리고 변동계수는 각각 2.92%/1.39%, 2.99%/1.50%, 2.10%/1.97%이고, 급내상관계수는 각각
+1.96 SD 104.9
-1.96 SD 16.0
Average of Spectralis OCT and Stratus OCT
200 400 600 800 1000
200
80
60
40
20
0
Mean 55.0
+1.96 SD 88.3
-1.96 SD 21.6 Mean 55.0
Average of Spectralis OCT and Stratus OCT
200 300 400 500 600
80
60
40
20
0
Figure 1.Bland-Altman plots of foveal thickness me- asurements obtained by Stratus OCT and Spectralis OCT. Solid line indicates the average mean difference, while dotted lines delineates the 95% confidence limits of agreement.
Figure 2.Bland-Altman plots of total macular thickness obtained by Stratus OCT and Spectralis OCT. Solid line indicates the average mean difference, while dotted lines delineates the 95% confidence limits of agreement.
Table 2. Comparison of regional and total macular thicknesses measured by spectral domain and time domain optical coherence tomography
Stratus OCT (mean±SD)
Spectralis OCT
(mean±SD) p-values Mean difference (SD OCT-TD OCT)
95% limits of agreement
Foveal thickness 367.2±155.0 427.6±147.4 <0.001 60.4 88.9 (16.0-104.9)
Inner subfield thickness
Temporal 352.3± 96.1 413.7± 88.3 <0.001 61.4 113.5 (2.4-116.0)
Superior 358.2± 89.4 419.8± 90.0 <0.001 61.6 100.1 (11.5-111.7)
Nas al 358.1±102.8 425.1±100.6 <0.001 67.0 91.9 (16.0-107.9)
Inferior 347.3± 94.2 404.8± 86.7 <0.001 57.4 120.7 (-2.9-117.8)
Outer subfield thickness
Temporal 274.4±+65.6 331.4± 67.0 <0.001 57.0 82.8 (15.6-98.4)
Superior 286.2± 63.6 341.5± 63.7 <0.001 55.3 82.4 (14.1-96.5)
Nas al 307.5± 70.6 361.3± 68.5 <0.001 53.7 92.0 (7.7-99.7)
Inferior 274.9± 60.2 331.4± 54.5 <0.001 56.5 81.1 (6.0-87.1)
Total macular thickness 312.1± 96.6 367.0±100.0 <0.001 55.0 66.7 (21.6-88.3)
Total macular volume 8.6±1.7 10.0± 1.6 <0.001 1.4 2.4 (0.2-2.6)
0.92/0.95, 0.91/0.90, 0.80/0.93로 SD OCT에서 반복성이 유의하게 더 높았다(Table 3).
TD OCT상 중심황반두께가 400 μm를 기준으로 반복성 을 비교했을 때, 중심황반두께가 400 μm 미만일 때 중심황 반두께의 변동계수는 TD OCT에서 2.48%, SD OCT에서 1.19%로 유의한 차이를 보였다. 그리고 중심황반두께가 400 μm 이상에서는 TD OCT에서3.07%, SD OCT에서 1.72%로 차이를 보였으나 유의한 차이를 보이지 않았다.
그리고 두 기종 내에서 비교했을 때, 변동계수가 TD OCT 는 2.48%에서 3.07%로 SD OCT에서는 1.38%에서 1.72%
로 중심황반두께가 400 μm 이상인 경우 반복성이 유의하
게 낮았다(Table 4).
중심와두께, 총황반두께에 대한 95%의 일치도 범위는 각각 88.9 μm, 66.7 μm 이었다(Fig. 1, 2). 두 OCT에 대한 95%의 일치도 범위는 d – 1.96s 에서 d + 1.96s[d; SD OCT 평균값–TD OCT 평균값, s; 표준편차]이므로, 중심와 두께에서 두 OCT 평균값 차이의 95% 일치도 범위는 16.0 μm 에서 104.9 μm 까지이다(Fig. 1, Table 2).
두 OCT로 측정한 황반두께 측정값 사이의 상관관계를 알아보기 위한 Pearson 상관계수는 총황반두께(0.99)에서 가장 높았고, 바깥쪽원의 하측(0.88)에서 가장 낮았다. 그 리고 두 OCT 사이의 모든 황반두께와 총황반부피의 상관
Table 3.Within-subject standard deviation (Sw), coefficient of variation (CVw), and intraclass correlation coefficient (ICC) of total and regional macular thicknesses obtained with time domain OCT and spectral domain OCT
Foveal Thickness
Inner subfield thickness Outer subfiled thickness Total Thickness
Total Volume Temporal Superior Nasal Inferior Temporal Superior Nasal Inferior
Sw TD OCT SD OCT
29.67 16.44
23.71 24.54
31.84 16.15
20.94 14.93
34.73 13.10
13.81 8.88
17.31 8.97
14.27 12.54
31.38 9.50
8.56 5.08
1.26 0.23 CVw TD OCT
SD OCT
2.92 1.39
2.43 2.14
3.21 1.39
2.11 1.28
3.61 1.17
2.82 1.97
2.18 1.45
2.68 1.25
4.12 2.07
2.99 1.50
2.10 1.97 ICC TD OCT
SD OCT
0.921 0.952
0.934 0.963
0.937 0.962
0.932 0.956
0.924 0.942
0.917 0.931
0.893 0.919
0.784 0.903
0.843 0.924
0.912 0.897
0.801 0.932 p-value* 0.014 0.233 0.004 0.128 <0.001 0.005 0.001 0.018 <0.001 <0.001 0.002
*Companson of within-subject variances between stratus OCT and Spectralis OCT (paired t test on log-transformed data).
Table 4. Within-subject standard deviation (Sw), coefficient of variation (CVw), and intraclass correlation coefficient (ICC) of total and regional macular thicknesses obtained with time domain OCT and spectral domain OCT between below 400 μm and over 400 μm
FT<400 μm (26 eyes) FT≥400 μm (16 eyes)
Fovea Thickness
Total Thickness
Total Volume
Fovea Thickness
Total Thickness
Total Volume
Sw TD OCT
SD OCT
21.64 14.25
8.31 3.77
0.26 0.16
44.03 27.15
10.52 7.42
0.32 0.45 p=0.012
CVw TD OCT
SD OCT
2.48 1.19
2.03 1.38
1.85 1.60
3.07 1.72
3.04 2.65
2.38 2.48 p=0.043
ICC TD OCT
SD OCT
0.930 0.961
0.922 0.925
0.825 0.941
0.909 0.937
0.899 0.882
0.782 0.920
p-value* 0.004 0.002 <0.001 0.269 0.052 0.015
*Companson of within-subject variances between stratus OCT and Spectralis OCT (paired t test on log-transformed data).
Table 5.Pearson correlation coefficient of macular thicknesses and total macular volume obtained with time domain OCT and spectral domain OCT
Foveal Thickness
Inner subfield thickness Outer subfiled thickness Total Thickness
Total Volume Temporal Superior Nasal Inferior Temporal Superior Nasal Inferior
Pearson correlation
coeffcient
0.98 0.94 0.97 0.97 0.94 0.91 0.97 0.93 0.88 0.99 0.95
p-value* <0.001 <0.001 <0.001 <0.001 <0.001 <0.001 <0.001 <0.001 <0.001 <0.001 <0.001
*Pearson's correlation coefficient between stratus OCT and spectralis OCT.
계수는 통계적으로 유의하였다(p<0.001, Table 5).
고 찰
지금까지 황반두께 측정에 널리 쓰이고 있는 TD OCT는 초당 400 A-scan의 속도와 10 μm의 축 해상도를 보이는 반면, 최근 개발된 SD OCT는 초당 20,000 이상으로 TD OCT에 비해 50배 이상의 빠른 A-scan 속도와 5 μm의 축 해상도를 보인다. 작동원리는 두 OCT가 비슷하지만, TD OCT는 reference mirror가 움직이면서 시간에 따른 신호 를 측정해 속도가 느리나, SD OCT는 reference mirror가
고정되어 있으며 간섭계(interferometer)에서 나온 light spectrum을 동시에 분광계(spectrometer)로 탐지한 후 망 막의 두께 정보를 측정한다. 또한 TD OCT는 황반 중심을 가로지르는 방사상의 6개 선형을 따라 표본 추출을 하기 때 문에 전체 황반의 5%만 측정이 가능하며 이를 보완하기 위 해 황반두께를 외삽법(extrapolation)으로 추정하게 된다.
이에 비해 SD OCT는 수평 주사선을 화면의 위에서부터 아 래로 내려가면서 한 줄씩 주사하여 화면을 형성하는 래스 터 주사(raster scan)방식으로 더 많은 표본 추출을 할 수 있으며 이런 차이로 SD OCT는 TD OCT에 비해 망막 내 구조를 더 자세하게 보여줄 수 있다.9,10
일반적으로 변동계수가 10% 미만일 때 신뢰할 수 있는 검사로 인정되며,15,16 TD OCT인 Stratus OCT로 측정한 황반두께가 신뢰할 수 있다는 보고는 많이 있다.6-8저자들 은 이미 정상안을 대상으로 한 연구에서 Stratus OCT에서 측정된 황반두께의 변동계수는 1.01%~2.78%, 급내상관계 수는 0.78~0.96이었고, SD OCT인 Spectralis OCT에서의 변동계수는 1% 미만이었고, 급내상관계수는 0.92~0.99로 SD OCT는 TD OCT인에 비해 더 높은 반복성을 보인다는 사실을 보고하였다.11-12그러나 SD OCT의 빠른 속도와 높 은 해상도가 정상안이 아닌 황반부종 등과 같은 여러 가지 황반 질환에서의 황반두께 측정에 있어서 더 높은 신뢰도 를 보일 지에 대한 평가는 아직까지 정확하게 이루어지지 않다.
이번 연구에서 Stratus OCT에서 측정된 황반두께의 변 동계수는 2.11~4.12%이었고, 급내상관계수는 0.78~0.94 이었다. 이에 비해 Spectralis OCT에서의 변동계수는 황반 두께 측정에서 1.17~2.14%이었고, 급내상관계수는 0.90~
0.96으로 SD OCT인 Spectralis OCT가 TD OCT인 Stratus OCT에 비해 더 높은 반복성을 보였다.
Spectralis OCT로 측정한 중심와두께, 총황반두께, 총황 반부피는 각각 427.6±147.4 μm 367.0±100.0 μm, 10.0±
1.6 mm3로 Stratus OCT로 측정한 367.2±155.0 μm, 312.1
±96.6 μm, 8.6±1.7 mm3에 비해 통계적으로 유의하게 높 았다. Spectralis OCT의 황반두께 측정치가 Stratus OCT 에 비해 더 높음에도 불구하고 개체내 분산(within-sub- ject variances)은 통계적으로 의미 있게 낮았다. 이와 같이 SD OCT인 Spectralis OCT가 더 높은 반복성을 보이는 이 유는 TD OCT에 비해 훨씬 빨라진 스캔 속도, 더 많은 표본 추출밀도(higher sampling density) 및 Spectralis OCT에 있는 특별한 기능인 dual beam system, 즉, 시선 추적(eye tracking) 기능에 의한 것으로 볼 수 있다.
중심황반두께를 400 μm를 기준으로 두 군으로 나누어 두 OCT간 반복성을 비교해 보았는데, 400 μm 미만인 군과 400 μm 이상인 군에서의 변동계수는 TD OCT에서 각각 2.48%와 3.07%, SD OCT에서는 1.38%와 1.72%로 중심 황반두께가 400 μm 이상인 경우 반복성이 유의하게 낮았 다. 이러한 결과는 황반부종이 심할수록 환자의 주시가 불 량하기 때문인 것으로 생각된다. 따라서 SD OCT는 많은 장점으로 인해 TD OCT에 비해 더 높은 반복성을 보이기는 하지만 황반부종이 심할수록 반복성이 떨어진다는 사실을 알 수 있었다. 이러한 결과로 볼 때 SD OCT로 황반두께 측 정 시 빠른 스캔속도와 표본추출밀도뿐만 아니라 환자의 주시도 반복성의 주요 결정변수 중 하나로 볼 수 있다.
본 연구에서 전체 및 구역별 황반두께와 총황반부피는
SD OCT에서 통계적으로 유의하게 더 높게 측정되었는데, 그 이유는 황반두께의 측정 기준이 두 OCT가 다르기 때문 이다. Stratus OCT는 황반두께 측정에 있어 유리체-망막 면에서 시세포층의 내/외절 연접부 사이의 거리를 기준으 로 하나, Spectralis OCT는 유리체-망막면에서 브루크막 을 경계로 하기 때문이다. 즉, 두 OCT 사이의 황반두께의 차이는 황반부 시세포 외절과 망막색소상피(retinal pig- ment epithelium, RPE)의 두께에 상응하는 값으로 생각할 수 있다. 정상안에서 시세포 외절의 길이는 50 μm이고,17 RPE의 두께는 11.3 μm 정도로 알려져 있다.18본 연구에서 나타난 두 OCT의 구역별 황반두께 차이는 53.7~67.0 μm 로 황반부종이 있기는 하지만 정상안에서의 시세포 외절 길이와 RPE 두께에 상응하는 범위를 보였다. 이처럼 두 OCT는 황반두께를 측정할 때 그 기준면이 다르므로 여기 서 얻은 황반두께의 측정치는 당뇨황반부종에서 서로 다르 며 일치도가 낮을 수밖에 없다. 이는 저자들이 보고한 정상 안에서 두 OCT는 서로 다른 일치도를 보인다는 결과와 유 사하며 당뇨황반부종에서도 Stratus OCT에서 측정된 황반 두께와 부피는 Spectralis OCT의 측정결과와 상호 교환될 수는 없다는 것을 의미한다.
그러나 모든 황반두께 및 총황반부피에서 측정한 두 OCT 사이의 Pearson 상관계수는 0.88에서 0.99로 모두 통 계적으로 유의하였다. 이러한 결과는 두 OCT로 측정했을 때 그 결과들은 직접적으로 상호 교환적이지는 못하지만 두 OCT 간의 측정치를 간접적으로 알 수 있고, 이를 통해 당뇨황반부종 치료 전 후, 혹은 경과관찰 시 황반두께의 추 이를 알아보는 데는 상호 도움이 될 수 있다는 점을 시사한다.
결론적으로 본 연구에서 저자들은 TD OCT인 Stratus OCT와 SD OCT인 Spectralis OCT는 황반두께와 총황반부 피 측정치의 차이가 있음에도 두 OCT 모두 당뇨황반부종 환 자의 황반부 측정에 있어 높은 반복성을 보였으며 Spectralis OCT에서 유의하게 더 높았다. 황반측정 값은 Spectralis OCT에서 Stratus OCT에 비해 더 높게 측정되었고, 두 OCT는 낮은 일치도를 보여 상호 교환적이지는 않았으나, 두 OCT간 유의한 상관관계를 보였다.
앞으로 저자들은 여러 황반 질환 환자들을 대상으로 SD OCT의 임상적인 유용성에 대한 추가적인 연구를 시행할 예정이다.
참고문헌
1) Zeimer RC, Mori MT, Khoobehi B. Feasibility test of a new method to measure retinal thickness noninvasively. Invest Ophthalmol Vis Sci 1989;30:2099-105.
2) Gieser JP, Rusin MM, Mori M, et al. Clinical assessment of the macular by retinal topography and thickness mapping. Am J Ophthalmol 1997;124:648-60.
3) Polito A, Shah SM, Haller JA, et al. Comparision between retinal thickness analyzer and optical coherence tomography for assess- ment of foveal thickness in eyes with macular disease. Am J Ophthalmol 2002;134:240-51.
4) Puliafito CA, Hee MR, Schuman JS, et al. Optical coherence to- mography of ocular disease. Thorofare, NJ: Slack, 1996;369-74.
5) Muscat S, Parks S, Kemp E, Keating D. Repeatability and re- producibility of macular thickness measurements with the Humphrey system. Invest Ophthalmol Vis Sci 2002;43;490-5.
6) Gurses-Ozden R, Teng C, Vessani R, et al. Macular and retinal nerve fiber layer thickness measurement reproducibility using op- tical coherence tomography (OCT-3). J Glaucoma 2004;13:238-44.
7) Paunescu LA, Schuman JS, Price LL, et al. Reproducibility of nerve fiber thickness, macular thickness, and optic nerve head measurements using Stratus OCT. Invest Ophthalmol Vis Sci 2004;45:1716-24.
8) Polito A, Del Borrello M, Isola M, et al. Repeatability and re- producibility of fast macular thickness mapping with Stratus opti- cal coherence tomography. Arch Ophthalmol 2005;123:1330-7.
9) Hangai M, Ojima Y, Gotoh N, et al. Three-dimensional imaging of macular holes with high-speed optical coherence tomography.
Ophthalmology 2007;114:763-73.
10) Ahlers C, Michels S, Beckendorf A, et al. Three-dimensional imaging of pigment epithelial detachment in age-related macular degeneration using optical coherence tomography, retinal thick-
ness analysis and topographic angiography. Graefes Arch Clin Exp Ophthalmol 2006;244:1233-9.
11) Leung CK, Cheung CY, Weinreb RN, et al. Comparison of mac- ular measurements between time domain and specral domain opti- cal coherence tomography. Invest Ophthalmol Vis Sci 2008;49:
4893-7.
12) Oh SB, Cho WB, Moon JW, Kim HC, et al. Repeatability and agreement of macular thickness measurement using time domain OCT and spectral domain OCT in normal subjects. J Korean Ophthalmol Soc 2009;50:710-6.
13) Bland JM, Altman DG. Statistical methods for assessing agree- ment between two methods of clinical measurement. Lancet 1986;
1:307-10.
14) Bland JM. Comparing within-subject variances in a study to com- pare two methods of measurement. Available at http://www- users. york.ac.uk/~mb55/meas/compsd.pdf.
15) Massin P, Vicaut E, Haouchine B, et al. Reproducibility of retinal mapping using optical coherence tomography. Arch Ophthalmol 2001;119:1135-42.
16) Shrout PE, Fleiss JL. Intraclass correlations: uses in assessing rater reliability. Pshychol Bull 1979:86:420-8.
17) Hendrickson A, Drucker D. The development of parafoveal and mid-peripheral human retina. Behav Brain Res 1992;49:21-31.
18) Spraul CW, Lang GE, Grossniklaus HE. Morphometric analysis of the choroid, Bruch's membrane, and retinal pigment epi- thelium in eyes with age-related macular degeneration. Invest Ophthalmol Vis Sci 1996;37:2724-35.
=ABSTRACT=
Repeatability and Agreement of Macular Thickness Measurement Using Time and Spectral Domain OCT in Diabetic Macular Edema
Se Beum Oh, MD, Jun Woong Moon, MD, Hyung Chan Kim, MD, PhD
Department of Ophthalmology, Konkuk University School of Medicine, Seoul, Korea
Purpose: To evaluate the repeatability of macular thickness measurements using time domain (TD) OCT and spectral domain (SD) OCT in diabetic macular edema.
Methods: In 42 eyes of 42 patients with diabetic macular edema, three consecutive macular measurements were performed with TD OCT and SD OCT, and measurements for macular thickness and total macular volume obtained by the two OCTs were compared. The within-subject standard deviation (Sw), coefficient of variation (CVw), and intraclass correlation coefficient (ICC) were calculated to assess repeatability, with agreement between measurements assessed with Bland Altman plots. The correlat- ions were also evaluated via the Pearson’s correlation coefficient.
Results: The Sw of TD OCT and SD OCT for foveal thickness, total macular volume were 29.67 μm/16.44 μm, 1.26 mm3/0.23 mm3, respectively, and were significantly lower in SD OCT. The ranges of the respective CVw and ICC values were 1.10-2.78%, 0.78~0.96 for TD OCT, and 0.29~0.94%, 0.92~0.99 for SD OCT. The SD OCT showed better repeatability for macular thickness measurements (all p≤0.001). The 95% limits of agreement for foveal and total macular volume were 88.9 μm, 2.4 mm3, respectively. The Pearson’s correlation coefficients of macular thickness and total macular volume between the two OCT methods were statistically significant (p=0.88-0.99).
Conclusions: Although both OCTs proved reliable for macular thickness measurements in diabetic macular edema, SD OCT shows better repeatability than TD OCT. Although macular thickness measurements obtained from the two OCTs cannot be used interchangeably, there were statistically significant correlations between measurements obtained using the two OCTs.
J Korean Ophthalmol Soc 2010;51(3):372-378
Key Words: Coefficient of variation, Intraclass correlation coefficient, Spectral domain OCT, Time domain OCT, Within-subject standard deviation
Address reprint requests to Hyung Chan Kim, MD, PhD
Konkuk University Medical Center, Konkuk University School of Medicine
#4-12 Hwayang-dong, Gwangjin-gu, Seoul 143-729, Korea
Tel: 82-2-2030-5270, Fax: 82-2-2030-5273, E-mail: [email protected]