© 2019 The Korean Ophthalmological Society
This is an Open Access article distributed under the terms of the Creative Commons Attribution Non-Commercial License (http://creativecommons.org/licenses /by-nc/3.0/) which permits unrestricted non-commercial use, distribution, and reproduction in any medium, provided the original work is properly cited.
Original Article
Early detection of glaucoma is essential for maintaining the quality of life by preserving the patient’s visual func-
tion as long as possible [1,2]. To detect glaucoma earlier, optical coherence tomography (OCT) is widely used by many clinicians, as OCT is thought to be very efficient in detecting retinal nerve fiber layer defects. Clinicians cur- rently depend upon summary metrics. While numerous studies have documented that the metrics show reasonably good sensitivity [3], summary metrics can also miss eyes with clear damage as seen on probability maps [4]. The OCT manufacturers utilize unique software algorithms for
Received: January 10, 2018 Accepted: August 7, 2018
Corresponding Author: Seungsoo Rho, MD, PhD. Department of Oph- thalmology, CHA Bundang Medical Center, CHA University, 59 Yatap- ro, Bundang-gu, Seongnam 13496, Korea. Tel: 82-31-781-5326, Fax: 82-31- 780-3449, E-mail: [email protected]
*These two authors contributed equally to this article.
Clinical Efficacy of Custom-built Software for the Early Detection of Glaucoma: A Comparison of Axial-length and Major Retinal Artery
Location Data
Hyoju Jang1*, Sang Min Lee2*, Jaehong Ahn1, Seungsoo Rho2
1Department of Ophthalmology, Ajou University College of Medicine, Suwon, Korea
2Department of Ophthalmology, CHA Bundang Medical Center, CHA University, Seongnam, Korea
Purpose: To assess the clinical efficacy for early detection of glaucoma using custom-built image software visualizing translucent retinal nerve fiber layer thickness (RNFLT) that is graphed based on a normative data- base.
Methods: This prospective study was conducted using a normative database constructed with RNFLT data of 151 healthy Korean eyes. The reference lines of the mean, the lower 5%, and the lower 1% limit were visual- ized as a translucent RNFLT graph produced by our software after inputting each subject’s major retinal ar- tery position and overlaying the results onto the RNFLT measurements. Fifty-eight additional healthy control and 79 early-glaucoma eyes were collected for the validation group. If a subject’s RNFLT graph was outside the reference line of the lower 1% limit, the graph was defined as abnormal. The lower 1% limit, which was generated by three criteria (criterion 1, built-in software; criterion 2, axial-length data; criterion 3, major retinal artery data), was used to address the difference of agreement with a standard answer.
Results: For criteria 1, 2, and 3, the accuracy of our custom-built software was significantly higher than that of the manufacturer’s database (kappa of 0.475 vs. 0.852 vs. 0.940; sensitivity of 62.0% vs. 91.1% vs. 97.5%, respectively) maintaining high specificity (87.9% vs. 94.8% vs. 96.6%, respectively).
Conclusions: The custom-built imaging software with the constructed RNFLT normative database showed high clinical efficiency for early detection of glaucoma with negligible user-related variability.
Key Words: Axial length, Database, Glaucoma, Major retinal artery position, Optical coherence tomography
their own devices, which are driven by a normative data- base considering age and sex.
However, as described by previous studies, the normative database can be limited by ethnicity, axial length, and reti- nal vessel positions. Although taking all variables into ac- count is too difficult, we can compare the variables in a single environment to determine which variable is better to detect glaucomatous changes. In our previous study [5], we showed that the major retinal artery position and the axial length were the two most relevant factors to peaks of the peripapillary retinal nerve fiber layer thickness. However, for a more precise comparison, we needed to develop a new program that could visualize the customized normative da- tabase of the retinal nerve fiber layer.
This study assessed the influence of the two major fac- tors (major retinal artery position and axial length) on de- tecting glaucoma early in a single ethnicity group. The goal was to determine the relationship of each factor to the cri- teria discordance by considering each factor for glaucoma detection.
Materials and Methods
This study was approved by the institutional review board of CHA Bundang Medical Center (2017-05-045-001) and conducted at CHA Bundang Medical Center. This study conformed to the Declaration of Helsinki and written informed consent was obtained. One hundred and fifty-one healthy eyes of 151 Korean adults (normative group, pro- spectively enrolled and approved by the institutional review board) and 137 additional eyes (validation group; 79 ear- ly-glaucoma eyes of 79 Korean adults and 58 age-matched additional healthy eyes of 58 Korean adults retrospectively enrolled and approved by the institutional review board) were consecutively enrolled between 2015 and 2017. All subjects underwent a full ophthalmic examination includ- ing slit-lamp biomicroscopy, best-corrected visual acuity (BCVA), spherical equivalent measurements, Goldmann applanation tonometry by a glaucoma specialist (SR), cen- tral corneal thickness (CCT) measurements using an ultra- sonic pachymeter (UP-1000; Nidek, Gamagori, Japan), axi- al-length (AXL) determinations using an Echoscan (US- 4000, Nidek), gonioscopy, visual-field tests using static automated white-on-white threshold perimetry (Swedish Interactive Threshold Algorithm standard 24-2, Humphrey
Field Analyzer II; Carl Zeiss Meditec, Dublin, CA, USA), fundus examinations after pupil dilation, fundus photogra- phy/red-free photography using a fundus camera (VX-10i;
Kowa, Nagoya, Japan), and Spectralis OCT scans (Heidel- berg Engineering GmbH, Heidelberg, Germany).
The inclusion criteria for all subjects were visual acuity of >20 / 30 and an age between 18 and 80 years. The exclu- sion criteria were clinical evidence of neuro-ophthalmic disease, retinal disease, history of retinal and refractive surgery within 3 months, or closed irido-corneal angle and refractive error of >± 8.0 diopters (D) and ±3.0 D of cylin- der. In the normal group, subjects were additionally ex- cluded if intraocular pressure (IOP) was > 21 mmHg, a glaucomatous optic disc was present, or abnormal visual- field test results existed. Subjects with mean deviation (MD) values >-6 dB (normal or early field damage) were consecutively enrolled in the validation group.
The retinal nerve fiber layer (RNFL)-defect-detecting ability of the two software programs were assessed based on the standard criterion named “early-glaucoma state.”
The early-glaucoma state was defined as subjects showing glaucomatous optic disc contours or RNFL defects in red- free photography plus corresponding abnormal visual-field results with early damage (MD better than -6 dB). A reli- able visual field was defined by fixation loss <30% and a false-positive or false-negative error <20%. An abnormal visual field was defined by one or more of the following criteria: glaucoma hemifield test outside normal limits, pat- tern standard deviation decreased to p < 0.05, and three or more non-edged points in a cluster decreased to p < 0.05 with one of these decreased to p < 0.01 [6].
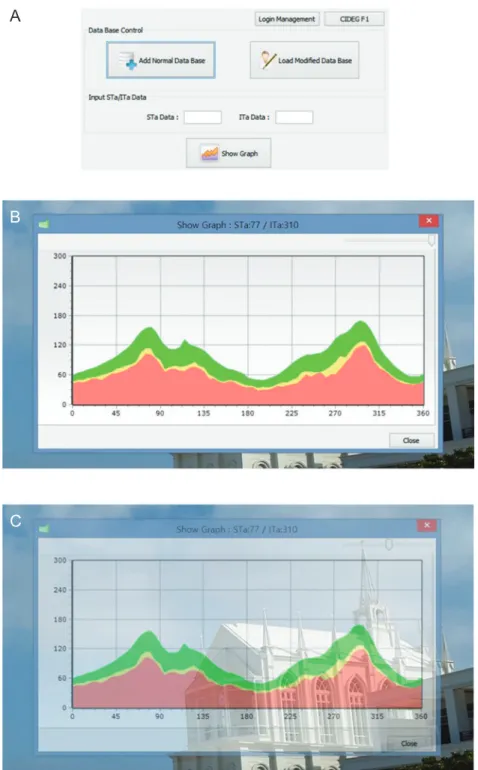
The subjects’ temporal-superior-nasal-inferior-temporal (TSNIT) graphs in the validation group were assessed us- ing the built-in software and our custom-built software. If a subject’s graph line contacted the reference graph of each software (lower 1% limit of normative data), it was defined as abnormal. The custom-built software displayed four different normative graphs according to the major retinal artery position [5]. Using the overlaying technique in the software, the observer could detect abnormal re- gions easily (Fig. 1A-1C). The validation group was set to compare the RNFL-defect-detecting ability of three dif- ferent criteria for the lower 1% limit. Criterion 1 was from the manufacturer’s data; criteria 2 and 3 were from the es- tablished normative data in 151 healthy Korean eyes driv- en by their axial length and vessel position, respectively.
For criteria 2 and 3, the volunteers’ data were separated into four subgroups, which were combinations of two groups according to the median values of axial-length and vessel-position data.
RNFL-thickness measurement and angle assessment All OCT scans were performed by a highly experienced operator, and image analysis was performed according to the same protocol as described elsewhere [5]. Briefly, the peripapillary RNFL thicknesses were measured using the instrument’s built-in software ver. 5.4.7.0. To avoid the Fo- vea to Disc (FoDi) technology effect, the mode for internal fixation was deactivated because the FoDi technology pro- vides a predicted horizontal fovea to disc axis even in a se- verely torsioned eye at a baseline scan. This means that the FoDi effect would interfere the measurement of the RNFL peak location. All measurements were automatically seg- mented and selected images (with quality scores >22) were reconfirmed one by one.
Each subject’s RNFL-thickness data at intervals of 5° (a total of 72 values) were extracted using the Cool Ruler soft- ware ver. 1.5 (freeware from Fabsoft, http://www.fabsoft.
com) from the TSNIT graphs. The cross points in a 3.5-mm peripapillary circle and the major retinal arteries of the su- perotemporal and inferotemporal halves were designated obtaining the angle degrees between a horizontal line (from the center of the disc) and the cross points. The angle de- grees were measured with the PicPick software ver. 3.2.4 (freeware from NTeWORKS, http://www.picpick.org) and ImageJ (National Institutes of Health, Bethesda, MD, USA).
Statistical analysis
Statistical analyses were performed using the IBM SPSS Statistics ver. 21.0 (IBM Corp., Armonk, NY, USA). Chi- square tests and independent sample t-tests were used to compare demographic features. A p-value <0.05 was de- fined as statistically significant. For comparison between the accuracy of the built-in software and our custom-built software, kappa values were utilized to assess the degree of agreement between the two software programs to identify the early-glaucoma state. The kappa statistic was calculated from a 2-by-2 table in which the results from the two soft- ware programs corresponded to that for early-glaucoma di- agnoses. Kappa values between 0.0 and 0.2 indicated slight
agreement; those between 0.21 and 0.40 indicated fair agreement; those between 0.41 and 0.60 indicated moderate agreement; those between 0.61 and 0.80 indicated good agreement; and those between 0.81 and 1.00 indicated al- most perfect agreement. With estimated kappa values of 0.4 and 0.9 for each software’s decision from a pilot study, a minimal number of 50 subjects was required to detect a 0.5 difference in kappa values above positive ratings of 0.5 with 90% statistical power [7].
The characteristics of the subjects were statistically ana- lyzed according to whether the software programs have an identical decision from all three criteria (concordance group) or not (discordance) to assess the relationship be- tween different criteria and the early detection ability.
Results
Table 1 shows the percentage of males in the early-glau- coma group that was relatively higher than that of the nor- mal group with marginal statistical significance (p = 0.04).
The mean values of CCT, MD, and visual-field index (VFI) in the normal group were higher than those in the ear- ly-glaucoma group. BCVA, IOP, AXL, major artery loca- tion (STa and ITa) and inter-arterial angle were not statisti- cally different between the normal group and the early-glaucoma group.
Table 2 shows the agreement of the three criteria with the standard diagnosis of early-glaucoma eyes. Kappa val- ues for criterion 3 (κ = 0.940, p < 0.001) were highest among the three criteria. However, criterion 2 (κ = 0.852, p
< 0.001) also showed higher kappa values than criterion 1 (κ
= 0.475, p < 0.001). The sensitivity and specificity for each criterion are listed in Table 2. Criterion 3 showed the best discriminatory ability, although criterion 2 was also better than criterion 1.
Fig. 1 describes how to utilize the custom-built software.
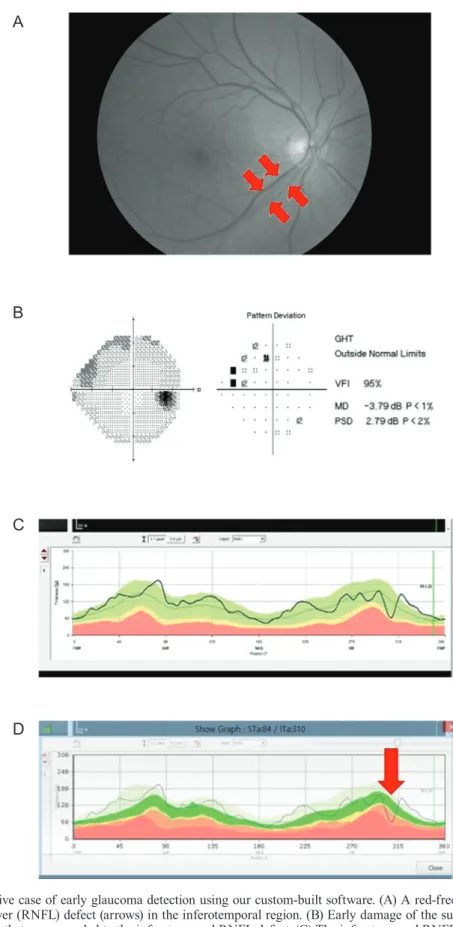
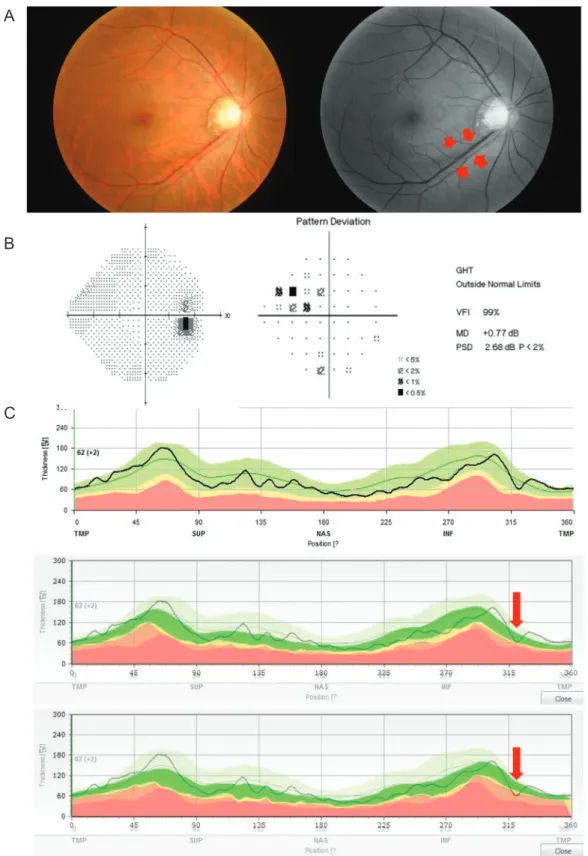
Two representative cases showing a remarkable ability to detect glaucoma early are displayed in Fig. 2A-2D. And the ability to detect early glaucoma can be improved by using the vessel position data (Fig. 3A-3C).
Table 3 shows the demographic characteristics of the positive-OCT group and the false-negative-OCT group.
Age, sex, BCVA, IOP, CCT, and AXL were similar in the two groups. However, the MD and VFI of the false-nega- tive eyes in the OCT group were higher than those of the
positive eyes, suggesting that more false-positive results were observed in early-glaucoma cases using criterion 1 (manufacturer’s database). The ITa was related to the tem- poralization of vessels in the false-negative group with sta- tistical significance (p = 0.003). However, the STa was not
related to the temporalization. This might be also related to the vulnerability difference between the inferior and supe- rior RNFL defects [8].
We also compared the concordance of criteria 2 and 3 with criterion 1 in the early-glaucoma group (Table 4, 5).
Fig. 1. A demonstration of an overlaying function using our custom-built software. (A) The main window of the custom-built software shows the principal features including database management, artery information input window, and the graph visualization function key.
(B,C) The background was seen using a manual adjustment cursor.
A
B
C
Table 1. Patient demographics of normal group and early glaucoma group
Normal group (n = 58) Early glaucoma group (n = 79) p-value*
Age (yr) 49.95 ± 11.93 (46.83 to 52.92) 48.06 ± 11.67 (45.47 to 50.82) 0.632
Sex (female) 33 (56.9%) 31 (39.2%) 0.041
BCVA (Snellen) 0.89 ± 0.17 (0.84 to 0.93) 0.88 ± 0.19 (0.84 to 0.92) 0.884
IOP (mmHg) 17.69 ± 4.56 (16.49 to 18.87) 17.00 ± 3.57 (16.16 to 17.77) 0.402
AXL (mm) 24.49 ± 1.28 (24.16 to 24.83) 24.67 ± 1.65 (24.30 to 25.00) 0.495
CCT (μm) 553.95 ± 34.21 (545.13 to 564.07) 537.75 ± 39.89 (528.63 to 546.84) 0.015
MD (dB) -0.21 ± 1.52 (-0.61 to 0.23) -1.89 ± 1.81 (-2.30 to -1.51) 0.001
VFI (%) 98.73 ± 1.50 (98.33 to 99.09) 96.28 ± 3.69 (95.43 to 97.04) 0.001
STa (o) 70.15 ± 10.82 (67.44 to 73.04) 70.28 ± 9.42 (68.31 to 72.51) 0.939
ITa (o) 286.64 ± 12.44 (283.25 to 289.74) 287.36 ± 12.50 (284.46 to 290.01) 0.742 IAA (o) 142.92 ± 16.64 (139.23 to 146.49) 143.83 ± 18.79 (139.33 to 148.39) 0.763 Values are presented as mean ± standard deviation (range) unless otherwise indicated.
BCVA = best-corrected visual acuity; IOP = intraocular pressure; AXL = axial length; CCT = central corneal thickness; MD = mean de- viation; VFI = visual field index; STa = angle degree of superotemporal major retinal artery; ITa = angle degree of inferotemporal major retinal artery; IAA = inter-arterial angle.
*Independent samples t-test except gender variable (chi-square test).
Table 2. Kappa values, sensitivity and specificity of each software for detecting early glaucoma
κ-value (95% CI) p-value Sensitivity (95% CI) Specificity (95% CI) Criterion 1* 0.475 (0.334 to 0.608) <0.001 0.620 (0.510 to 0.729) 0.879 (0.771 to 0.940) Criterion 2† 0.852 (0.7649 to 0.940) <0.001 0.911 (0.828 to 0.956) 0.948 (0.859 to 0.982) Criterion 3‡ 0.940 (0.876 to 1.000) <0.001 0.975 (0.912 to 0.993) 0.963 (0.875 to 0.990) CI = confidence interval.
*From the manufacturer’s data; †From the established normative data driven by their axial length; ‡From the established normative data driven by vessel position.
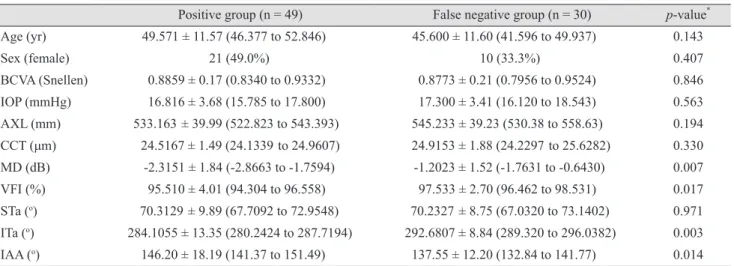
Table 3. Demographics between positive OCT group and false negative OCT group in early glaucoma eye (n = 79)
Positive group (n = 49) False negative group (n = 30) p-value* Age (yr) 49.571 ± 11.57 (46.377 to 52.846) 45.600 ± 11.60 (41.596 to 49.937) 0.143
Sex (female) 21 (49.0%) 10 (33.3%) 0.407
BCVA (Snellen) 0.8859 ± 0.17 (0.8340 to 0.9332) 0.8773 ± 0.21 (0.7956 to 0.9524) 0.846 IOP (mmHg) 16.816 ± 3.68 (15.785 to 17.800) 17.300 ± 3.41 (16.120 to 18.543) 0.563 AXL (mm) 533.163 ± 39.99 (522.823 to 543.393) 545.233 ± 39.23 (530.38 to 558.63) 0.194 CCT (μm) 24.5167 ± 1.49 (24.1339 to 24.9607) 24.9153 ± 1.88 (24.2297 to 25.6282) 0.330 MD (dB) -2.3151 ± 1.84 (-2.8663 to -1.7594) -1.2023 ± 1.52 (-1.7631 to -0.6430) 0.007
VFI (%) 95.510 ± 4.01 (94.304 to 96.558) 97.533 ± 2.70 (96.462 to 98.531) 0.017
STa (o) 70.3129 ± 9.89 (67.7092 to 72.9548) 70.2327 ± 8.75 (67.0320 to 73.1402) 0.971 ITa (o) 284.1055 ± 13.35 (280.2424 to 287.7194) 292.6807 ± 8.84 (289.320 to 296.0382) 0.003 IAA (o) 146.20 ± 18.19 (141.37 to 151.49) 137.55 ± 12.20 (132.84 to 141.77) 0.014 Values are presented as mean ± standard deviation (range) unless otherwise indicated.
OCT = optical coherence tomography; BCVA = best-corrected visual acuity; IOP = intraocular pressure; AXL = axial length; CCT = central corneal thickness; MD = mean deviation; VFI = visual field index; STa = angle degree of superotemporal major retinal artery; ITa
=angle degree of inferotemporal major retinal artery; IAA = inter-arterial angle.
*Independent samples t-test except gender variable (chi-square test).
A
B
C
D
Fig. 2. A representative case of early glaucoma detection using our custom-built software. (A) A red-free photograph shows a localized retinal nerve fiber layer (RNFL) defect (arrows) in the inferotemporal region. (B) Early damage of the superior visual field was noted in the subject’s right eye that corresponded to the inferotemporal RNFL defect. (C) The inferotemporal RNFL defect was not detected by the built-in software; (D) however, the defect was detected by our custom-built software. GHT = glaucoma hemifield test; VFI = visual-field index; MD = mean deviation; PSD = pattern standard deviation.
A
B
C
Fig. 3. A representative discordance case shows the detection ability of criterion 3 in the early diagnosis of glaucoma. (A) Red-free photog- raphy shows a wedge-shaped retinal nerve fiber layer (RNFL) defect in the inferotemporal region. The short red arrows indicate the margin of the defect. (B) Pattern deviation and global indices of visual-field tests demonstrate outside normal limit defects in the superonasal quad- rant. (C) Criterion 1 (top) and criterion 2 (middle) cannot detect any RNFL defect based on the lower 1% limit of RNFL thickness. Only criterion 3 (bottom) detects the glaucomatous RNFL defect (long red arrow). GHT = glaucoma hemifield test; VFI = visual-field index; MD
= mean deviation; PSD = pattern standard deviation.
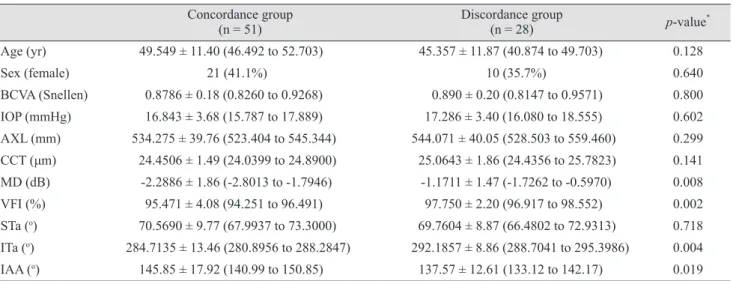
Table 4 shows that there was no factor related to the discor- dance between criteria 1 and 2. However, discordance was found between criteria 1 and 3, especially for MD, VFI, ITa, and inter-arterial angle. The difference was statistical- ly significant (Table 5) meaning that the STa-adjusted norms were more sensitive for the detection of early RNFL changes than the AXL-adjusted norms.
Discussion
In our study, we have constructed a new reference line for detecting retinal nerve fiber layer defects corrected by retinal vessel location or axial length using our cus- tom-built software. Individual variation of the RNFL thickness obtained using spectral domain OCT is a prob- Table 4. Demographics between concordance group and discordance group (criterion 1 vs. criterion 2) in early glaucoma eye (n = 79)
Concordance group
(n = 56) Discordance group
(n = 23) p-value*
Age (yr) 48.911 ± 11.31 (46.019 to 51.717) 46.000 ± 12.51 (41.167 to 51.285) 0.317
Sex (female) 24 (42.9%) 7 (30.4%) 0.301
BCVA (Snellen) 0.8787 ± 0.17 (0.8298 to 0.9231) 0.8922 ± 0.21 (0.8001 to 0.9739) 0.777 IOP (mmHg) 16.929 ± 3.59 (15.923 to 17.810) 17.174 ± 3.60 (15.609 to 18.631) 0.784 AXL (mm) 534.214 ± 38.15 (524.466 to 544.238) 546.348 ± 43.51 (527.250 to 563.638) 0.222 CCT (μm) 24.4314 ± 1.46 (24.0639 to 24.8457) 25.2443 ± 1.96 (24.4597 to 26.0734) 0.082 MD (dB) -1.9996 ± 1.95 (-2.5468 to -1.4730) -1.6317 ± 1.37 (-2.1384 to -1.0475) 0.415
VFI (%) 95.964 ± 3.94 (94.918 to 96.926) 97.043 ± 2.89 (95.834 to 98.158) 0.240
STa (o) 70.5943 ± 9.58 (68.0484 to 73.1086) 69.5230 ± 9.16 (65.6160 to 73.1132) 0.649 ITa (o) 285.6955 ± 13.39 (282.2839 to 289.0208) 291.4191 ± 8.84 (288.0193 to 295.0304) 0.064 IAA (o) 144.89 ± 17.60 (140.29 to 149.65) 138.10 ± 13.15 (133.01 to 143.37) 0.100 Values are presented as mean ± standard deviation (range) unless otherwise indicated.
BCVA = best-corrected visual acuity; IOP = intraocular pressure; AXL = axial length; CCT = central corneal thickness; MD = mean de- viation; VFI = visual field index; STa = angle degree of superotemporal major retinal artery; ITa =angle degree of inferotemporal major retinal artery; IAA = inter-arterial angle.
*Independent samples t-test except gender variable (chi-square test).
Table 5. Demographics between concordance group and discordance group (criterion 1 vs. criterion 3) in early glaucoma eye (n = 79) Concordance group
(n = 51) Discordance group
(n = 28) p-value*
Age (yr) 49.549 ± 11.40 (46.492 to 52.703) 45.357 ± 11.87 (40.874 to 49.703) 0.128
Sex (female) 21 (41.1%) 10 (35.7%) 0.640
BCVA (Snellen) 0.8786 ± 0.18 (0.8260 to 0.9268) 0.890 ± 0.20 (0.8147 to 0.9571) 0.800 IOP (mmHg) 16.843 ± 3.68 (15.787 to 17.889) 17.286 ± 3.40 (16.080 to 18.555) 0.602 AXL (mm) 534.275 ± 39.76 (523.404 to 545.344) 544.071 ± 40.05 (528.503 to 559.460) 0.299 CCT (μm) 24.4506 ± 1.49 (24.0399 to 24.8900) 25.0643 ± 1.86 (24.4356 to 25.7823) 0.141 MD (dB) -2.2886 ± 1.86 (-2.8013 to -1.7946) -1.1711 ± 1.47 (-1.7262 to -0.5970) 0.008
VFI (%) 95.471 ± 4.08 (94.251 to 96.491) 97.750 ± 2.20 (96.917 to 98.552) 0.002
STa (o) 70.5690 ± 9.77 (67.9937 to 73.3000) 69.7604 ± 8.87 (66.4802 to 72.9313) 0.718 ITa (o) 284.7135 ± 13.46 (280.8956 to 288.2847) 292.1857 ± 8.86 (288.7041 to 295.3986) 0.004 IAA (o) 145.85 ± 17.92 (140.99 to 150.85) 137.57 ± 12.61 (133.12 to 142.17) 0.019 Values are presented as mean ± standard deviation (range) unless otherwise indicated.
BCVA = best-corrected visual acuity; IOP = intraocular pressure; AXL = axial length; CCT = central corneal thickness; MD = mean de- viation; VFI = visual field index; STa = angle degree of superotemporal major retinal artery; ITa = angle degree of inferotemporal major retinal artery; IAA = inter-arterial angle.
*Independent samples t-test except gender variable (chi-square test).
lem not only for glaucoma specialists but also for patients in terms of their quality of life [2]. In one study, 15% of glaucoma patients were blind during their whole life [9].
Late diagnosis is one of the most important reasons for in- creasing the risk for blindness [10]. Therefore, if we can de- tect RNFL defects earlier, we may improve the patient’s vi- sion. From our previous study [5], we have confirmed that consideration of the major retinal artery position is helpful for early detection of glaucomatous RNFL defects. Howev- er, in clinics, different types and versions of OCT devices or software are used due to a financial or a technical rea- son. Therefore, clinicians cannot always apply the norma- tive database directly to each patient. Our study was origi- nally designed to overcome this issue using a simple overlaying technique with our developed software. This software can store the normative data of RNFL thickness- es, constructing a large database. With minimal modifica- tion, we can then utilize the data from the different types of OCT instruments or software, which means customiza- tion can be done per institution or per ethnic population.
Besides the location data of the major retinal vessel, my- opia parameters such as axial length and spherical equiva- lent were significantly correlated to the peak positions of RNFL thickness according to our previous study [5].
Therefore, using the database-constructing function in our software, we could configure variables after accumulating a large database to achieve a better diagnosis. This data- base program also allowed us to investigate the influence of ethnic differences on RNFL thickness or TSNIT graph contour [11].
Moreover, our software has a very simple but unique function that enables us to get two different graphs super- imposed on one screen or monitor. This function shines es- pecially in the real-world practice that is very heteroge- neous in terms of the types of monitors and the computer settings. This simple technique enables us not only to de- tect the RNFL defect in a different set of normative data- bases but also to use the software in different types of OCT devices (e.g., Cirrus or RTView). With a single placement of a cursor in the software window, we could make the ref- erence graph transparent as necessary (Fig. 1, 2). At first inspection, confusion due to the background color oc- curred; however, this issue was easily overcome by moving the cursor to optimize the transparency of the reference graph. The inter-user variability and the intra-user variabil- ity were checked by two examiners (a glaucoma specialist
and a resident). The kappa values were all 1.0, implying that the problem was negligible.
Although the major temporal vessel positions were known to be correlated with the peak of the RNFL [12,13], we found a slight discrepancy between superior and inferi- or artery locations. Wang et al. [8] reported that peripapil- lary superior artery positions were significantly nasalized according to glaucoma severity. This is a possible reason for the ITa’s statistically significant relationship to tempor- alization of vessels in the false-negative group. In our study, STa was not significant.
In our previous study, the correlation of RNFL peak lo- cation and other factors, such as major retinal artery or vein position, was observed. AXL was evaluated, and we found that the location of the major retinal artery was the factor most correlated with the RNFL peak location. Hood [4] also reported difficulty in interpreting the metrics that each OCT device provided although numerous studies have documented their reasonably good sensitivities (e.g., 80%).
If the study included only severe glaucoma cases, then 80%
sensitivity would be a serious issue. To prevent this issue, we have included eyes with early glaucomatous changes.
Because the major retinal artery location and AXL were the two most relevant factors to the RNFL-thickness data, we have assessed them in this study.
A major limitation of our study was the fundamental feature of indirectly obtained RNFL-thickness data be- cause of the manufacturer’s policy. However, as we dis- cussed in another report [5], qualitative and quantitative comparisons have shown the reproducibility error was smaller than the previously reported variation of OCT scans [14]. There were two false-positive cases in criterion 3 with an RNFL defect in the nasal region that generally correlated less to the glaucoma type. We believe that this might be one good reason to have a larger database to al- low the utilization of more variables. Although the RN- FL-thickness data had to be manually extracted, we up- loaded new normal data and visualized this data easily as a graph using our software.
In this study, we utilized only one variable at a time for categorizing the reference graph, which was determined by the median value of the artery positions or AXL values and which produced four graphs. The reason for this was effi- ciency. We compared the accuracy of this method to that of another method that had four subgroups determined by the bottom quarter, the median, and the top quarter values.
There was no significant difference between the two meth- ods (kappa value [95% confidence interval] of methods 1 and 2, 0.980 [0.941 to 1.000] vs. 0.960 [0.905 to 1.000], re- spectively). Although this study included early-glaucoma eyes for the validation set, in future studies data with pre-perimetric-glaucoma eyes or ocular-hypertensive eyes would be informative. After unification of ethnicity and graph shifting according to retinal artery location, the most remarkable change was the narrowing of the 99% interval.
Because the increase of sensitivity can lead to the early de- tection of glaucoma, more subtle changes can theoretically be detected.
In conclusion, even in early-glaucoma states, the accura- cy of RNFL defect-detection can be dramatically improved by considering the uniform ethnic population and the loca- tion of the major retinal artery. To achieve that goal, a cus- tomized database per institution with a graph-overlaying technique could provide a simple and feasible way for clin- ical practice.
Conflict of Interest
No potential conflict of interest relevant to this article was reported.
Acknowledgements
This study was supported by the 2014 Cheil-Nammyung Foundation Research Fund.
References
1. Freeman EE, Munoz B, West SK, et al. Glaucoma and qual- ity of life: the Salisbury Eye Evaluation. Ophthalmology 2008;115:233-8.
2. Heijl A. The times they are a-changin': time to change glau- coma management. Acta Ophthalmol 2013;91:92-9.
3. Budenz DL, Michael A, Chang RT, et al. Sensitivity and
specificity of the StratusOCT for perimetric glaucoma.
Ophthalmology 2005;112:3-9.
4. Hood DC. Improving our understanding, and detection, of glaucomatous damage: an approach based upon optical co- herence tomography (OCT). Prog Retin Eye Res 2017;57:46- 75.
5. Rho S, Sung Y, Kang T, et al. Improvement of diagnostic performance regarding retinal nerve fiber layer defect us- ing shifting of the normative database according to vessel position. Invest Ophthalmol Vis Sci 2014;55:5116-24.
6. Budenz DL. Atlas of visual fields. Philadelphia: Lippin- cott-Raven; 1997. p. 143-5.
7. Sim J, Wright CC. The kappa statistic in reliability studies:
use, interpretation, and sample size requirements. Phys Ther 2005;85:257-68.
8. Wang M, Jin Q, Wang H, et al. Quantifying positional variation of retinal blood vessels in glaucoma. PLoS One 2018;13:e0193555.
9. Forsman E, Kivela T, Vesti E. Lifetime visual disability in open-angle glaucoma and ocular hypertension. J Glaucoma 2007;16:313-9.
10. Grodum K, Heijl A, Bengtsson B. A comparison of glauco- ma patients identified through mass screening and in routine clinical practice. Acta Ophthalmol Scand 2002;80:627-31.
11. Kang SH, Park KH, Kim JM, et al. Korean normative data- base for time domain optical coherence tomography to de- tect localized retinal nerve fiber layer defects (preliminary study). Jpn J Ophthalmol 2010;54:144-50.
12. Hood DC, Fortune B, Arthur SN, et al. Blood vessel con- tributions to retinal nerve fiber layer thickness profiles measured with optical coherence tomography. J Glaucoma 2008;17:519-28.
13. Hood DC, Salant JA, Arthur SN, et al. The location of the inferior and superior temporal blood vessels and interindi- vidual variability of the retinal nerve fiber layer thickness.
J Glaucoma 2010;19:158-66.
14. Leung CK, Ye C, Weinreb RN, et al. Retinal nerve fiber layer imaging with spectral-domain optical coherence to- mography a study on diagnostic agreement with Heidelberg Retinal Tomograph. Ophthalmology 2010;117:267-74.