DOI : 10.3341/jkos.2007.48.8.1096-1105
녹내장은 진행성의 시신경병증으로, 시야 결손을 일 으켜 적절히 치료 되지 않을 시 비가역적인 시력 감소 를 가져오는 질환이다.1 녹내장을 진단하는 데는 시신 경의 형태학적인 분석과 동시에 시야 결손의 기능적인 분석이 필요하다.
이와 같은 비가역적인 특성 때문에 형태학적, 기능적 으로 녹내장을 조기 진단하기 위한 많은 노력이 있어 왔으며, 그 중 Frequency doubling technology perimeter (FDP)가 녹내장을 기능적으로 조기 진단 하는데 유용함이 대두되고 있다. FDP는 빈도배가환영 (Frequency doubling illusion)을 이용한 것으로, 녹내장 조기 손상에 민감한 망막의 큰세포신경절세포 (magnocellular ganglion cell; My cell)을 선택 적으로 분석할 수 있다고 알려졌다. 표준자동시야측정 계(Standard automated perimetry; SAP)는 망
막 신경절세포가 30% 이상 손상된 후에 비로소 이상 소견이 나타나므로, FDP는 SAP에 정상으로 나오나 시신경 형태적으로 녹내장이 의심되는 상태, 즉 녹내장 의증(pre-perimetric glaucoma)을 진단하는데 있 어 유용하게 사용될 수 있으며, 실제로 후향적인 연구 에서 FDP가 SAP에 선행하여 이상 소견을 보인다는 보고들이 있었다.2,3
그러나 실제 임상에 있어 FDP를 사용하는데 있어서는 녹내장의 낮은 유병율로 인해, 진단 특이성(Diagnostic specificity)이 낮아, 환자에게 적용 및 해석하는데 어 려움이 있다.
본 연구에서는 FDP가 SAP에 비하여 녹내장 의증 을 진단하는데 있어 유용한지, 유용하다면 어떤 지표 및 어떤 cutoff value에서 진단도구로서 유용한지 알 아보았다. 또한 녹내장(perimetric glaucoma)을 진 단하는 데 있어, FDP의 어떤 지표 및 어떤 cutoff value를 이용하여 SAP 을 대체할 수 있을 지에 대하 여 알아보았다.
대상과 방법
본원 안과 외래 녹내장 클리닉에 내원한 환자 113명 중 160안을 대상으로 하였으며 후향적으로 관찰하였 다. 모든 환자에게 시력검사, 굴절 검사, 세극등 검사,
주파수 배가 시야검사계를 사용한 녹내장 및 녹내장 의증의 진단
최진아․박찬기
가톨릭대학교 의과대학 안과 및 시과학교실
목적 : Frequency doubling technology perimeter (FDP)를 조기진단도구로 활용할 때 실제 적용가능한 지표 를 알아보고자 하였다.
대상과 방법 : 정상안 65안, 녹내장 의증안(pre-perimetric glaucoma) 58안, 녹내장안(perimetric glaucoma) 37안을 대상으로, 정상안과 녹내장 의증안에 대해 FDP, SAP, OCT의 진단 유용성을 알아본 후, FDP 각 지표의 판 별력을 비교하였다. 한편, 정상+녹내장 의증안과 녹내장안에 대해 상기 방법으로 비교하였다.
결과 : 정상안과 녹내장 의증안의 비교에서 FDP-PSD가 AUC 0.745 (cutoff : 3.17dB)로 높았으며, PSD을 Anderson criteria로 분류할 때 Hit ratio 0.73로 판별력이 가장 높았다. 한편 정상+녹내장 의증안과 녹내장안의 비교에서 SAP-PSD가 AUC 0.971 (cutoff : 2.92dB)로 높았으며, FDP PSD 1% 기준에서 Hit ratio 0.81로 높은 판별력을 보였다.
결론 : FDP-PSD를 Anderson criteria로 분류할 때 조기진단도구로서 유용하며, PSD 1% 기준에서 녹내장 진단에
도움되리라 사료된다.
<한안지 48(8):1096-1105, 2007>
<접수일 : 2006년 9월 19일, 심사통과일 : 2007년 5월 8일>
통신저자 : 박 찬 기
서울시 서초구 반포동 505 가톨릭대학교 강남성모병원 안과 Tel: 02-590-2760, Fax: 02-533-6718 E-mail: [email protected]
* 본 논문의 요지는 2006년 대한안과학회 제96회 추계학술대회 에서 구연으로 발표되었음.
안압 검사, 전방각 검사, 안저 검사를 시행하였고, Humphrey standard automated perimetry (Allergan Humphrey Ins. U.S.A) central 24-2 및 FDP (Humphrey Matrix 30-2, USA), Optical Coherence tomograph (OCT) 3.0 (Zeiss-Humphrey Ophthalmic Systems, Dublin California, USA) 을 이용하여 시신경 유두 분석과 시신경 두께 분석을 시행하였다. 검사에 영향을 미칠 수 있는 다른 안질환 및 뇌 질환이 없는 환자를 대상으로 하였다.
정상안은 다른 안과적 질환과 녹내장의 가족력이 없 고, 녹내장성 시신경 유두의 변화를 보이지 않으며 시 야 검사에서도 녹내장성 시야 결손이 없고 안압을 측정 한 중에 한번도 21 mmHg를 넘지 않는 경우로 정의하 였다. 녹내장 의증안은 시야 손상이 없으면서 안압이 22 mmHg이상이거나 시신경 유두의 녹내장성 변화, 즉 비대칭적 시신경 유두 함몰(양안의 유두함몰비 차이 가 0.2 이상) 혹은 증가된 유두 함몰(수직 유두함몰비
>0.6)이 있는 고안압증이나 녹내장안의 반대안, 녹내장 의 가족력이 있는 경우가 포함되었다. 녹내장안은 안압 과 관계없이 녹내장성 시야 손상과 시신경 유두변화 혹 은 시신경 섬유층의 손상이 있는 경우를 대상으로 하였 다. 녹내장성 시야 손상은 Anderson criteria를 만족시 키거나, Corrected Pattern Standard Deviation (CPSD)가 5%미만에서 나타나거나 Glaucoma hemifield test (GHT)상 이상 소견(Outside normal limit) 이 나타나는 경우로 정의하였다.
SAP 지표 중 mean deviation (MD)와 pattern standard deviation (PSD) 및 CPSD을 구하였고, 안과 전문의의 검안경 검사로 측정한 수직 및 수평유두 함몰비를 구하였다.
또한 대상안 모두에서 FDP (Humphrey Matrix 30-2, USA)을 이용하여 MD, PSD 및 GHT를 구하 고, Anderson criteria 및 MD, PSD의 1%, 5% 지 점에서 FDP를 분류하였다. Anderson criteria는 FDP mode에 따라서 판별 기준을 변환하게 되나 본 연구에서는 궁상 영역에서 정상의 5% 미만의 연속된 3 개 이상의 점이 존재하거나, 1% 미만의 연속된 2개 이 상의 점이 존재하는 경우이며, 이 점들은 비측수평경선 (nasal horizontal meridian)에 아주 근접해 있지 않는 한 가장자리에 위치해 있어서는 안된다고 정의하였다.4
한편 OCT를 이용한 시신경 섬유층 두께 분석 방법 중 환자에게 화면에 나타나는 녹색광을 주시하기로 하 는 내부주시(internal fixation)의 방법을 택하였고, 효율성을 높이기 위해 fast RNFL (retinal nerve fiber layer) thickness protocol을 이용하였다.
시신경 섬유층 두께의 측정은 유두연 동심원(1.5배 유
두 크기)을 따라 이루어졌고, 12분(clock hour)된 각 시간대 별 자료가 구해졌으며 좌안은 우안의 거울상 (mirror image)으로 자료를 기록하였다. 시신경 유 두 분석의 9가지 지표 중 Kang and Park5의 연구에서 시야 검사와 높은 상관관계를 보인다고 알려진 시신경 유두 분석의 지표 중 HIRA (Horizontal integrated rim area), 시신경 섬유층 두께 분석의 지표 중 average thickness, 그 외 inferior average thickness (Iavg), vertical integrated rim width (VIRW), Cup/Disc vertical ratio (CDVR)를 구하였다.
우선 정상안(65안), 녹내장 의증안(58안), 녹내장안 (37안)의 3군 중, 정상안과 녹내장 의증 안에 대하여 이상의 SAP, FDP, 검안경 검사, OCT의 각 지표에 대 하여 녹내장을 판별할 수 있는 Receiver operating characteristic (ROC) curve 아래 면적을 알아보았 다. 또한 두 군에 대하여 FDP의 기준들 중 GHT, MD 1%, MD 5%, MD by Anderson criteria, PSD 1%, PSD 5%, PSD by Anderson criteria, 앞서 구한 PSD cutoff value (3.17)에 대하여 검사 양성을 1, 검사 음성을 0로 하였을 때 각 Hit ratio, chi-square, 민감도(sensitivity) 및 특이도(specificity), 위양성(false positive), 위음성(false negative)를 비교하여 보았다.
다음으로 정상안 및 녹내장 의증안을 한 군으로 삼고 (123안), 녹내장안(37안)을 다른 한 군으로 삼아 ROC curve 아래 면적을 구하고, FDP의 각 기준에 대하여 상기 비교를 실시하였다. 통계적 분석은 SPSS 12.0 프로그램을 이용하였으며, p value <0.05를 통계적으 로 의미 있다고 취급하였다.
결 과
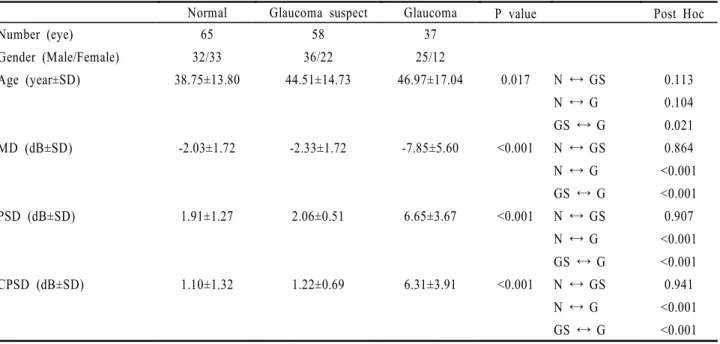
전체 160안에서 정상안은 남자 32안, 여자 33안으 로 65안이었고, 녹내장 의증안은 남자 36안, 여자 22 안으로 58안이었으며, 녹내장안은 남자 25안, 여자 12 안으로 총 37안이었다. 정상 대조군의 평균 연령은 38.75±13.80세, 녹내장 의증군은 44.51±14.73세, 녹내장군은 46.97±17.04세로, 정상군과 녹내장 의증 군, 정상군과 녹내장군 사이에서는 의미있는 차이를 보 이지 않았으나, 녹내장 의증군과 녹내장군 사이에서는 의미있는 차이를 보였다. 정상 대조군의 MD는 -2.03
±1.72dB, 녹내장 의증군에서는 -2.33±1.72dB, 녹 내장군에서는 -7.85±5.60dB 이었으며, 정상 대조군 의 PSD는 1.91±1.27db, 녹내장 의증군에서는 2.06
±0.51db, 녹내장군에서는 6.65±3.67db 이었고, 정 상 대조군의 CPSD는 1.10±1.32db, 녹내장 의증군
에서는 1.22±0.69db, 녹내장군에서는 6.31±3.91db 으로 이상 MD, PSD, CPSD 모두 정상 대조군과, 녹 내장군, 그리고 녹내장 의증군과 녹내장군 사이에는 유 의한 차이가 있었지만, 정상군과 녹내장 의증군 사이에 는 유의한 차이가 관찰되지 않았다(Table 1).
또한 검안경 검사로 측정한 수직유두함몰비(Vertical cup/disc ratio), 수평유두함몰비(Horizontal cup/disc ratio) 및 OCT의 각 지표, 즉 VIRW, HIRA, CDVR, Iavg, Average thickness와 FDP MD, PSD의 평균을 분산분석(ANOVA) 및 사후검정 (Scheffe)을 통해 비교하였을 때 녹내장 의증군과 녹 내장군 사이의 VIRW, 녹내장 의증군과 녹내장군 사이 의 검안경 검사로 측정한 CDHR을 제외한 나머지 모 든 비교에서 각 군 사이에 유의한 차이를 보였다 (Table 2).
먼저 정상안과 녹내장 의증안의 비교에서, 검사 양성 을 1, 검사 음성을 0로 하였을 때 ROC curve 아래 면 적을 구하면(Fig. 1), FDP 지표 중 PSD가 0.745 (민감도 : 75.90%, 특이도 : 63.10%; cutoff 3.17) 으로 가장 판별력이 높았고, 그 외 SAP의 지표들의 판 별력은 이에 비해 떨어지는 양상을 보였다(Table 3).
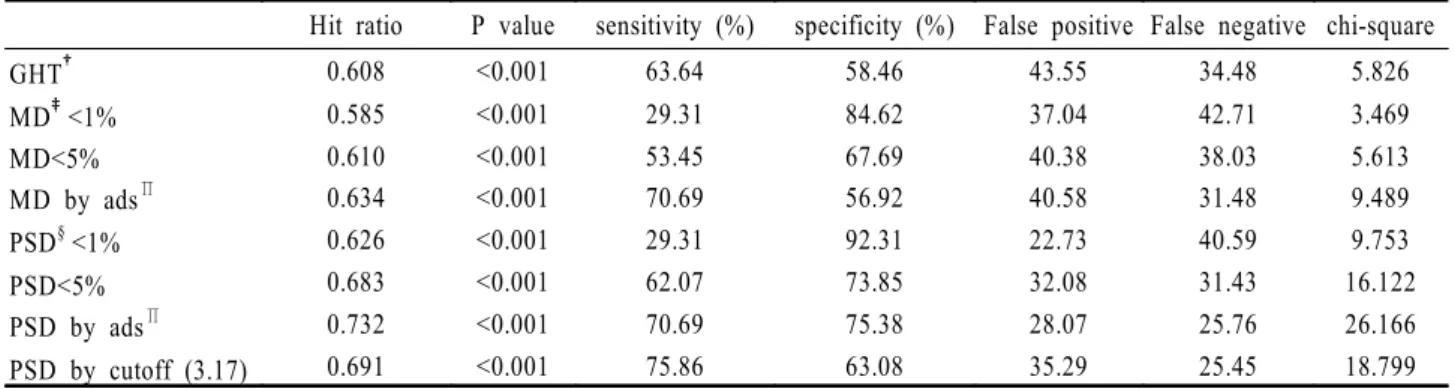
다음으로 Pearson chi-square test에 의하여 FDP의 각 지표, 즉 GHT, MD 1%, MD 5%, MD by Anderson criteria, PSD 1%, PSD 5%, PSD
by Anderson criteria 등의 판별력을 비교하였을 때 PSD Anderson criteria에 의해 FDP를 분류했 을 때 Hit ratio 0.732, chi-square 26.166 (p<0.001), 민감도 70.69%, 특이도 75.38%로 가장 유용했고, 다음으로 PSD cutoff 3.17db을 기준으로 하였을 때가 Hit ratio 69.11%, chi-square 18.799 (p=0.001), 민감도 75.86%, 특이도 63.08%로 유 용했으며, 다음으로 PSD 5%를 기준으로 하였을 때 Hit ratio 0.683, chi-square 16.122 (p<0.001), 민감도 62.07%, 특이도 73.85%로 뒤를 이었다. 그 외 GHT나 MD 1%, MD 5%, MD by Anderson criteria는 PSD 지표들에 비하여 판별력이 떨어졌다 (Table 5).
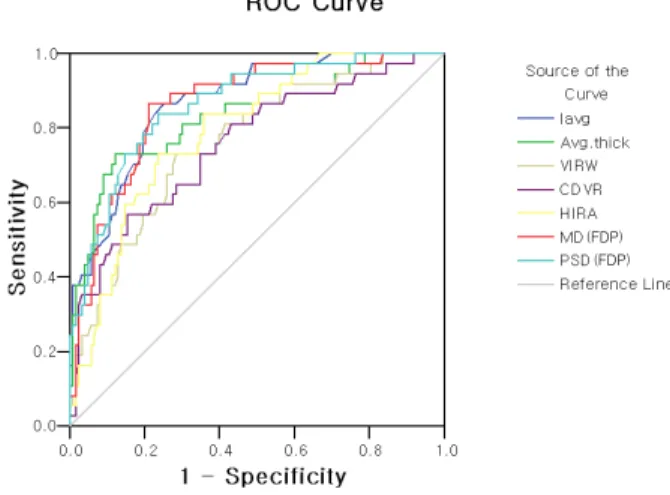
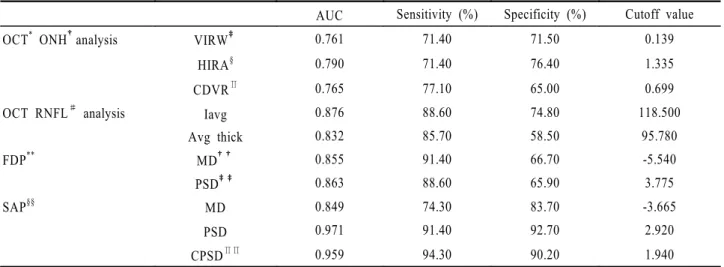
상기 방법에 의하여 정상안과 녹내장 의증안을 한 군 으로 하고, 녹내장 안을 다른 한 군으로 한 비교에서 검 사 양성을 1, 검사 음성을 0로 하였을 때 ROC curve 아래 면적을 구하면(Fig. 2), SAP의 지표 중 PSD가 0.971 (민감도 : 91.40%, 특이도 : 92.70%)으로 가 장 높았고, 다음으로 CPSD가 0.959 (민감도 : 94.30%, 특이도 : 90.20%)로 뒤를 이었고, 이어 OCT 지표 중 Iavg가 0.876 (민감도 : 88.60%, 특이 도 : 74.80%), 다음으로 FDP PSD가 0.863 (민감 도 : 88.60%, 특이도 : 65.90%)으로 높은 판별력을 보였다(Table 4).
Table 1. Patient characteristics and MD*, PSD†, CPSD‡in normal (N), glaucoma suspect (GS), glaucoma (G) group (N=160)
Normal Glaucoma suspect Glaucoma P value Post Hoc
Number (eye) 65 58 37
Gender (Male/Female) 32/33 36/22 25/12
Age (year±SD) 38.75±13.80 44.51±14.73 46.97±17.04 0.017 N ↔ GS
N ↔ G GS ↔ G
0.113 0.104 0.021
MD (dB±SD) -2.03±1.72 -2.33±1.72 -7.85±5.60 <0.001 N ↔ GS
N ↔ G GS ↔ G
0.864
<0.001
<0.001
PSD (dB±SD) 1.91±1.27 2.06±0.51 6.65±3.67 <0.001 N ↔ GS
N ↔ G GS ↔ G
0.907
<0.001
<0.001
CPSD (dB±SD) 1.10±1.32 1.22±0.69 6.31±3.91 <0.001 N ↔ GS
N ↔ G GS ↔ G
0.941
<0.001
<0.001 MD*: mean deviation.
PSD†: pattern standard deviation.
CPSD‡: corrected pattern standard deviation.
Statistical significance was tested by analysis of varience (ANOVA), and post Hoc test was done by Scheffe method.
다음으로 Pearson chi-square test에 의하여 FDP의 각 지표, 즉 GHT, MD 1%, MD 5%, MD by Anderson criteria, PSD 1%, PSD 5%, PSD by Anderson criteria의 판별력을 비교하였을 때 PSD 1% 기준에서 Hit ratio 0.813, chi-square 47.932 (p<0.001), 민감도 78.38%, 특이도 82.11%
으로 가장 유용했고, 다음으로 MD 1% 기준에서 Hit ratio 0.781, chi-square 39.809 (p<0.001), 민감 도 78.38%, 특이도78.05%로 높았으며, PSD cutoff 3.78db 기준에서 Hit ratio 0.713, chi-square 34.606 (p<0.001), 민감도 89.19%, 특이도 65.85%
로 높은 판별력을 보였다(Table 6).
고 찰
녹내장의 조기 진단이 중요성이 대두되고 있으며, 그 노력은 시신경의 형태적인 측면과 동시에 기능적인 측 면으로 이루어 진다. 형태적으로 조기 진단하는 방법으 로, 검안경 검사에 의해 시신경 유두를 관찰하는 전통 적인 방법이 판별력이 우수하고 경제적인 면에서도 유 리하다. 검안경 검사를 통해 시신경유두함몰, Laminar dot sign, 시신경 유두테의 패임(notching), 시신 경 유두 소와(optic pit), 시신경 유두 주위 위축 (peripapillary atrophy), 함몰 없는 국소 창백 (overpass cupping), 돼지 꼬리 모양의 유두 혈관 (vascular loop) 등 녹내장의 시신경 변화를 종합적 으로 관찰할 수 있어 매우 유리하나, 검사자 간의 다양 성이 존재하여, 결과를 정량화, 표준화하는데 어려움 이 있다. 그 외 하이델베르그 시신경 유두 분석기 (Heidelberg retina tomography), OCT 등이 형
태적 측면의 조기 진단에 유용하다고 알려졌고, 이에 대한 많은 연구가 이루어졌다.6
한편 기능적 측면으로는 FDP 및 Short wavelength automated perimetry (SWAP) 이 조기 진단에 유 용하다고 알려져 있다.3 전체 시신경절세포의 15%를 차지하는 큰세포경로(magnocellular pathway;My cell)의 활동을 빈도배가환영에 의해 선택적으로 분석 할 수 있는데, 이는 My cell이 낮은 공간 빈도(low spatial frequency)와 높은 시간 빈도(high temporal frequency)의 자극에 민감하기 때문이다.7-12 My cell은 작은세포경로(parvocellular pathway)를 이 루는 시신경절에 비해 크기가 크고, 드물게 분포하므로 상대적으로 크기가 작고 겹쳐서 분포하는 작은세포경로 에 비해 안압 등의 자극에 더욱 예민하다.13,14 반면 청 색 자극에 반응하는 koniocellular pathway 역시 큰 시신경절로 이루어졌고, 드물게 분포하므로 안압 등 에 의해 조기에 손상된다고 알려져 있어 SWAP에서 이용된다.
FDP는 SAP에 비하여 시간, 경제적으로 유리하고, 휴대가 비교적 간편하며, 홍채 크기나 굴절 이상에 비 교적 구애 받지 않고 사용 가능하여 녹내장의 조기 진 단 도구로서 임상적으로 사용이 증가되고 있다.
Bayer and Erb3은 초기 SAP에서 시야 결손을 보 였던 환자들을 코호트 연구한 결과 FDP가 SAP에 비 해 12개월에서 24개월 먼저 시야 결손을 예측한다고 보고하였으며, Medeiros et al2은 초기 SAP은 정상 소견을 보였던 환자에서 FDP가 녹내장 위험군에서 SAP의 시야 결손을 예측할 수 있다고 보고하였다.
이처럼 녹내장 의증(pre-perimetric glaucoma)을 진단하는데 유용한 FDP을 실제 임상에서 사용하였 Figure 1. ROC (receiver operator characteristic) curve of the
discriminant formula. (Between glaucoma suspect and normal)
Figure 2. ROC (receiver operator characteristic) curve of the discriminant formula. (Between ‘glaucoma’ and ‘or not’)
(FDP) (FDP) (SAP) (SAP) (SAP)
(FDP) (FDP)
을 때는 가 양성(false positive)이 실제 양성(true positive) 보다 훨씬 많은 것으로 보이는데 이는 녹내 장 유병율이 전체 인구의 1% 만 차지하고 있기 때문이 다.15 따라서 이와 같은 FDP의 낮은 진단 특이성 (Specificity)을 극복하기 위하여 FDP를 반복 시행 하는 방법, 여러 종류의 FDP를 시도해 보는 방법, GDx 등 다른 종류의 진단 도구와 겸용하는 방법 등이
다양하게 시도 되고 있다.16-19 본 연구에서는 FDP를 해석하는 기준을 제시함으로서 진단 유용성을 높이고자 하였다.
현재 상업적으로 사용되는 FDP N 24-2와 Matrix 30-2중, Humphrey Matrix 30-2는 FDP의 최신 버 전으로 target이 N 24-2보다 작고 많으며, SAP과 비슷 한 형태의 배열로 되어 있어 본 연구에서 채택하였다.4 Table 2. Comparison of mean value between normal (N), glaucoma suspect (GS) and glaucomata (G) group using FDP*, OCT† ONH‡& RNFL§ analysis and ophthalmoscopic exam
Normal Glaucoma suspect Glaucoma P value Post Hoc
OCT ONH analysis
VIRW∏ 0.27±0.21 0.16±0.07 0.11±0.07 <0.001 N ↔ GS
N ↔ G GS ↔ G
<0.001
<0.001 0.322
HIRA# 1.59±0.27 1.41±0.26 1.22±0.23 <0.001 N ↔ GS
N ↔ G GS ↔ G
0.001
<0.001 0.002 C/D
vert.ratio
0.62±0.10 0.70±0.09 0.76±0.11 <0.001 N ↔ GS
N ↔ G GS ↔ G
<0.001
<0.001 0.026 OCT RNFL
analysis
Iavg 138.98±19.36 122.45±21.44 90.14±29.20 <0.001 N ↔ GS N ↔ G GS ↔ G
0.005
<0.001
<0.001 Average 101.13±12.11 93.64±12.69 74.71±19.07 <0.001 N ↔ GS
N ↔ G GS ↔ G
0.016
<0.001
<0.001
FDP MD** -3.74±3.73 -6.09±5.39 -12.43±5.61 <0.001 N ↔ GS
N ↔ G GS ↔ G
0.030
<0.001
<0.001
PSD†† 3.18±0.86 4.04±1.16 5.95±2.10 <0.001 N ↔ GS
N ↔ G GS ↔ G
0.002
<0.001
<0.001 Opthalmo
exam
C/D hoz.ratio
0.47±0.15 0.62±0.13 0.70±0.14 <0.001 N ↔ GS
N ↔ G GS ↔ G
<0.001
<0.001 0.104 C/D
vert.ratio
0.47±0.14 0.62±0.11 0.72±0.13 <0.001 N ↔ GS
N ↔ G GS ↔ G
<0.001
<0.001 0.001 FDP*: frequency doubling technology perimeter. OCT†: optical coherence tomography.
ONH‡: optic nerve head. RNFL§: retinal nerve fiber layer.
VIRW∏: vertical integrated rim volume (mm3), HIRA#: horizontal integrated rim area (mm2).
MD**: mean deviation. PSD††: pattern standard deviation.
Statistical significance was tested by analysis of varience (ANOVA), and post Hoc test was done by Scheffe method.
FDP를 임상적으로 해석, 적용하는데, 여러 기준들 이 제시되고 있는데, 그 중에는 Humphrey Matrix
30-2의 기준들, 즉 GHT, MD, PSD 및 Anderson criteria 등이 있다.20-27
Table 4. Area under the receiver operating characteristic curve (AUC), sensitivity, specificity by each parameters between
‘glaucoma’ and ‘or not’
AUC Sensitivity (%) Specificity (%) Cutoff value
OCT* ONH†analysis VIRW‡ 0.761 71.40 71.50 0.139
HIRA§ 0.790 71.40 76.40 1.335
CDVR∏ 0.765 77.10 65.00 0.699
OCT RNFL# analysis Iavg 0.876 88.60 74.80 118.500
Avg thick 0.832 85.70 58.50 95.780
FDP** MD†† 0.855 91.40 66.70 -5.540
PSD‡‡ 0.863 88.60 65.90 3.775
SAP§§ MD 0.849 74.30 83.70 -3.665
PSD 0.971 91.40 92.70 2.920
CPSD∏∏ 0.959 94.30 90.20 1.940
OCT*: optical coherence tomography. ONH†: optic nerve head.
VIRW‡: vertical integrated rim volume. HIRA§: horizontal integrated rim area.
CDVR∏: cup/disc vertical ratio. RNFL#: retinal nerve fiber layer.
FDP**: frequency doubling technology perimeter. MD††: mean deviation.
PSD‡‡: pattern standard deviation. SAP§§: standard automated perimetry.
CPSD∏∏: corrected pattern standard deviation.
Table 3. Area under the receiver operating characteristic curve (AUC), sensitivity, specificity by each parameters between glaucoma suspect and normal group
AUC Sensitivity (%) Specificity (%) Cutoff value
OCT* ONH†analysis VIRW‡ 0.727 75.90 63.10 0.205
HIRA§ 0.675 67.20 52.30 1.545
CDVR∏ 0.714 74.10 63.10 0.648
OCT RNFL# analysis Iavg 0.700 67.20 40.00 134.500
Avg thick 0.680 67.20 40.00 99.320
FDP** MD†† 0.620 67.20 49.20 -3.450
PSD‡‡ 0.745 75.90 63.10 3.170
SAP§§ MD 0.556 62.10 50.80 -2.160
PSD 0.660 74.10 53.80 1.730
CPSD∏∏ 0.600 56.90 60.00 1.190
OCT*: optical coherence tomography. ONH†: optic nerve head.
VIRW‡: vertical integrated rim volume. HIRA§: horizontal integrated rim area.
CDVR∏: cup/disc vertical ratio. RNFL#: retinal nerve fiber layer.
FDP** : frequency doubling technology perimeter. MD††: mean deviation.
PSD‡‡: pattern standard deviation. SAP§§ : standard automated perimetry.
CPSD∏∏: corrected pattern standard deviation.
정상안과 녹내장 의증안의 비교에서, 모든 환자에게 조기 손상을 찾아내기 위하여 검안경 검사, OCT, FDP, SAP을 실시하고 그 판별력을 알아보았을 때 (Table 3), FDP의 PSD가 AUC 0.745 (민감도 : 75.90%, 특이도 : 63.10%)로 높은 판별력을 보였다.
이에 비하여 SAP의 PSD, CPSD에 의한 판별력은 낮 았다. 이는 녹내장 의증(Pre-perimetric glaucoma) 의 진단에 있어, FDP의 PSD 지표가 유용하게 사용될 수 있음을 의미한다.
그렇다면 FDP의 각 지표들 중 어떤 값을 통하여 정 상안과 녹내장 의증안을 가장 잘 판별할 수 있는지 알 아보았을 때(Table 5), PSD를 Anderson criteria 를 통해 분류했을 때 Hit ratio 0.731로 매우 우수한 판별력을 보였다.
다음으로 PSD cutoff value 3.17db를 기준으로 하였을 때 판별력이 Hit ratio 0.691로 높았으며, 그 다음으로 PSD 5% 였다. 그 외 MD 5%, MD 1%, MD by Anderson criteria, GHT에 의한 판별력은
이 보다 낮았다. 이는 FDP를 임상적으로 해석, 적용함에 있어, 다른 기준들보다 PSD에 Anderson criteria 를 적용하였을 때 녹내장 의증(Pre-perimetric glaucoma)를 진단하는데 가장 유용함을 의미한다.
Brusini et al4은 FDP C-20, N-30으로 glaucoma screening 을 실시하여, 적어도 1개 이상의 p<5% 인 점이 존재할 때 녹내장을 진단하는데 가장 높은 판별력 을 보였다고 하였으며, Paolos et al28은 Matrix 30-2 test에 대하여 PSD 5% 미만일 때, GHT이 outside normal 일 때, 또는 PDP map에서 P value 5% 이하의 점이 2개 이상 연달아 있을 때의 3 가지 기준 중 적어도 한가지 이상이 있을 때를 FDP 비 정상이라고 정의 하였다. 본 연구는 이러한 맥락을 이 어 Anderson criteria에 의하여 FDP-PSD를 분류 함으로써 시야 검사 전 녹내장을 진단하는 보다 구체적 기준을 제시한 것이다. 그러나 본 연구의 PSD cutoff value 3.17db은 환자의 수, 녹내장의 진단 기준 등 연 구의 설계에 따라서 가변적일 수 있다.
Table 5. Comparisons of FDP* by Pearson chi-square between glaucoma suspect and normal
Hit ratio P value sensitivity (%) specificity (%) False positive False negative chi-square
GHT† 0.608 <0.001 63.64 58.46 43.55 34.48 5.826
MD‡<1% 0.585 <0.001 29.31 84.62 37.04 42.71 3.469
MD<5% 0.610 <0.001 53.45 67.69 40.38 38.03 5.613
MD by ads∏ 0.634 <0.001 70.69 56.92 40.58 31.48 9.489
PSD§<1% 0.626 <0.001 29.31 92.31 22.73 40.59 9.753
PSD<5% 0.683 <0.001 62.07 73.85 32.08 31.43 16.122
PSD by ads∏ 0.732 <0.001 70.69 75.38 28.07 25.76 26.166
PSD by cutoff (3.17) 0.691 <0.001 75.86 63.08 35.29 25.45 18.799
FDP*: frequency doubling technology perimeter. GHT†: glaucoma hemifield test.
MD‡: mean deviation. PSD§: pattern standard deviation.
ads∏: Anderson criteria.
Table 6. Comparison of FDP* by Pearson chi-square between ‘glaucoma’ and ‘or not’
Hit ratio P value Sensitivity (%) Specificity (%) False positive False negative chi-square
GHT† 0.592 <0.001 94.59 48.33 63.92 3.33 22.072
MD‡<1% 0.781 <0.001 78.38 78.05 48.21 7.69 39.809
MD<5% 0.656 <0.001 91.89 57.72 60.47 4.05 28.166
MD by ads∏ 0.563 <0.001 97.30 43.70 65.71 1.82 21.402
PSD§<1% 0.813 <0.001 78.38 82.11 43.14 7.34 47.932
PSD<5% 0.650 <0.001 91.89 56.91 60.92 4.11 27.307
PSD by ads∏ 0.625 <0.001 91.89 53.66 62.64 4.35 24.061
PSD by cutoff (3.78) 0.713 <0.001 89.19 65.85 56.00 4.71 34.606
FDP*: frequency doubling technology perimeter. GHT†: glaucoma hemifield test.
MD‡: mean deviation. PSD§ : pattern standard deviation.
ads∏: Anderson criteria.
한편 정상안과 녹내장 의증안을 한 군으로, 녹내장 안을 다른 한 군으로 한 비교에서(Table 4) SAP-PSD 가 AUC 0.971 (sensitivity 91.40%, specificity : 92.70%)으로 높은 판별력을 보였고, 이에 이어 SAP-CPSD (AUC 0.959), OCT-Iavg (AUC 0.876) 순이었고, 다음으로 FDP-PSD (AUC 0.863)가 뒤를 이었다(Table 4).
OCT 지표들 중에서는 Iavg, Avg thickness가 각 AUC 0.876, 0.832로 높은 판별력을 보였는데, 이는 Kang and Park5의 연구 결과와 일치한다. 또한 녹내 장을 진단함에 있어, SAP이 절대적 기준이지만, 그 외 FDP나 OCT의 Iavg, Avg thickness 또한 유용하 게 사용될 수 있음을 의미한다.
Medeiros et al29의 연구에서는 Glaucoma의 진 행 정도를 시신경테 패임(neuronal rim loss)에 따 라 단계를 구분하여, FDP와 SAP의 PSD에 대하여 ROC curve를 통해 비교한 결과, 10%, 30%의 시신 경테 패임, 즉 초기 녹내장에서는 FDP가 SAP에 비하 여 판별력이 우수하였고, 50%, 70%의 시신경테 패임, 즉 후기 녹내장에서 역시 FDP가 SAP에 비하여 판별 력이 우수한 결과를 보였다. 초기 녹내장에서 FDP의 판별력이 우수함에 있어서는 본 연구와 일치하지만, 진 행된 녹내장에서는 본 연구와 상반된 결과를 보인다.
한편 FDP의 각 판별 기준에 대하여 정상안 및 녹내 장 의증안을 한 군으로, 녹내장 안을 다른 한 군으로 한 비교에서(Table 6) PSD 1%를 기준으로 하였을 때의 판별력이 Hit ratio 0.813으로 월등히 높았으며, 다음 으로 MD 1%가 Hit ratio 0.781으로 뒤를 이었다.
이는 FDP를 일반 건강 검진을 목적으로 실시하였을 때 SAP을 실시하기 전 PSD 1% 기준에서 녹내장 (Perimetric glaucoma)을 진단하는 데 유용할 것으 로 사료된다.
결론적으로, 녹내장 의증(Pre-perimetric glaucoma) 을 진단하는데 있어서는 FDP의 PSD map을 Anderson criteria에 의해 분류했을 때 판별력이 가장 우수하 였고, FDP를 사용하여 녹내장(Perimetric glaucoma) 을 진단할 때는 global index 인 PSD 1% 미만을 기 준으로 하는 것이 더 정확하여 임상에서 사용할 수 있 을 것으로 사료된다.
참고문헌
1) Rand A, Karim D, Sharon F, et al. Shield’s Textbook of Glaucoma, 5th ed. Baltimore: Willians & Wilkins, 2005;1-2 2) Medeiros FA, Sample PA, Weinreb RN. Frequency doubling
technology perimetry abnormalities as predictors of glaucomatous visual field loss. Am J Ophthalmol 2004;137:863-71.
3) Bayer AU, Erb C. Short wavelength automated perimetry, frequency doubling technology perimetry and pattern electroretinography for prediction of progressive glaucomatous standard visual field defect. Ophthalmology 2002;109:1009-17.
4) Brusini P, Salvetat ML, Zeppieri M, Parisi L. Frequency doubling technology perimetry with the Humphrey matrix 30-2 test. J Glaucoma 2006;15:77-83.
5) Kang KD, Park CK. Comparison of diagnostic precision between preprogramed indicator and newly calculated indicator in optical coherence tomography. J Korean Ophthalmol Soc 2006;47:243-52.
6) Sim JO, Park CK. Optic nerve head analysis obtained by optical coherence tomography for the diagnosis of glaucoma in Koreans. J Korean Ophthalmol Soc 2004;45:1885-93.
7) Cello KE, Nelson-Quigg JM, Johnson CA. Frequency doubling technology perimetry for detection of glaucomatous visual field loss. Am J Ophthalmol 2000;129:314-22.
8) Glovinsky Y, Quigley HA, Dunkelberger GR. Retinal ganglion cell loss is size dependent in experimental glaucoma. Invest Ophthalmol Vis Sci 1991;32:484-91.
9) Kaplan E, Sharpley RM. The primate retina contains two types of ganglion cells, with high and low contrast sensitivity. Proc Natl Acad Sci U S A 1986;83:2755-7.
10) Silverman SE, Trick GI, Hart WM. Motion perception is abnormal in primary open-angle glaucoma and ocular hypertension. Invest Ophthalmol Vis Sci 1990;31:722-9.
11) Kelly DH. Nonlinear visual responses to flickering sinusoidal gratings. J Opt Soc Am 1981;71:1051-5.
12) Anderson AJ, Johnson CA. Mechanisms isolated by frequency doubling technology perimetry. Invest Ophthalmol Vis Sci 2002;43:398-401.
13) Morgan JE. Selective cell death in glaucoma : does it really occur? Br J Ophthalmol 1994;78:875-9.
14) Anderson AJ, Johnson CA. Frequency-doubling technology perimetry. Ophthalmol Clin North Am 2003;16:213-25.
15) Khong JJ, Dimitrov PM. Can the specificity of the FDT for glaucoma be improved by confirming abnormal results? J Glaucoma 2001;10:199-202.
16) Ra H, Park CK. Glaucoma discrimination by combined use of frequency doubling technology and Heidelberg retina tomography II. J Korean Ophthalmol Soc 2005;46:306-15.
17) Wolfs RC, Borger PH, Ramrattan RS, et al. Changing views on open-angle glaucoma: definitions and prevalences. Invest Ophthalmol Vis Sci 2000;41:3309-21.
18) Mastropasqua L, Brusini P, Carpineto P, et al. Humphrey matrix frequency doubling technology perimetry and optical coherence tomography measurement of the retinal nerve fiber layer thickness in both normal and ocular hypertensive subjects. J Glaucoma 2006;15:328-35.
19) Brusini P. Frequency doubling technology staging system 2. J Glaucoma 2006;15:315-20.
20) Chauhan BC, Johnson CA. Test-retest variability of frequency doubling perimetry and conventional perimetry in glaucoma
patients and normal subjects. Invest Ophthalmol Vis Sci 1999;40:648-56.
21) Johnson CA, Samuels SJ. Screening for glaucomatous visual field loss with frequency-doubling perimetry. Invest Ophthalmol Vis Sci 1997;38:413-25.
22) Trible JR, Schultz RO, Tobinson JC, et al. Accuracy of glaucoma detection with frequency-doubling perimetry. Am J Ophthalmol 2003;110:1903-8.
23) Heeg GP, Jansonius NM. Influence of test reliability on the screening performance of frequency-doubling perimetry. Am J Ophthalmol 2006;141:585-7.
24) Heeg GP, Stouterbeer R, Jamsonius NM. Strategies for improving the diagnostic specificity of the frequency doubling perimeter. Acta Ophthalmol Scand 2005;83:53-6.
25) Horn FK, Wakili N, Unemann AM, et al. Testing for glaucoma with frequency-doubling perimetry in normals, ocular hypertensive, and glaucoma patients. Graefes Arch Clin Exp Ophthalmol 2003;240:658-65.
26) Gardiner SK, Anderson DR, Fingeret M, et al. Evaluation of decision rules for frequency-doubling technology screening tests. Optom Vis Sci 2006;83:432-7.
27) Pierre-Filho Pde T, Schimiti RB, de Vasconcellos JP, Costa VP. Sensitivity and specificity of frequency-doubling technology, tendency-oriented perimetry, SITA Standard and SITA Fast perimetry in perimetrically inexperienced individuals. Acta Ophthalmol Scand 2006;84:345-50.
28) Paolos F, Fabio M, Luca R, Nicola O. Detecting glaucoma with frequency-doubling technology perimetry. J Glaucoma 2005;14:485-91.
29) Medeiros FA, Sample PA, Zangwill LM, et al. A statistical approach to the evaluation of covariate effects on the receiver operating characteristic curves of diagnostic tests in glaucoma.
Invest Ophthalmol Vis Sci 2006;47:2520-7.
=ABSTRACT=
Interpretation of Frequency Doubling Technology Perimeter in Diagnosis of Glaucoma and Glaucoma Suspect
Jin A Choi, M.D., Chan Kee Park, M.D.
Department of Ophthalmology, College of Medicine, The Catholic University of Korea, Seoul, Korea
Purpose: To find applicable parameters of the frequency doubling technology perimeter (FDP), which is known to be useful in detecting early visual field loss.
Methods: The subjects were 65 eyes of normal individuals, 58 eyes of glaucoma suspects, and 37 eyes of glaucoma patients. FDP (MD, PSD), SAP (MD, PSD, CPSD), and 5 parameters of OCT were analyzed. The receiver operating characteristic (ROC) curve, sensitivity, and specificity of each parameter were evaluated, and the comparison of FDP parameters by Pearson's chi-square was made between the glaucoma suspect group and the normal group. The same comparison was made among the normal+glaucoma suspect and glaucoma group.
Results: In discriminating between the normal and glaucoma suspect groups, the FDP-PSD revealed an AUC of 0.745 (cutoff: 3.17dB), which was significantly larger than that of SAP-PSD with an AUC of 0.660 (cutoff:
1.73dB). In comparing FDP, PSD by Anderson criteria was most reliable with a hit ratio of 0.732. On the other hand, in discriminating among the normal+glaucoma suspect group and glaucoma group, the SAP-PSD showed an AUC 0.971 (cutoff: 2.92dB), much larger than the FDP-PSD with an AUC of 0.863 (cutoff:
3.78dB). In addition, in comparing the parameters of FDP by Pearson chi-square, PSD 1% was the most reliable with a hit ratio of 0.813.
Conclusions: FDP is a valuable screening tool in detecting early visual field loss. PSD by Anderson criteria can be a reliable parameter for the diagnosis of pre-perimetric glaucoma, and PSD 1% can be used in the discrimination of perimetric glaucoma.
J Korean Ophthalmol Soc 48(8):1096-1105, 2007
Key Words: FDP, Anderson criteria, Frequency doubling technology, Preperimetric glaucoma, PSD
Address reprint requests to Chan Kee Park, M.D.
Department of Ophthalmology, Gangnam St. Mary's Hospital, College of Medicine, The Catholic University
#505 Banpo-dong, Seocho-gu, Seoul 137-040, Korea
Tel: 82-2-590-2760, Fax: 82-2-533-6718, E-mail: [email protected]