© 2019 The Korean Ophthalmological Society
This is an Open Access article distributed under the terms of the Creative Commons Attribution Non-Commercial License (http://creativecommons.org/licenses /by-nc/3.0/) which permits unrestricted non-commercial use, distribution, and reproduction in any medium, provided the original work is properly cited.
Original Article
Influence of Epiretinal Membranes on the Retinal Nerve Fiber Layer Thickness Measured by Spectral Domain Optical Coherence
Tomography in Glaucoma
Ju Mi Kim, Kyoung Nam Kim, Woo-Jin Kim, Chang-sik Kim
Department of Ophthalmology, Chungnam National University College of Medicine, Daejeon, Korea
Purpose: We investigated changes in the thickness of the peripapillary retinal nerve fiber layer (RNFL) following the onset of an epiretinal membrane (ERM) in glaucoma patients.
Methods: Among regularly monitored glaucoma patients, patients with a newly diagnosed ERM were consecu- tively enrolled. Before and after the onset of ERM, the RNFL thickness was measured using spectral domain optical coherence tomography, and a visual field examination was performed using a Humphrey field analyzer.
Changes in RNFL thickness parameters and global indices of the visual field analyzer were assessed.
Results: In a total of 28 eyes from 28 patients, the average RNFL thickness increased by a mean of 4.0 ± 7.4 µm (p = 0.009) after ERM onset. There was an increase in the superior, nasal, and temporal quadrant RNFL thicknesses, and the change in the temporal RNFL thickness was significant (14.4 ± 21.2 µm, p < 0.001). How- ever, the inferior RNFL thickness decreased by -0.6 ± 7.5 µm (p = 0.116). In the visual field examination, the mean deviation decreased significantly by -0.8 ± 1.7 dB (p = 0.038), from -14.6 to -15.4 dB.
Conclusions: A significant increase in average RNFL thickness was detected following ERM onset in glauco- ma patients, although there was deterioration of the mean deviation in the visual field. When ERM occurs in glaucoma patients, clinicians should be aware that RNFL thickness measurements obtained with a spectral domain optical coherence tomography may underestimate the status of glaucomatous optic neuropathy.
Key Words: Epiretinal membrane, Glaucoma, Optical coherence tomography, Peripapillary retinal nerve fiber layer, Visual field examination
Optical coherence tomography (OCT) imaging has evolved drastically over the last decade [1]. Spectral do- main OCT (SD-OCT) has become an important and useful tool for quantitatively evaluating the optic disc and peri-
papillary retinal nerve fiber layer (RNFL), and is therefore widely used to diagnose glaucoma [2-5]. Additionally, be- cause RNFL thickness measurements that are made using SD-OCT are highly reliable and reproducible [6,7], regular SD-OCT in glaucoma patients is helpful for detecting glaucomatous progression [3-5].
Although SD-OCT results in accurate and reproducible measurements, artifacts can occur that interfere with in- terpretability. Giani et al. [8] and Sull et al. [9] reported that artifacts were common in disease states such as uve-
Received: September 19, 2018 Final revision: November 24, 2018 Accepted: December 11, 2018
Corresponding Author: Kyoung Nam Kim, MD, PhD. Department of Ophthalmology, Chungnam National University Hospital, 282 Mun- hwa-ro, Jung-gu, Daejeon 35015, Korea. Tel: 82-42-280-7604, Fax: 82-42- 255-3745, E-mail: [email protected]
itis, an epiretinal membrane (ERM), diabetic retinopathy, and macular degeneration (8% to 90% of all scans). Asrani et al.[10] reported that ocular diseases such as vitreomacu- lar traction, age-related macular degeneration, high myo- pia, and ERMs commonly show artifacts on SD-OCT, and the most frequent artifacts occurred in patients with ERM.
Several studies have recently examined the effects of ERMs on RNFL thickness measurements using SD-OCT.
The RNFL is significantly thicker in eyes with ERM com- pared to eyes without ERM [11-13].Some studies have re- ported a significant decrease in RNFL thickness after sur- gical removal of ERM [14-17].ERMs usually arise from the macula and extend to the optic disc; thus, they can af- fect peripapillary RNFL thickness measurements [11].The prevalence of ERM increases with age, and similar to glaucoma [18], the prevalence of ERM is 5.3% to 18.5% in the general population [19-23] and 35% in patients 70 to 75 years of age [24-26]. Comorbidities of ERM and glaucoma are expected to be common [10].
To date, a longitudinal study that characterizes the influ- ence of ERM onset on the RNFL thickness in glaucoma patients has not yet been reported. The primary purpose of this study was to determine whether there was a significant ef- fect of ERM onset on the measurement of RNFL thickness using SD-OCT in glaucoma patients. A secondary purpose was to determine the possible relationships between chang- es in RNFL thickness and/or central macular thickness and changes in the results of Humphrey field analyzer measurements following the onset of ERM.
Materials and Methods
This retrospective study was approved by the institution- al review board of the Chungnam National University Hospital (2018-01-032-001), and adhered to the tenets of the Declaration of Helsinki. Informed consent was waived due to the retrospective nature of the study. Patients diag- nosed with glaucoma and an accompanying ERM were re- cruited after a review of the electronic medical records of glaucoma patients who visited the outpatient department of Chungnam National University Hospital between January 2016 and December 2017. The patient’s previous medical re- cords, fundus photographs, and macular scans that were obtained by SD-OCT were reviewed. Only patients whose ERM was newly diagnosed were consecutively enrolled.
Patients with optic neuropathy other than glaucoma, or ret- inal diseases other than ERM, were excluded. Other exclu- sion criteria were best-corrected visual acuity (BCVA)
<0.5 and high myopia with a spherical equivalent <-8 diop- ters, or an axial length >26.0 mm. Patients who underwent intraocular surgery, excluding cataract surgery that was performed more than 6 months prior to data acquisition, were also excluded.
Glaucoma was diagnosed based on glaucomatous optic neuropathy and corresponding visual field defects. Glauco- matous optic neuropathy was defined as a vertical cup-to- disc ratio >0.6, a difference in the vertical cup-to-disc ratio between both eyes >0.2, diffuse or focal thinning of the neuroretinal rim, or an RNFL defect. A glaucomatous vi- sual field defect was defined as follows: 1) a cluster of three points with a probability <5% on a pattern deviation map in at least one hemifield and including at least one point with a probability <1%, or a cluster of two points with a probability <1%; 2) glaucoma hemifield test results outside normal limits; or 3) a pattern standard deviation <5% on at least two consecutive baseline visual field tests. The pa- tients used intraocular pressure (IOP)-lowering medica- tions based on the guidance of a glaucoma specialist.
The enrolled patients were regularly checked for BCVA and subjected to auto-refractometry, slit-lamp biomicros- copy, Goldmann applanation tonometry, and a dilated fun- dus examination. Dilated fundus photography, SD-OCT (Cirrus HD OCT; Carl Zeiss Meditec, Dublin, CA, USA), and 24-2 Swedish interactive threshold algorithm standard perimetry (Humphrey Field Analyzer II; Carl Zeiss Med- itec) were also performed regularly.
Data selection before and after ERM onset
Optic disc scans using the 200 × 200 optic disc cube pro- tocol for peripapillary RNFL thickness measurements were performed using a Cirrus HD OCT instrument. Im- ages that had a signal strength ≥6, and the absence of any artifacts caused by eye motion, blinking, poor centration, or segmentation error, were included in the statistical anal- ysis. RNFL thickness evaluation parameters included av- erage thickness (360° measurement) and the thickness of four quadrants (temporal, superior, nasal, and inferior).
Pre-ERM RNFL thickness data were obtained from optic disc scans that were performed when the patient previous- ly experienced standard perimetry at least three times, and
when the patient did not have ERM based on dilated fun- dus photography and on macular scans, including a 512 × 128 macular cube scan and high definition line raster scan that used Cirrus HD OCT. Post-ERM RNFL thickness data were obtained when ERM was newly diagnosed, based on dilated fundus photography and the Cirrus HD OCT macular scans.
Peripapillary involvement of ERM was also investigat- ed. Peripapillary involvement was defined as one or more scanned images of the high-definition line raster scan that showed an ERM that extended over the scan circle of the peripapillary RNFL thickness measurement (Fig. 1A-1C).
Pre-ERM Humphrey visual field (HVF) data were de- fined as those measured within 6 months prior to acquisi- tion of the pre-ERM RNFL thickness data. Post-ERM HVF data were defined as those conducted within 6 months after the acquisition of the post-ERM RNFL thick- ness data. Unreliable results from HVF examinations (fix- ation loss >20% or a false-positive rate >15%) were exclud- ed from the statistical analysis.
All statistical analyses were performed using PASW Statistics ver. 18.0 (SPSS Inc., Chicago, IL, USA). The Wil- coxon signed-rank test was conducted to examine differ- ences between pre-ERM and post-ERM data. The relation-
ship between changes in average RNFL thickness and changes in the mean deviation from HVF were analyzed using the Spearman’s correlation coefficient. A value of p
< 0.05 was considered statistically significant.
Results
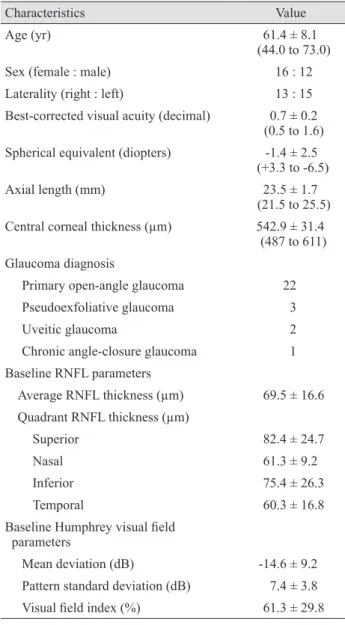
The study included 28 eyes from 28 patients (16 males and 12 females). The mean patient age was 61.4 ± 8.1 years (range, 44 to 73 years). Twenty-two eyes had primary open-angle glaucoma, and six patients had pseudoexfolia- tive glaucoma, uveitic glaucoma, or chronic angle-closure glaucoma (Table 1).
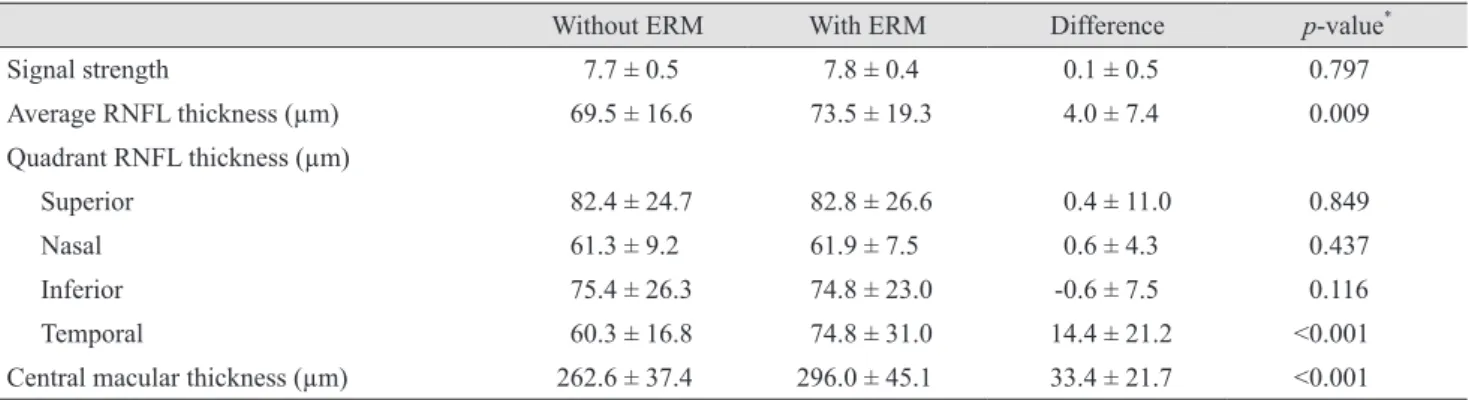
All of the enrolled patients had ERM with peripapillary involvement. Table 2 shows the changes in RNFL thick- ness and central macular thickness following the onset of ERM. The average RNFL thickness increased significantly by 4.0 ± 7.4 µm (from 69.5 ± 16 to 73.5 ± 19.3 µm, p = 0.009). A significant change was observed in the temporal quadrant (from 60.3 ± 16.8 to 74.8 ± 31.0 µm, p < 0.001), but not in the superior, nasal, or inferior quadrant. The central macular thickness increased by 33.4 ± 21.7 µm (p <
0.001). The mean time interval for SD-OCT examinations Fig. 1. Peripapillary involvement of the epiretinal membrane (ERM) was confirmed using (A) an axial view and (B) en face view of the high-definition line raster scan including the macular and optic disc. (A) The distance from the nasal boundary of the ERM to the nasal end of the scanned image was measured using a scale embedded in Cirrus HD optical coherence tomography. (C) After the scan circle of the peripapillary retinal nerve fiber layer overlapped on an en face view of the macular scan, (B) the distance from the crossing point of the scan circle of the peripapillary retinal nerve fiber layer and raster scan line to the nasal end of the raster scan line was measured using the same embedded scale. ERM with peripapillary involvement was defined as a case with a longer distance measured in (B) than in (A).
A B
C
between pre-ERM and post-ERM was 28.1 ± 12.8 months.
The mean IOP during this period was 17.6 ± 3.1 mmHg, which was calculated as the sum of all IOP values record- ed during this period divided by the total number of IOP examinations.
Table 3 shows changes in the BCVA and the results of the HVF examination following ERM onset. The BCVA was converted to the logarithm of the minimum angle of resolution units for statistical analysis, and then converted back into decimals. There was no significant change in the BCVA (0.7 ± 0.2 to 0.7 ± 0.2, p = 0.864). The mean devia-
tion (MD) decreased significantly by -0.8 ± 1.7 dB (-14.6 ± 9.2 to -15.4 ± 8.6 dB, p = 0.038). The pattern standard devi- ation and the visual field index did not show significant changes (p = 0.533 and 0.468, respectively). The mean in- terval between the pre-ERM HVF examinations and post- ERM HVF examinations was 35.0 ± 13.2 months. The mean IOP during this period was 17.1 ± 3.4 mmHg, which was not significantly different from the mean IOP calculat- ed during the pre-ERM and post-ERM OCT examinations.
There was no significant correlation between the change in the average RNFL thickness and change in the MD (r = 0.010, p = 0.961) or between the change in the central mac- ular thickness and change in the MD (r = 0.216, p = 0.674).
The change in central macular thickness was not correlat- ed with the average RNFL thickness or superior, inferior, or nasal RNFL thickness, but was correlated with the tem- poral RNFL thickness (r = 0.418, p = 0.022).
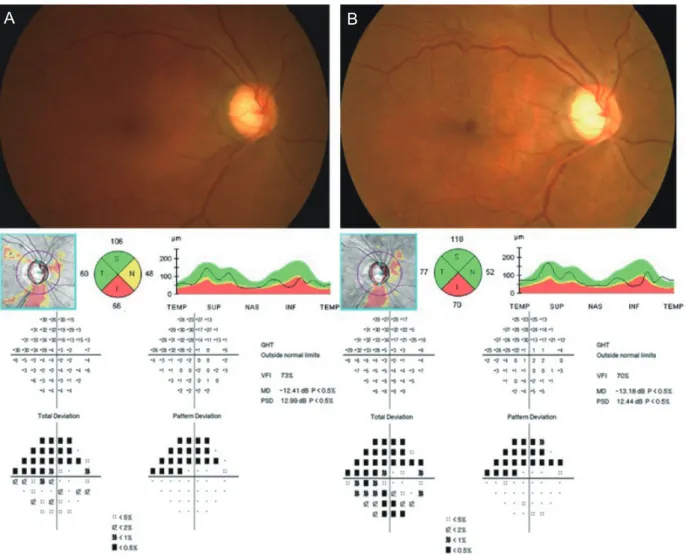
Fig. 2 shows the right eye of a representative patient. The interval of the fundus photographs and Cirrus HD OCT scans between pre-ERM (Fig. 2A) and post-ERM (Fig. 2B) was 18 months, and the interval of the HVF examination between pre-ERM and post-ERM was 22 months. The av- erage RNFL thickness increased from 70 to 79 µm follow- ing ERM onset. The RNFL thicknesses in all quadrants increased; however, the MD decreased from -12.41 to -13.18 dB on HVF examinations.
Discussion
This is the first study to investigate the influence of ERM development on RNFL thickness measured by SD- OCT in glaucoma patients. Our results show that in glau- coma patients, the average RNFL thickness increased sig- nificantly after ERM development. Analyses of quadrant RNFL thicknesses indicated that the temporal RNFL thickness significantly increased. This is consistent with previous studies in patients without glaucoma [11,12,14,27].
Evaluation of RNFL thicknesses by SD-OCT, as well as optic disc examinations and visual field tests, are currently indispensable for the diagnosis and follow-up for patients with glaucoma. Because RNFL damage is often preceded by visual field damage, SD-OCT is particularly helpful in diagnosing early glaucoma, and it can monitor the progres- sion of glaucoma more objectively because the test-retest variability is lower than that for the visual field test [2-5].
Table 1. Patient demographics (n = 28)
Characteristics Value
Age (yr) 61.4 ± 8.1
(44.0 to 73.0)
Sex (female : male) 16 : 12
Laterality (right : left) 13 : 15
Best-corrected visual acuity (decimal) 0.7 ± 0.2 (0.5 to 1.6) Spherical equivalent (diopters) -1.4 ± 2.5
(+3.3 to -6.5)
Axial length (mm) 23.5 ± 1.7
(21.5 to 25.5) Central corneal thickness (µm) 542.9 ± 31.4
(487 to 611) Glaucoma diagnosis
Primary open-angle glaucoma 22
Pseudoexfoliative glaucoma 3
Uveitic glaucoma 2
Chronic angle-closure glaucoma 1 Baseline RNFL parameters
Average RNFL thickness (µm) 69.5 ± 16.6 Quadrant RNFL thickness (µm)
Superior 82.4 ± 24.7
Nasal 61.3 ± 9.2
Inferior 75.4 ± 26.3
Temporal 60.3 ± 16.8
Baseline Humphrey visual field parameters
Mean deviation (dB) -14.6 ± 9.2
Pattern standard deviation (dB) 7.4 ± 3.8
Visual field index (%) 61.3 ± 29.8
Values are presented as mean ± standard deviation (range), or number.
RNFL = retinal nerve fiber layer.
However, various artifacts have been reported to interfere with the interpretation of the SD-OCT results. Among them, ERM is one of the major causes of artifacts, includ- ing segmentation errors, so that the measured RNFL thickness often exceeds the actual thickness [10]. Segmen- tation error occurs when SD-OCT mistakes the high re- flectivity of ERM as the upper boundary of the RNFL or the internal limiting membrane of the retina, resulting in an exaggerated thickness measurement. Histopathological- ly, ERM is caused by fibrocellular proliferation on the in- ternal limiting membrane [24],which gradually contracts, causing retinal tangential traction that can lead to various changes in retinal structure [14-16]. Oh et al. [14]suggested that ERM can induce movement of the superior RNFL hump toward the fovea on the temporal side. As a result, the temporal RNFL becomes thicker compared to that in the contralateral eye without ERM. In addition, the con- tractile force of ERM can cause retinal vascular deforma- tion, leading to edema of the RNFL; in turn, this can in-
crease the RNFL thickness [17,28].Lee et al.[11] reported that the average RNFL thickness and temporal quadrant RNFL thicknesses measured by SD-OCT in patients with ERM were thicker than those in patients without ERM.
Additionally, they divided patients with ERM into two groups, based on whether ERM involved the peripapillary area, and the RNFL thickness was greater in the group with peripapillary involvement. In our study, all of the pa- tients had ERM with peripapillary involvement.
The relationship between ERM and glaucoma should be considered in terms of three aspects. First, diagnosing glaucoma in patients with ERM, in which the boundary of the RNFL defect is not clearly demarcated and the glauco- matous visual field defect is not apparent, can be delayed because of peripapillary RNFL thickening caused by ERM, which can obscure diffuse or localized thinning of the RNFL. Second, detection of the glaucomatous progres- sion can be delayed if ERM newly occurs in patients with glaucoma, in which visual field progression is not consid- Table 2. Retinal nerve fiber layer thickness and central macular thickness changes following ERM onset
Without ERM With ERM Difference p-value*
Signal strength 7.7 ± 0.5 7.8 ± 0.4 0.1 ± 0.5 0.797
Average RNFL thickness (µm) 69.5 ± 16.6 73.5 ± 19.3 4.0 ± 7.4 0.009
Quadrant RNFL thickness (µm)
Superior 82.4 ± 24.7 82.8 ± 26.6 0.4 ± 11.0 0.849
Nasal 61.3 ± 9.2 61.9 ± 7.5 0.6 ± 4.3 0.437
Inferior 75.4 ± 26.3 74.8 ± 23.0 -0.6 ± 7.5 0.116
Temporal 60.3 ± 16.8 74.8 ± 31.0 14.4 ± 21.2 <0.001
Central macular thickness (µm) 262.6 ± 37.4 296.0 ± 45.1 33.4 ± 21.7 <0.001
Values are presented as mean ± standard deviation; The interval between spectral domain optical coherence tomography examinations before and after ERM onset was 28.1 ± 12.8 months.
ERM = epiretinal membrane; RNFL = retinal nerve fiber layer.
*Wilcoxon signed-rank test.
Table 3. Changes in visual acuity and global index of the Humphrey visual field test following ERM onset
Without ERM With ERM Differences p-value*
Best-corrected visual acuity (decimal)† 0.7 ± 0.2 0.7 ± 0.2 0.0 ± 0.1 0.864
Mean deviation (dB) -14.6 ± 9.2 -15.4 ± 8.6 -0.8 ± 1.7 0.038
Pattern standard deviation (dB) 7.4 ± 3.8 7.5 ± 3.6 0.1 ± 1.0 0.533
Visual field index (%) 61.3 ± 29.8 60.2 ± 30.7 1.1 ± 5.5 0.468
Values are presented as mean ± standard deviation; The interval between Humphrey visual field examinations before and after epiretinal membrane onset was 35.0 ± 13.2 months.
ERM = epiretinal membrane.
*Wilcoxon signed-rank test; †Best-corrected visual acuity was converted into logarithm of the minimum angle of resolution units for sta- tistical analyses, and then converted back into decimals.
erable. In glaucoma, deterioration of the visual field is ac- companied by a corresponding thinning of the RNFL over time. However, in the present study, despite worsening of the MD by -0.8 dB (p = 0.038) between the pre-ERM and post-ERM HVF tests, the average RNFL thickness showed an increase of 4.0 μm (p = 0.009) at pre-ERM compared with post-ERM OCT, indicating that the RNFL thickness measured by SD-OCT did not reflect the glaucoma status.
Previous studies have shown that ERM can affect not only visual acuity but also the peripheral visual field [12,13,29].
Therefore, it can be difficult to determine whether worsen- ing of the MD is caused by glaucoma progression or ERM.
Our patients were expected to have early-stage ERM, be-
cause we collected the SD-OCT and HVF data immediate- ly after discovering ERM. The analysis indicated that there was no significant change in visual acuity from be- fore to after ERM onset (p = 0.864), and none of the pa- tients complained of metamorphopsia. In addition, the changes in the RNFL and central macular thicknesses were not associated with a change in the MD (p = 0.961 and p = 0.674, respectively). Third, patients who undergo vitrectomy and removal of ERM may be misdiagnosed with glaucoma if RNFL thinning is detected [14,30]. Pre- vious studies that investigated changes in RNFL thickness following ERM removal showed that the RNFL thickness decreased after surgery. Oh et al. [14]and Lee et al. [28]
Fig. 2. Representative case of the right eye of a 54-year-old female patient with bilateral primary open-angle glaucoma. Fundus photogra- phy, spectral domain-optical coherence tomography, and Humphrey visual field (HVF) results performed before the onset of an epiretinal membrane (ERM) (A), and after ERM onset (B). The interval of the fundus photograph and spectral domain-optical coherence tomogra- phy between (A) and (B) was 18 months; the interval of the HVF examinations between (A) and (B) was 22 months. The average retinal nerve fiber layer thickness increased from 70 to 79 µm after ERM development. The retinal nerve fiber layer thicknesses in all quadrants increased; however, the mean deviation decreased from -12.41 to -13.18 dB on HVF examinations. T = temporal; S = superior; N = nasal; I
= inferior.
A B
suggested that the RNFL could be damaged during sur- gery because not only was the layer thinner than before surgery, but it was also thinner when compared to the con- tralateral eye without ERM. Gass et al. [31]suggested some possible causes of RNFL thinning following ERM sur- gery, including an increased IOP during surgery, phototox- icity caused by an illuminator, mechanical damage caused by removal of the internal limiting membrane, cytotoxicity arising from indocyanine green dye use, and stimulation of the optic nerve head during the induction of posterior vitreous detachment. Lalezary et al. [32]reported that the inferior quadrant RNFL was thinned in eyes that under- went ERM removal; therefore, this should be monitored for differential diagnosis of early glaucomatous changes.
There were some limitations to this study. First, because of the retrospective nature, the pre-ERM and post-ERM SD-OCT and HVF data were not collected at the same time points. However, to minimize the time difference be- tween examinations, the maximum interval between SD- OCT and the HVF test was limited to 6 months. Second, because the number of enrolled patients was small, we could not analyze differences according to the type and severity of glaucoma. Of note, it was difficult to recruit patients with glaucoma and that involved follow-up moni- toring during the time points from before ERM until after ERM had occurred. Finally, further progression of ERM can be expected to increase the risk of affecting the MD.
Therefore, we tried to eliminate the effects of ERM on the MD by collecting post-ERM data as early as possible, but there was still a possibility that ERM affected the MD.
In conclusion, this study shows a significant increase in RNFL thickness following the onset of ERM in patients with glaucoma. The average RNFL thickness and tempo- ral quadrant RNFL thickness increased, even though sig- nificant progression in the visual field defect was noted during the study period. Therefore, it is possible that RNFL thickness measurements by SD-OCT may underes- timate the progression of glaucoma when ERM occurs during the follow-up for glaucoma patients.
Conflict of Interest
No potential conflict of interest relevant to this article was reported.
References
1. Stein JD, Talwar N, Laverne AM, et al. Trends in use of ancillary glaucoma tests for patients with open-angle glau- coma from 2001 to 2009. Ophthalmology 2012;119:748-58.
2. Aref AA, Budenz DL. Spectral domain optical coherence tomography in the diagnosis and management of glauco- ma. Ophthalmic Surg Lasers Imaging 2010;41:S15-27.
3. Mwanza JC, Oakley JD, Budenz DL, et al. Ability of cirrus HD-OCT optic nerve head parameters to discriminate nor- mal from glaucomatous eyes. Ophthalmology 2011;118:241- 8.
4. Oh JH, Kim YY. Scanning laser polarimetry and optical coherence tomography for detection of retinal nerve fiber layer defects. Korean J Ophthalmol 2009;23:169-75.
5. Leung CK, Lam S, Weinreb RN, et al. Retinal nerve fiber layer imaging with spectral-domain optical coherence to- mography: analysis of the retinal nerve fiber layer map for glaucoma detection. Ophthalmology 2010;117:1684-91.
6. Liu X, Shen M, Huang S, et al. Repeatability and reproduc- ibility of eight macular intra-retinal layer thicknesses de- termined by an automated segmentation algorithm using two SD-OCT instruments. PLoS One 2014;9:e87996.
7. Budenz DL, Fredette MJ, Feuer WJ, Anderson DR. Repro- ducibility of peripapillary retinal nerve fiber thickness measurements with stratus OCT in glaucomatous eyes.
Ophthalmology 2008;115:661-6.
8. Giani A, Cigada M, Esmaili DD, et al. Artifacts in auto- matic retinal segmentation using different optical coher- ence tomography instruments. Retina 2010;30:607-16.
9. Sull AC, Vuong LN, Price LL, et al. Comparison of spec- tral/Fourier domain optical coherence tomography instru- ments for assessment of normal macular thickness. Retina 2010;30:235-45.
10. Asrani S, Essaid L, Alder BD, Santiago-Turla C. Artifacts in spectral-domain optical coherence tomography measure- ments in glaucoma. JAMA Ophthalmol 2014;132:396-402.
11. Lee YH, Bae HW, Seo SJ, et al. Influence of epiretinal membrane on the measurement of peripapillary retinal nerve fibre layer thickness using spectral-domain coher- ence tomography. Br J Ophthalmol 2016;100:1035-40.
12. Kim YW, Jeoung JW, Yu HG. Vitreopapillary traction in eyes with idiopathic epiretinal membrane: a spectral-do- main optical coherence tomography study. Ophthalmology 2014;121:1976-82.
13. Nomura Y, Tamaki Y, Yanagi Y. Vitreopapillary traction
diagnosed by spectral domain optical coherence tomogra- phy. Ophthalmic Surg Lasers Imaging 2010;41:S74-6.
14. Oh J, Oh JH, Do JR, et al. Retinal nerve fiber layer config- uration in eyes with epiretinal membrane. Optom Vis Sci 2014;91:1328-34.
15. Kim KY, Yu SY, Kim MS, et al. Changes of parafoveal ret- inal nerve fiber layer thickness analyzed by spectral-do- main optical coherence tomography after pars plana vitrec- tomy. Retina 2013;33:776-84.
16. Yamashita T, Uemura A, Kita H, Sakamoto T. Analysis of the retinal nerve fiber layer after indocyanine green-assist- ed vitrectomy for idiopathic macular holes. Ophthalmology 2006;113:280-4.
17. Arroyo JG, Irvine AR. Retinal distortion and cotton-wool spots associated with epiretinal membrane contraction.
Ophthalmology 1995;102:662-8.
18. Tham YC, Li X, Wong TY, et al. Global prevalence of glaucoma and projections of glaucoma burden through 2040: a systematic review and meta-analysis. Ophthalmol- ogy 2014;121:2081-90.
19. Xiao W, Chen X, Yan W, et al. Prevalence and risk factors of epiretinal membranes: a systematic review and me- ta-analysis of population-based studies. BMJ Open 2017;7:e014644.
20. Fraser-Bell S, Ying-Lai M, Klein R, et al. Prevalence and associations of epiretinal membranes in latinos: the Los Angeles Latino Eye Study. Invest Ophthalmol Vis Sci 2004;45:1732-6.
21. Fraser-Bell S, Guzowski M, Rochtchina E, et al. Five-year cumulative incidence and progression of epiretinal mem- branes: the Blue Mountains Eye Study. Ophthalmology 2003;110:34-40.
22. Klein R, Klein BE, Wang Q, Moss SE. The epidemiology of epiretinal membranes. Trans Am Ophthalmol Soc 1994;92:403-25.
23. Pearlstone AD. The incidence of idiopathic preretinal mac- ular gliosis. Ann Ophthalmol 1985;17:378-80.
24. Smiddy WE, Maguire AM, Green WR, et al. Idiopathic epiretinal membranes. Ultrastructural characteristics and clinicopathologic correlation. Ophthalmology 1989;96:811- 20.
25. Roth AM, Foos RY. Surface wrinkling retinopathy in eyes enucleated at autopsy. Trans Am Acad Ophthalmol Otolar- yngol 1971;75:1047-58.
26. Gupta P, Sadun AA, Sebag J. Multifocal retinal contraction in macular pucker analyzed by combined optical coherence tomography/scanning laser ophthalmoscopy. Retina 2008;28:447-52.
27. Lee HJ, Kim MS, Jo YJ, Kim JY. Thickness of the macula, retinal nerve fiber layer, and ganglion cell layer in the epiret- inal membrane: the repeatability study of optical coherence tomography. Invest Ophthalmol Vis Sci 2015;56:4554-9.
28. Lee SB, Shin YI, Jo YJ, Kim JY. Longitudinal changes in retinal nerve fiber layer thickness after vitrectomy for epiret- inal membrane. Invest Ophthalmol Vis Sci 2014;55:6607-11.
29. Bengtsson B, Heijl A. A visual field index for calculation of glaucoma rate of progression. Am J Ophthalmol 2008;145:343-53.
30. Savini G, Zanini M, Carelli V, et al. Correlation between retinal nerve fibre layer thickness and optic nerve head size: an optical coherence tomography study. Br J Ophthal- mol 2005;89:489-92.
31. Gass CA, Haritoglou C, Messmer EM, et al. Peripheral vi- sual field defects after macular hole surgery: a complica- tion with decreasing incidence. Br J Ophthalmol 2001;85:549-51.
32. Lalezary M, Shah RJ, Reddy RK, et al. Prospective Retinal and Optic Nerve Vitrectomy Evaluation (PROVE) study:
twelve-month findings. Ophthalmology 2014;121:1983-9.