www.koreanglaucoma.org
15
Volume 3 | Number 2 2014
1990년대 초 optical coherence tomography (OCT)는 소개된 이후로 계속 녹내장의 진단에 사용되기 시작했다. 이때 사용 하는 방법은 주로 시신경유두주위 일정거리(중심에서 약1.7 mm)에서 360도로 돌아가면서 측정한 시신경섬유두께(qRN- FL)를 지표로 사용하였다. 하지만 최근에 Spectral Domain (SD)-OCT의 등장 이후 안구내의 다른 부위 계측이 용이해지 면서 녹내장 진단에 있어서도 황반부위 계측이 이용되기 시 작하였다. 황반은 녹내장에서 특징적으로 손상받는 시신경절 세포의 전체 숫자 중 약 50%가 모여 있는 영역으로 이론상 좀 더 집중적으로 녹내장 손상을 발견할 수 있는 부위의 하나로 추정하고 있다.1 녹내장 환자에서 황반부위 변화에 대한 연구 는 time-domain (TD)-OCT로도 시행되어왔다.2-5 하지만 해상 도나 측정시간의 문제로 널리 사용되지 못하다가 본격적으로 시작된 것은 SD-OCT가 도입되면서부터였다.
1. 황반부위 OCT측정의 진단 정확성
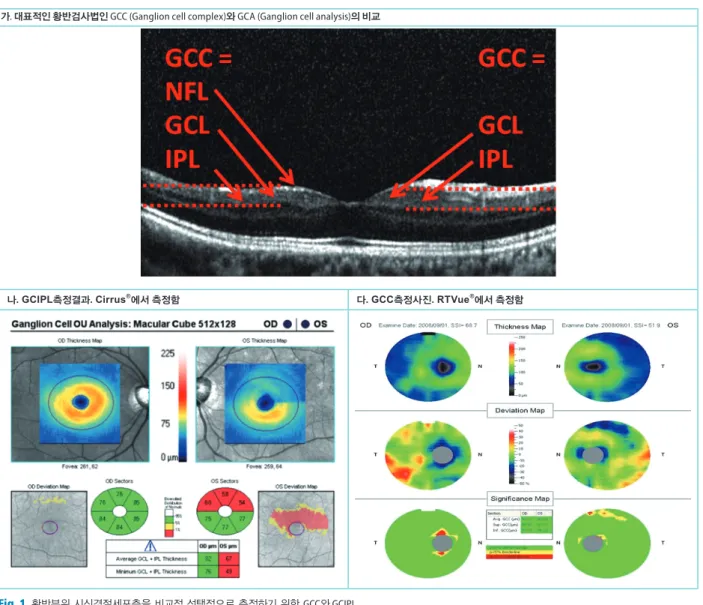
전술한 바와 같이 녹내장 진단에 있어서 황반부위 검사가 널 리 시행되기 시작한 것은 장비의 발전에 의하여 해상도 증가, 측정시간 단축, 오차 발생 감소 등에 의하여 가능해졌다. 이러 한 황반부위에서, 특히 시신경절 세포층 측정에 목표를 두고 처음으로 사용한 상용화된 SD-OCT기종은 RTVue (Optovue, Fremont, CA)였다. Ganglion Cell Complex (GCC) 스캔이라는 이름으로 7×7 mm 황반부위를 14928 A-scans으로 0.6초 동안 에 측정하였다(Fig. 1).6
자이스사에서도 Cirrus HD-OCT (Carl Zeiss Meditec, Dub- lin, CA)에서 Ganglion cell analysis (GCA)라는 이름으로 GCC 와 유사하게 시신경섬유층을 제외한 시신경세포층과 내망상
층을 포함한 층(GCIPL)을 측정하는 소프트웨어를 제공하였 다. 이렇게 초기 SD-OCT의 황반부위 분석이 직접 시신경절 세포층에 국한하지 않은 이유는 경계구분이 어려워 정확성을 높이기 위한 고육지책으로 이해된다. 이외에도 여러 타 기종의 SD-OCT에서 이와 유사한 분석방법이 제공된다. 하지만 여기 서는 두 기종에 대하여서만 집중적으로 다루도록 하겠다.
최근에는 이와 같은 황반부위 시신경절 세포층을 포함하는 여러 가지 분석방법을 이용한 연구가 활발히 진행되었다. 이 러한 연구들 중, qRNFL을 이용한 녹내장 진단방법과 이러한 GCC나 GCA를 이용한 방법 간의 상관성이 높다는 것은 여러 연구를 통하여 입증되었다. 하지만 어느 방법이 더 우수한지 에 대해서는 연구마다 다소 엇갈린다. 단 여러연구에서 GCC 가 TD-OCT에서의 황반전체두께측정보다는 녹내장 진단력이 우수하다고 알려지고 있다.6,7
또한 이러한 측정방법이 최소한 TD-OCT보다 재현성이 우 수하다고 알려지고 있다.6
2. 기존 유두주위 시신경섬유두께 측정방법과의 비교
여러 연구에서 TD-OCT와 SD-OCT의 pRNFL두께측정은 SD-OCT GCC와 통계적으로 진단력에 있어서 차이가 없다 고 보고하고 있다.8-10 하지만 일부 보고에서는 초기녹내장에 서 SD-OCT GCC의 진단력이 앞선다고 하기도 한다.11,12 그와 반대로 Huang 등13은 pRNFL이 다른 SD-OCT GCC나 ONH 지표보다 현성 녹내장진단력면에서 가장 뛰어난다고 보고한 바 있다.
특집: 한국녹내장의 현황
녹내장 진단에 있어서 황반부위 OCT측정
김 찬 윤 연세의대
Journal of The Korean Glaucoma Society
JOURNAL OF THE KOREAN GLAUCOMA SOCIETY 16
3. 황반부위 OCT와 시야검사와의 구조- 기능관계
황반부 SD-OCT는 시야검사의 손상정도와 잘 상관관계 를 이루는 것으로 보고되고 있다. Cho 등14은 RTVue GCC 와 pRNFL가 표준시야검사계의 평균 감도와 좋은 상관관계 를 이루고 있고 차이가 없다고 보고한 바 있다. 역시 Kim 등15 도 이와 같은 연구를 시행하여 시야검사의 MD, VFI가 GCC, pRNFL과 곡선관계를 이루면서 AROC를 이용한 녹내장 진단 력비교에서 차이가 없음을 보고하였다. 또한 통계적인 차이를 보이지는 않았지만 초기 녹내장에서는 GCC가 좋은 경향을 보였고 말기녹내장에서는 pRNFL를 통한 방법이 조금 더 좋 은 경향이 있다고 보고하였다.15 Na 등16은 녹내장시야손상이
상하측 절반에만 국한되어 있는 경우에 정상인 반대편 절반 의 GCC가 정상에 비하여 pRNFL보다 더 감소되어 있음을 보 고하여 GCC가 좀 더 초기 녹내장의 발견에 기여할 수 있음을 시사하였다. Raza 등17은 GCC에서 NFL을 제외한 GCL과 IPL 층만을 측정하여 분석에 사용하였다. NFL은 다른 장소의 것 이 통과하기만 하기 때문에 좀 더 특이적인 변화를 감지하기 위하여 제외하고 분석하였다. 이것은 후에 Cirrus의 GCA와 개 념이 같다. 그 결과 표준시야검사의 중심 10-2결과와 상관관 계를 보았을 때 7.2도 내의 결과와 좋은 상관관계를 보인다고 보고한 바 있다.17 최근 Kim 등18은 Cirrus의 GCIPL과 시야검 사손상의 국소적인 위치 상관관계를 규명하여 더욱 이에 대한 이해도를 증진시키고 있다.
가. 대표적인황반검사법인 GCC (Ganglion cell complex)와 GCA (Ganglion cell analysis)의비교
나. GCIPL측정결과. Cirrus®에서 측정함 다. GCC측정사진. RTVue®에서 측정함
Fig. 1. 황반부위 시신경절세포층을 비교적 선택적으로 측정하기 위한 GCC와 GCIPL
www.koreanglaucoma.org
17
Volume 3 | Number 2 2014
4. 황반부위 OCT의 잠재적 장점과 향후 연구방향
Seong 등19은 NTG에서 분석 시 RTVue GCC와 pRNFL의 진 단력 비교시, pRNFL측정이 중등도와 말기 녹내장에서 진단 력이 더 우수하다고 보고한 바 있다. 이것은 Kim 등15의 보고 와도 일맥상통한다. Kim 등15은 통계적인 차이를 보이지는 않 았지만 초기에 GCC가 말기에는 pRNFL의 진단력이 우수해지 는 경향이 있다고 하였다. 그러한 이유로는 GCC측정은 녹내 장 손상전체의 50% 상태밖에는 반영하지 못하지만(황반부위 의 시신경절세포가 전체의 50%만 모여 있기 때문에), pRNFL 는 100% 상태를 반영하기 때문에 말기에는 GCC로는 전체상 태를 다 대변못하기 때문이 아닐까 생각하고 있다.15 Na 등20은 역시 다른 연구에서 전체적으로 보아 진단력은 pRNFL이 더 우수하다고 보고한 바 있다.
황반부의 SD-OCT사용은 당뇨 망막증, 황반변성, 망막전 막등의 여러 가지 황반상태에 의하여 측정이 제한된다. 또한 전반적으로 황반부위는 전체적인 손상상태를 모두 다 대변하 지 못해서 제한적인 검사법으로 이해된다. 하지만 고도근시나 시신경유두주위의 상태가 정상적인 경우와 많이 차이를 보이 는 경우에는 전통적인 pRNFL측정방법을 보조하여 녹내장 진 단에 이용될 수 있을 것으로 생각한다. Kim 등21의 보고에 의 하면 역시 고도근시의 환자에서 통계적인 차이를 보이지 않았 지만 GCC에 의한 진단력이 qRNFL에 비하여 높은 경향이 있 다고 보고한 바 있다. 임상에서 어떻게 보조적인 방법으로 사 용될지에 대한 연구가 더욱 필요할 것으로 생각된다. 여기에서 는 녹내장 진행여부 판별에 대한 부분은 다루지 못했다. 이에 대한 내용과 다른 자세한 사안은 다른 종설을 참고하는 것도 좋겠다.22
참고문헌
1. Curcio CA, Allen KA. Topography of ganglion cells in hu- man retina. J Comp Neurol 1990;300:5-25.
2. Guedes V, Schuman JS, Hertzmark E, et al. Optical coher- ence tomography measurement of macular and nerve fi - ber layer thickness in normal and glaucomatous human eyes. Ophthalmology 2003;110:177-89.
3. Greenfield DS, Bagga H, Knighton RW. Macular thick- ness changes in glaucomatous optic neuropathy de-
tected using optical coherence tomography. Arch Oph- thalmol 2003;121:41-6.
4. Hess DB, Asrani SG, Bhide MG, et al. Macular and retinal nerve fi ber layer analysis of normal and glaucomatous eyes in children using optical coherence tomography.
Am J Ophthalmol 2005;139:509-17.
5. Leung CK, Chan WM, Yung WH, et al. Comparison of macular and peripapillary measurements for the detec- tion of glaucoma: An optical coherence tomography study. Ophthalmology 2005;112:391-400.
6. Tan O, Chopra V, Lu AT, et al. Detection of macular gan- glion cell loss in glaucoma by Fourier-domain optical co- herence tomography. Ophthalmology 2009;116:2305- 14.
7. Mori S, Hangai M, Sakamoto A, et al. Spectraldo- main optical coherence tomography measurement of macular volume for diagnosing glaucoma. J Glaucoma 2010;19:528-34.
8. Garas A, Vargha P, Hollo G. Diagnostic accuracy of nerve fibre layer, macular thickness and optic disc measure- ments made with the RTVue-100 optical coherence tomograph to detect glaucoma. Eye 2011;25:57-65.
9. Rao HL, Babu JG, Addepalli UK, et al. Retinal nerve fi ber layer and macular inner retina measurements by spec- tral domain optical coherence tomograph in Indian eyes with early glaucoma. Eye 2012;26:133-9.
10. Schulze A, Lamparter J, Pfeiffer N, et al. Diagnostic abil- ity of retinal ganglion cell complex, retinal nerve fiber layer, and optic nerve head measurements by Fourier- domain optical coherence tomography. Graefes Arch Clin Exp Ophthalmol 2011;249:1039-45.
11. Nakatani Y, Higashide T, Ohkubo S, et al. Evaluation of macular thickness and peripapillary retinal nerve fiber layer thickness for detection of early glaucoma using spectral domain optical coherence tomography. J Glau- coma 2011;20:252-9.
12. Moreno PA, Konno B, Lima VC, et al. Spectral-domain optical coherence tomography for early glaucoma as- sessment: Analysis of macular ganglion cell complex versus peripapillary retinal nerve fi ber layer. Can J Oph- thalmol 2011;46:543-7.
Journal of The Korean Glaucoma Society
JOURNAL OF THE KOREAN GLAUCOMA SOCIETY 18
13. Huang JY, Pekmezci M, Mesiwala N, et al. Diagnostic power of optic disc morphology, peripapillary retinal nerve fi ber layer thickness, and macular inner retinal lay- er thickness in glaucoma diagnosis with fourierdomain optical coherence tomography. J Glaucoma 2011;20:87- 94.
14. Cho JW, Sung KR, Lee S, et al. Relationship between visual field sensitivity and macular ganglion cell com- plex thickness as measured by spectral-domain opti- cal coherence tomography. Invest Ophthalmol Vis Sci 2010;51:6401-7.
15. Kim NR, Lee ES, Seong GJ, et al. Structure-function relationship and diagnostic value of macular ganglion cell complex measurement using Fourierdomain OCT in glaucoma. Invest Ophthalmol Vis Sci 2010;51:4646-51.
16. Na JH, Kook MS, Lee Y, et al. Detection of macular and circumpapillary structural loss in normal hemifi eld areas of glaucomatous eyes with localized visual fi eld defects using spectral-domain optical coherence tomography.
Graefes Arch Clin Exp Ophthalmol 2012;250:595-602.
17. Raza AS, Cho J, de Moraes CG, et al. Retinal ganglion
cell layer thickness and local visual field sensitivity in glaucoma. Arch Ophthalmol 2011;129:1529-36.
18. Kim KE, Park KH, Yoo BW, et al. Topographic localiza- tion of macular retinal ganglion cell loss associated with localized peripapillary retinal nerve fiber layer defect.
Invest Ophthalmol Vis Sci 2014;55:3501-8.
19. Seong M, Sung KR, Choi EH, et al. Macular and peripap- illary retinal nerve fi ber layer measurements by spectral domain optical coherence tomography in normal-tension glaucoma. Invest Ophthalmol Vis Sci 2010;51:1446-52.
20. Na JH, Sung KR, Baek S, et al. Macular and retinal nerve fiber layer thickness: which is more helpful in the diagnosis of glaucoma? Invest Ophthalmol Vis Sci 2011;52:8094-101.
21. Kim NR, Lee ES, Seong GJ, et al. Comparing the ganglion cell complex and retinal nerve fi bre layer measurements by Fourier domain OCT to detect glaucoma in high myo- pia. Br J Ophthalmol 2011;95:1115-21.
22. Sung KR, Wollstein G, Kim NR, et al. Macular assessment using optical coherence tomography for glaucoma diag- nosis. Br J Ophthalmol 2012;96:1452-5.