ABSTRACT
Background and Purpose: The Mini Mental State Examination, 2nd edition: Expanded version (MMSE-2: EV) involves an immediate recall (IR) of story memory (SM). A full version of SM has been developed and standardized; it includes delayed recall (DR) and recognition tests in addition to IR to increase its clinical utility as an independent story recall test. This study was conducted to provide norms for the full version of SM in the Korean version of MMSE-2: EV for clinical use.
Methods: A total of 1,168 participants (496 males and 672 females) were included in the study. The ages ranged from 19 to 90 years, and the education level ranged from illiterate to post-graduate. Regression analysis was used to evaluate the relative contributions of demographic variables (age, education, and sex) on the SM measures.
Results: We stratified age into 11 groups, and categorized the education level into 6 groups.
It was found that the IR, DR, and recognition scores of SM were affected by age, education level, and sex. We provided corrected means and standard deviations of the IR, DR, and recognition scores of the SM for the demographic variables.
Conclusions: The results indicate the importance of considering demographic variables in interpreting the full version of SM measures. The normative data we have provided in this study should be useful in clinical and research settings for detecting the impairment in verbal memory.
Keywords: Mini Mental State Examination, 2nd Edition (MMSE-2); Story Memory;
Immediate Recall; Delayed Recall; Recognition; Normative Data
INTRODUCTION
The Korean version of Mini Mental State Examination, 2nd edition (K-MMSE-2)1 was standardized and published recently. The K-MMSE-2 provides 3 versions: Brief version, standard version (K-MMSE-2: SV), and expanded version (K-MMSE-2: EV). The K-MMSE-2:
EV is an expanded version of K-MMSE-2: SV, with story memory (SM) and processing speed (digit symbol coding) tests added to it.
Original Article
Minji Song ,1,2 Seungmin Jahng ,3 SangYun Kim ,4 Yeonwook Kang 1,5
1Department of Psychology, College of Social Sciences, Hallym University, Chuncheon, Korea
2Department of Neurology, Hallym University Chuncheon Sacred Heart Hospital, Chuncheon, Korea
3Department of Psychology, College of Social Sciences, Sungkyunkwan University, Seoul, Korea
4 Department of Neurology, Seoul National University Bundang Hospital, Seoul National University College of Medicine, Seongnam, Korea
5Department of Neurology, Hallym University Sacred Heart Hospital, Anyang, Korea
A Normative Study of the Full Version of Story Memory in the Korean-Mini
Mental State Examination, 2nd Edition:
Expanded Version (K-MMSE-2: EV)
Received: Dec 2, 2020 Accepted: Dec 10, 2020 Correspondence to Yeonwook Kang
Department of Psychology, College of Social Sciences, Hallym University, 1 Hallymdaehak- gil, Chuncheon 24252, Korea.
E-mail: [email protected]
© 2020 Korean Dementia Association This is an Open Access article distributed under the terms of the Creative Commons Attribution Non-Commercial License (https://
creativecommons.org/licenses/by-nc/4.0/) which permits unrestricted non-commercial use, distribution, and reproduction in any medium, provided the original work is properly cited.
ORCID iDs Minji Song
https://orcid.org/0000-0002-7687-5239 Seungmin Jahng
https://orcid.org/0000-0002-1392-2229 SangYun Kim
https://orcid.org/0000-0002-9101-5704 Yeonwook Kang
https://orcid.org/0000-0003-4426-9127 Funding
This study was funded by the Korean Dementia Association and the Inpsyt, Inc., a branch of Hakjisa publisher.
Conflict of Interest
The authors have no financial conflicts of interest.
Author Contributions
Conceptualization: Kang Y; Data curation:
Song M, Kang Y; Formal analysis: Song M, Jahng S; Funding acquisition: Kang Y, Kim S;
Investigation: Kang Y; Methodology: Song M, Jahng S, Kang Y; Project administration:
Kang Y; Supervision: Kang Y; Validation: Kang Y; Writing - original draft: Song M; Writing - review & editing: Song M, Jahng S, Kang Y, Kim S.
It is well known that the story recall test can detect subtle memory impairment at prodromal stages of dementia as well as differentiate the degree of memory impairment.2,3 The original MMSE-2: EV includes only an immediate recall (IR) trial of the SM test. However, it is difficult to see the overall memory functioning by using IR alone or to assess the degree of memory impairment that is seen in various types of encoding, storage, and retrieval problems.4-10 Therefore, when evaluating memory, it is necessary to assess all 3 tests of immediate recall, delayed recall, and recognition to uncover the full nature of memory problems.11 Given this necessity, the full version of SM in the K-MMSE-2: EV, including delayed recall (DR) and recognition tests added to the IR test, was newly developed. The full version of SM has already shown excellent reliability and validity, and has proven to be a reliable and valid memory measure for clinical use.12
To distinguish between cognitive problems caused by pathological changes and cognitive decline caused by “normal” cognitive aging, we rely on normative data and compare a given patient's performance to that of his “normal” peers.13 The use of valid normative information is also essential for detecting very early abnormal cognitive impairment.14 Previous research has suggested that memory performance is significantly affected by demographic variables, most notably age, education, and sex. Generally, the story memory scores decrease in older and relatively less-educated populations.15-17 Subsequent research has shown that healthy females continue to exhibit better verbal memory than do males in normal aging.18-21 Therefore, it is very important to establish norms that cover a variety of demographic variables, such as age, education level, and sex, so that we can accurately distinguish between memory decline caused by normal aging and memory impairment caused by pathological changes, such as dementia.
Our purpose in this study was to identify the demographic variables that affect SM in the K-MMSE-2: EV with a large population dataset and to provide demographically corrected norms for the full version of SM for use in clinical and community settings.
METHODS
Participants
The participants were randomly sampled from all metropolitan cities and provinces across the country. Based on Christensen's health screening criteria,22 we excluded individuals with neurological or psychiatric history or suspected brain damage, those with chronic diseases (e.g., hypertension, diabetes, hyperlipidemia) that affect cognitive function but are not receiving treatment, and individuals with vision or hearing impairments that may affect test performance from the study. We included 1,168 adults (496 males and 672 females) in this study (Table 1). The ages ranged from 19 to 90 years (mean=64.20, standard deviation [SD]=16.18), and the years of education ranged from illiterate to post-graduate (mean=10.26, SD=5.98).
Measurements
We administered the full version of the SM in the K-MMSE-2: EV in the following way. A brief story composed of 4 sentences was verbally given to a subject, who was required to immediately recall the story as much as he/she could (IR). Then, the subject was asked to recall the story again 15 minutes later (DR). The IR and DR responses were assessed by scoring 0 or 1 for 27 word-units, with a maximum score of 25. The recognition test consisted
of 15 keyword items, and the subject answered either “yes” or “no” for each item. The maximum recognition score was 15 (Appendix 1).
During the 15 minutes of delay, we gave the subjects the Judgment of Line Orientation,23 Visual Discrimination Test,24 and Center for Epidemiological Studies-Depression scale,25 which did not affect the verbal memory performance, as filler tests. The subjects were not informed that they would be given the DR and recognition trials later after IR.
Clinical psychologists, clinical psychology graduate students, and 3rd–4th grade
undergraduate psychology students, whom we (YK & MS) had trained, collected the data.
They visited the houses, welfare centers, or senior-citizen centers for older adults in the community, and then administered the tests and scales.
Statistical analysis
Regression analysis with variance function26 was used to evaluate the relative contributions of demographic variables (age, education, and sex) to the IR, DR, and recognition scores of the SM, respectively. Age was stratified into 11 age groups (19–39, 40–44, 45–49, 50–54, 55–59, 60–64, 65–69, 70–75, 75–79, 80–84, 85–90) and years of education was categorized into 6 levels (illiterate, 0 [literate but no school education]–5, 6–8, 9–11, 12–15, and 16+ years). This categorization of age and education has been used in the normative study of K-MMSE-2.1 Because we assumed that the difference in scores across age groups would appear gradually, we coded each of the 11 age groups in order from 0 to 10 and treated them as a single continuous variable in the regression analyses. Each level of education was also coded in order from 0 to 5. However, we treated them as one categorical variable with 6 levels and did not constrain the difference between the levels to be continuous.
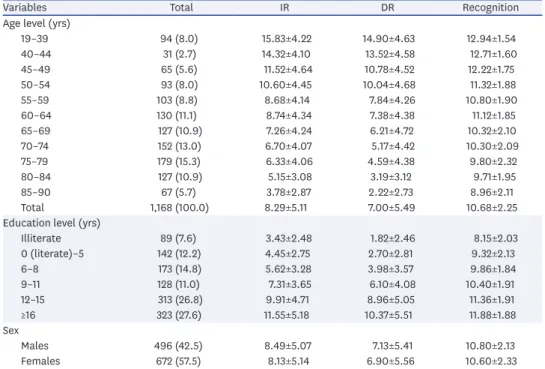
Table 1. The IR, DR, and recognition scores of Story Memory according to demographic variables
Variables Total IR DR Recognition
Age level (yrs)
19–39 94 (8.0) 15.83±4.22 14.90±4.63 12.94±1.54
40–44 31 (2.7) 14.32±4.10 13.52±4.58 12.71±1.60
45–49 65 (5.6) 11.52±4.64 10.78±4.52 12.22±1.75
50–54 93 (8.0) 10.60±4.45 10.04±4.68 11.32±1.88
55–59 103 (8.8) 8.68±4.14 7.84±4.26 10.80±1.90
60–64 130 (11.1) 8.74±4.34 7.38±4.38 11.12±1.85
65–69 127 (10.9) 7.26±4.24 6.21±4.72 10.32±2.10
70–74 152 (13.0) 6.70±4.07 5.17±4.42 10.30±2.09
75–79 179 (15.3) 6.33±4.06 4.59±4.38 9.80±2.32
80–84 127 (10.9) 5.15±3.08 3.19±3.12 9.71±1.95
85–90 67 (5.7) 3.78±2.87 2.22±2.73 8.96±2.11
Total 1,168 (100.0) 8.29±5.11 7.00±5.49 10.68±2.25
Education level (yrs)
Illiterate 89 (7.6) 3.43±2.48 1.82±2.46 8.15±2.03
0 (literate)–5 142 (12.2) 4.45±2.75 2.70±2.81 9.32±2.13
6–8 173 (14.8) 5.62±3.28 3.98±3.57 9.86±1.84
9–11 128 (11.0) 7.31±3.65 6.10±4.08 10.40±1.91
12–15 313 (26.8) 9.91±4.71 8.96±5.05 11.36±1.91
≥16 323 (27.6) 11.55±5.18 10.37±5.51 11.88±1.88
Sex
Males 496 (42.5) 8.49±5.07 7.13±5.41 10.80±2.13
Females 672 (57.5) 8.13±5.14 6.90±5.56 10.60±2.33
Data are shown as mean±standard deviation or number (%).
IR: immediate recall, DR: delayed recall.
For each of the 3 SM measures, we investigated the effects of age, education, sex, and their interactions as follows. First, we tested linear and quadratic effects of age group, mean difference across levels of education, and the interaction effect of the two, and built an initial model with significant effects. Then we tested the effect of age and education on the variance by incorporating the variance function into the initial regression model. After constructing the regression model for the mean and the variance in one model, we further investigated sex difference and added it to the model. All regression analyses were conducted using the PROC MIXED procedure in SAS 9.4.
Ethics statement
The study protocol was reviewed and approved by the Institutional Review Board (IRB) of Hallym University (HIRB-2017-042).
RESULTS
Demographic and descriptive statistics of the participants are shown in Table 1. For all SM measures, the average score was higher in the younger groups than in the older ones. For the IR and DR scores, the SD was generally higher in the younger groups than in the older ones, but the differences and patterns were not as clear as the mean. For the recognition score, the SD appears to be lower in the younger groups than in the older ones. Again, the difference was not as clear as the mean. People with higher levels of education had higher average scores than did those with lower levels of education. For the IR and DR scores, the SD of those with higher education levels was greater than those with lower levels of education. The difference in the SD of the recognition score across educational levels was neither systematic nor clear. Male's scores, which did not take into account other variables, such as age and education level, were higher on average than were those of females, although the difference was pretty small.
For each of the 3 SM measures, a significant negative linear effect of age group was found (IR, b=−0.29, t=−2.81, p=0.005; DR, b=−0.31, t=−2.68, p=0.008; recognition, b=−0.18, t=−6.95, p<0.001), but no quadratic effect was significant. We also found that the first age group had a higher mean deviating from the predicted linear decrease across the age groups (IR, b=2.83, t=5.50, p<0.001; DR, b=1.89, t=2.96, p=0.003; recognition, b=0.59, t=2.63, p=0.009).
The effect of education level was significant for all SM measures (IR, F6,1488=217.08, p<0.001;
DR, F6,1163=140.47, p<0.001; recognition, F6,1172=955.74, p<0.001). We also found a significant interaction effect of age group and education level on the IR score (b=−0.09, t=−3.10, p=0.002) and DR score (b=−0.12, t=−3.52, p<0.001). For simplicity of the interaction pattern, we treated both age group and education level as continuous variables in this effect. We found no significant interaction of age group and education level on the recognition score.
Significant sex differences on the average were found only in the group with 12 to 15 years of education (IR, b=1.25, t=3.27, p=0.001; DR, b=1.06, t=2.25, p=0.025; recognition, b=0.43, t=2.11, p=0.035) and the group with 16 years or more (IR, b=1.37, t=3.11, p=0.002; DR, b=1.41, t=2.77, p=0.006; recognition, b=0.46, t=2.31, p=0.021). For the variance function, we found a negative effect of age group and a positive effect of education level for the IR score (χ26=100.0, p<0.001) and the DR score (χ26=87.7, p<0.001) and found a positive effect of age group for the recognition score (χ21=10.6, p=0.001).
Based on the above findings, we developed a normative model of the mean and the variance of each of the SM measures, predicted by age group, education level, sex, and
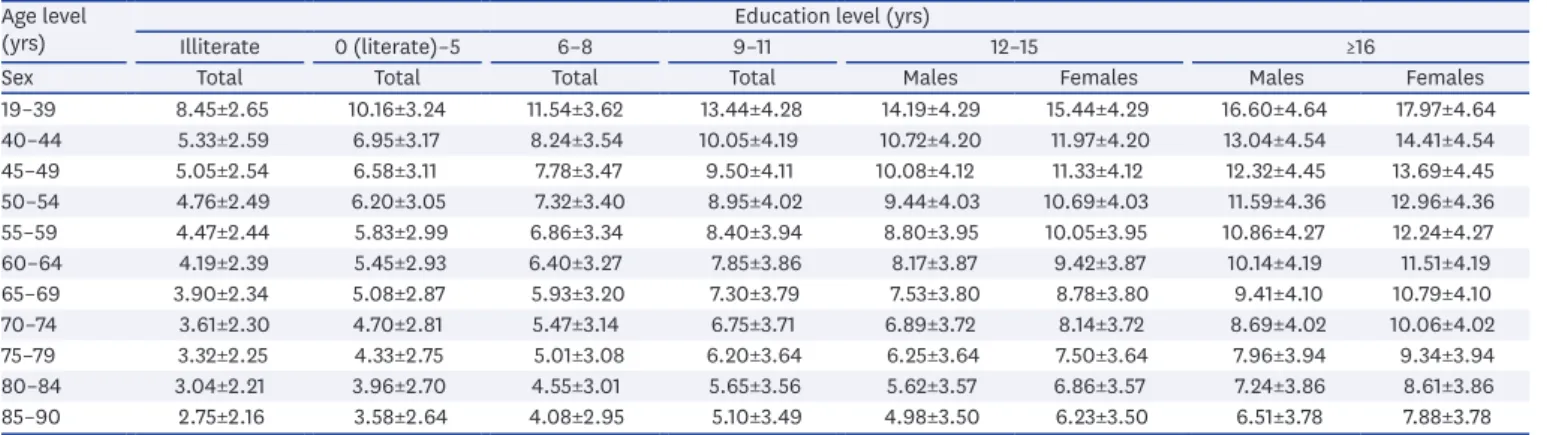
their interactions. The demographically corrected norms are calculated by a model-based procedure explained above. We observed that statistically significant sex differences were found only in groups with an education level of “12–15 years” and “16 years or more,” and the scores of females were higher than those of males. Therefore, for groups with an education level of “12–15 years” and “16 years or more,” the norms for males and females were obtained separately. The norms of the IR, DR, and recognition scores of SM according to demographic variables are shown in Tables 2–4, respectively.
Table 2. Corrected mean and standard deviations according to age, education level, and sex of immediate recall of the Story Memory Age level
(yrs) Education level (yrs)
Illiterate 0 (literate)–5 6–8 9–11 12–15 ≥16
Sex Total Total Total Total Males Females Males Females
19–39 8.45±2.65 10.16±3.24 11.54±3.62 13.44±4.28 14.19±4.29 15.44±4.29 16.60±4.64 17.97±4.64
40–44 5.33±2.59 6.95±3.17 8.24±3.54 10.05±4.19 10.72±4.20 11.97±4.20 13.04±4.54 14.41±4.54
45–49 5.05±2.54 6.58±3.11 7.78±3.47 9.50±4.11 10.08±4.12 11.33±4.12 12.32±4.45 13.69±4.45
50–54 4.76±2.49 6.20±3.05 7.32±3.40 8.95±4.02 9.44±4.03 10.69±4.03 11.59±4.36 12.96±4.36
55–59 4.47±2.44 5.83±2.99 6.86±3.34 8.40±3.94 8.80±3.95 10.05±3.95 10.86±4.27 12.24±4.27
60–64 4.19±2.39 5.45±2.93 6.40±3.27 7.85±3.86 8.17±3.87 9.42±3.87 10.14±4.19 11.51±4.19
65–69 3.90±2.34 5.08±2.87 5.93±3.20 7.30±3.79 7.53±3.80 8.78±3.80 9.41±4.10 10.79±4.10
70–74 3.61±2.30 4.70±2.81 5.47±3.14 6.75±3.71 6.89±3.72 8.14±3.72 8.69±4.02 10.06±4.02
75–79 3.32±2.25 4.33±2.75 5.01±3.08 6.20±3.64 6.25±3.64 7.50±3.64 7.96±3.94 9.34±3.94
80–84 3.04±2.21 3.96±2.70 4.55±3.01 5.65±3.56 5.62±3.57 6.86±3.57 7.24±3.86 8.61±3.86
85–90 2.75±2.16 3.58±2.64 4.08±2.95 5.10±3.49 4.98±3.50 6.23±3.50 6.51±3.78 7.88±3.78
Table 3. Corrected mean and standard deviation according to age, education level, and sex of delayed recall of the Story Memory Age level
(yrs) Education level (yrs)
Illiterate 0 (literate)–5 6–8 9–11 12–15 ≥16
Sex Total Total Total Total Males Females Males Females
19–39 6.22±2.74 7.94±3.18 9.63±3.93 12.01±4.53 13.16±4.44 14.22±4.44 15.39±4.96 16.81±4.96
40–44 4.02±2.69 5.62±3.12 7.19±3.85 9.46±4.44 10.49±4.36 11.55±4.36 12.61±4.87 14.02±4.87
45–49 3.70±2.64 5.19±3.06 6.64±3.78 8.80±4.36 9.71±4.28 10.78±4.28 11.72±4.78 13.13±4.78
50–54 3.39±2.59 4.76±3.00 6.10±3.71 8.14±4.28 8.94±4.20 10.00±4.20 10.83±4.69 12.24±4.69
55–59 3.08±2.54 4.33±2.95 5.56±3.65 7.48±4.20 8.16±4.13 9.23±4.13 9.94±4.60 11.35±4.60
60–64 2.76±2.49 3.90±2.89 5.01±3.58 6.82±4.13 7.39±4.05 8.45±4.05 9.04±4.52 10.46±4.52
65–69 2.45±2.45 3.47±2.84 4.47±3.51 6.16±4.05 6.61±3.98 7.68±3.98 8.15±4.43 9.57±4.43
70–74 2.14±2.40 3.04±2.79 3.92±3.45 5.50±3.98 5.83±3.90 6.90±3.90 7.26±4.35 8.67±4.35
75–79 1.82±2.36 2.62±2.74 3.38±3.38 4.84±3.90 5.06±3.83 6.12±3.83 6.37±4.27 7.78±4.27
80–84 1.51±2.32 2.19±2.69 2.83±3.32 4.18±3.83 4.28±3.76 5.35±3.76 5.48±4.19 6.89±4.19
85–90 1.20±2.27 1.76±2.64 2.29±3.26 3.52±3.76 3.51±3.69 4.57±3.69 4.59±4.12 6.00±4.12
Table 4. Corrected mean and standard deviation according to age, education level, and sex of recognition of the Story Memory Age level
(yrs) Education level (yrs)
Illiterate 0 (literate)–5 6–8 9–11 12–15 ≥16
Sex Total Total Total Total Males Females Males Females
19–39 10.22±1.60 11.32±1.60 11.72±1.60 12.07±1.60 12.37±1.60 12.80±1.60 13.02±1.60 13.48±1.60
40–44 9.46±1.64 10.55±1.64 10.95±1.64 11.30±1.64 11.60±1.64 12.03±1.64 12.25±1.64 12.71±1.64
45–49 9.27±1.68 10.37±1.68 10.76±1.68 11.11±1.68 11.42±1.68 11.85±1.68 12.07±1.68 12.53±1.68
50–54 9.09±1.73 10.19±1.73 10.58±1.73 10.93±1.73 11.24±1.73 11.66±1.73 11.88±1.73 12.35±1.73
55–59 8.91±1.77 10.00±1.77 10.40±1.77 10.75±1.77 11.05±1.77 11.48±1.77 11.70±1.77 12.16±1.77
60–64 8.72±1.81 9.82±1.81 10.22±1.81 10.57±1.81 10.87±1.81 11.30±1.81 11.52±1.81 11.98±1.81
65–69 8.54±1.86 9.64±1.86 10.03±1.86 10.38±1.86 10.69±1.86 11.11±1.86 11.34±1.86 11.80±1.86
70–74 8.36±1.90 9.46±1.90 9.85±1.90 10.20±1.90 10.51±1.90 10.93±1.90 11.15±1.90 11.61±1.90
75–79 8.18±1.95 9.27±1.95 9.67±1.95 10.02±1.95 10.32±1.95 10.75±1.95 10.97±1.95 11.43±1.95
80–84 7.99±2.00 9.09±2.00 9.48±2.00 9.83±2.00 10.14±2.00 10.57±2.00 10.79±2.00 11.25±2.00
85–90 7.81±2.05 8.91±2.05 9.30±2.05 9.65±2.05 9.96±2.05 10.38±2.05 10.61±2.05 11.07±2.05
DISCUSSION
The results showed the significant effects of age, education level, and sex on the full version of SM in the K-MMSE-2: EV. The fact that story memory is affected by demographic variables has already been reported in previous studies. The story memory score declined in older and less-educated populations.15-17,27,28 For the normative data used in this study, simple regression revealed that age explained 37.1%, 39.8%, and 21.2% of the variance in the IR, DR, and recognition of SM, respectively, whereas education level explained 32.0%, 32.3%, and 26.5%, respectively. Therefore, these results indicated that stratified norms according to age and education level are needed.
Our normative data also showed significant sex differences at the level of education over 12 years. Female's scores were higher than male's in all of the IR, DR, and recognition tests of SM. Sex differences in verbal memory performance have been reported in many studies, and females have been reported to perform better than males.18-21,29,30 However, few studies have reported sex differences in verbal memory that differ according to educational level, perhaps because the subjects of most previous studies had a relatively high level of education, with an average of 12 years or more.20,21,30 Therefore, the results of this study, in which no differences between males and females in verbal memory were found at a low educational level, are very interesting in showing the interaction effect between sex differences and educational level.
Several other story recall tests have already been developed and used in Korea. One is the Logical Memory (LM) subtest included in the Korean version of the Wechsler Memory Scale, 4th edition (K-WMS-IV).31 The LM provides the normative data according to the age (50–90 years) and education level (0–21 years).32 It consists of 2 story recall tests with a 15- to 30-minute delay between IR and DR, which can be burdensome for elderly subjects. In contrast, the SM in K-MMSE-2: EV includes only one story recall test and a 15-minute delay, so it is relatively simpler and easier to administer to the elderly and for them to do than is the LM of the K-WMS-IV. Another story recall test is a subtest included in the Literacy Independent Cognitive Assessment (LICA).33,34 However, the LICA provides norms for only the age of 60 and older. Although it also provides normative data according to the level of education, the education level is limited, because it is standardized for the illiterate and low- educated elderly. The newly developed SM provides the norms for IR, DR, and recognition derived from large-scale normative data, covering young adults to the elderly, a full range of education levels, and both males and females. The examiner can easily calculate the z-score, that is used to find out if there is a memory impairment, from the mean and SD scores corrected for demographic variables presented in Tables 2–4.
In conclusion, compared to other existing story recall tests, the full version of SM in the K-MMSE-2: EV has the advantage that it is short in administration time and provides a wide range of norms that can cover the entire adult population. We expect the full version of SM to be widely used in clinical fields and communities to assess verbal memory.
REFERENCES
1. Kang Y, Jahng S, Kim SY; Korean Dementia Association. Korean-Mini Mental State Examination, 2nd Edition (K-MMSE-2). Seoul: Hakjisa Publisher, 2020.
2. Perri R, Fadda L, Caltagirone C, Carlesimo GA. Word list and story recall elicit different patterns of memory deficit in patients with Alzheimer's disease, frontotemporal dementia, subcortical ischemic vascular disease, and Lewy body dementia. J Alzheimers Dis 2013;37:99-107.
PUBMED | CROSSREF
3. Guarch J, Marcos T, Salamero M, Gastó C, Blesa R. Mild cognitive impairment: a risk indicator of later dementia, or a preclinical phase of the disease? Int J Geriatr Psychiatry 2008;23:257-265.
PUBMED | CROSSREF
4. Dubois B, Albert ML. Amnestic MCI or prodromal Alzheimer's disease? Lancet Neurol 2004;3:246-248.
PUBMED | CROSSREF
5. Kizilbash AH, Vanderploeg RD, Curtiss G. The effects of depression and anxiety on memory performance. Arch Clin Neuropsychol 2002;17:57-67.
PUBMED | CROSSREF
6. Fossati P, Coyette F, Ergis AM, Allilaire JF. Influence of age and executive functioning on verbal memory of inpatients with depression. J Affect Disord 2002;68:261-271.
PUBMED | CROSSREF
7. Tounsi H, Deweer B, Ergis AM, Van der Linden M, Pillon B, Michon A, et al. Sensitivity to semantic cuing: an index of episodic memory dysfunction in early Alzheimer disease. Alzheimer Dis Assoc Disord 1999;13:38-46.
PUBMED | CROSSREF
8. Grober E, Lipton RB, Hall C, Crystal H. Memory impairment on free and cued selective reminding predicts dementia. Neurology 2000;54:827-832.
PUBMED | CROSSREF
9. Lavenu I, Pasquier F, Lebert F, Pruvo JP, Petit H. Explicit memory in frontotemporal dementia: the role of medial temporal atrophy. Dement Geriatr Cogn Disord 1998;9:99-102.
PUBMED | CROSSREF
10. Petersen RC, Smith G, Kokmen E, Ivnik RJ, Tangalos EG. Memory function in normal aging. Neurology 1992;42:396-401.
PUBMED | CROSSREF
11. Lezak MD, Howieson DB, Loring DW, Hannay HJ, Fischer JS. Neuropsychological Assessment. 4th ed. New York, NY: Oxford University Press, 2004;414-415.
12. Song M, Lee SH, Yu KH, Kang Y. Development and validation of the full version of story memory in the Korean-Mini Mental State Examination, 2nd edition: Expanded version (K-MMSE-2: EV). Dement Neurocogn Disord 2019;18:96-104.
PUBMED
13. Kramer AO, Casaletto KB, Umlauf A, Staffaroni AM, Fox E, You M, et al. Robust normative standards for the California Verbal Learning Test (CVLT) ages 60–89: a tool for early detection of memory impairment.
Clin Neuropsychol 2020;34:384-405.
PUBMED | CROSSREF
14. De Santi S, Pirraglia E, Barr W, Babb J, Williams S, Rogers K, et al. Robust and conventional
neuropsychological norms: diagnosis and prediction of age-related cognitive decline. Neuropsychology 2008;22:469-484.
PUBMED | CROSSREF
15. Haaland KY, Price L, Larue A. What does the WMS-III tell us about memory changes with normal aging? J Int Neuropsychol Soc 2003;9:89-96.
PUBMED | CROSSREF
16. Vogel A, Stokholm J, Andreasen R, Henriksen BD, Brønniche V, Madsen GJ, et al. Psychometric properties and reference data for Danish versions of Free and Cued Selective Reminding Test, Category Cued Memory Test and Logical Memory. Scand J Psychol 2018;59:496-502.
PUBMED | CROSSREF
17. O'Bryant SE, Edwards M, Johnson L, Hall J, Gamboa A, O'jile J. Texas Mexican American adult normative studies: normative data for commonly used clinical neuropsychological measures for English- and Spanish-speakers. Dev Neuropsychol 2018;43:1-26.
PUBMED | CROSSREF
18. de Frias CM, Nilsson LG, Herlitz A. Sex differences in cognition are stable over a 10-year period in adulthood and old age. Neuropsychol Dev Cogn B Aging Neuropsychol Cogn 2006;13:574-587.
PUBMED | CROSSREF
19. Gerstorf D, Herlitz A, Smith J. Stability of sex differences in cognition in advanced old age: the role of education and attrition. J Gerontol B Psychol Sci Soc Sci 2006;61:P245-249.
PUBMED | CROSSREF
20. Lundervold AJ, Wollschläger D, Wehling E. Age and sex related changes in episodic memory function in middle aged and older adults. Scand J Psychol 2014;55:225-232.
PUBMED | CROSSREF
21. Zhang J, Zhou W, Wang L, Zhang X; Harvard Aging Brain Study. Gender differences of neuropsychological profiles in cognitively normal older people without amyloid pathology. Compr Psychiatry 2017;75:22-26.
PUBMED | CROSSREF
22. Christensen KJ, Multhaup KS, Nordstrom S, Voss K. A cognitive battery for dementia: development and measurement characteristics. Psychol Assess 1991;3:168-174.
CROSSREF
23. Benton AL, Abigail B, Sivan AB, Hamsher KD, Varney NR, Spreen O. Contributions to Neuropsychological Assessment: A Clinical Manual. New York, NY: Oxford University Press, 1994.
24. White T, Stern RA. NAB Visual Discrimination Test Professional Manual. Lutz, FL: Psychological Assessment Resources, 2009.
25. Chon KK, Choi SC, Yang BC. Integrated adaptation of CES-D in Korea. Korean J Health Psychol 2001;6:59-76.
26. Jahng S, Kang Y. A model-based approach to estimating psychological test norms under normality assumption. Korean J Clin Psychol 2012;31:923-944.
CROSSREF
27. Marcopulos B, McLain C. Are our norms “normal”? A 4-year follow-up study of a biracial sample of rural elders with low education. Clin Neuropsychol 2003;17:19-33.
PUBMED | CROSSREF
28. Shin M, Hong SH, Park K, Hwang ST, Chey J, Kim JH. Impact of education on the Korean Wechsler Memory Scale IV performances. Korean J Clin Psychol 2016;35:585-599.
CROSSREF
29. McCarrey AC, An Y, Kitner-Triolo MH, Ferrucci L, Resnick SM. Sex differences in cognitive trajectories in clinically normal older adults. Psychol Aging 2016;31:166-175.
PUBMED | CROSSREF
30. Brunet HE, Caldwell JZK, Brandt J, Miller JB. Influence of sex differences in interpreting learning and memory within a clinical sample of older adults. Neuropsychol Dev Cogn B Aging Neuropsychol Cogn 2020;27:18-39.
PUBMED | CROSSREF
31. Chey J, Park K, Hwang S, Hong S. Korean Wechsler Memory Scale IV. Daegu: Korea Psychology, 2012.
32. Ahn YD, Yi D, Joung H, Seo EH, Lee YH, Byun MS, et al. Normative data for the logical memory subtest of the Wechsler Memory Scale-IV in middle-aged and elderly Korean people. Psychiatry Investig 2019;16:793-799.
PUBMED | CROSSREF
33. Kang SG, Cho SJ, Ryu SH, Choi SH, Han SH, Shim YS, et al. Normative study of the Literacy Independent Cognitive Assessment in illiterate and literate elderly Koreans. Psychiatry Investig 2015;12:305-315.
PUBMED | CROSSREF
34. Shim YS, Yoo SH, Yoo HJ, Lee DW, Lee JY, Jeong JH, et al. Literacy Independent Cognitive Assessment (LICA).
Seoul: Hakjisa Publisher, 2016.
Appendix 1. Recognition test sheet of the Story Memory in the Korean-Mini Mental State Examination, 2nd edition: Expanded version (K-MMSE-2: EV)
Story Memory (K-MMSE-2: EV): Recognition
“지금부터 앞에서 들려드렸던 짧은 이야기에 대해서 질문을 드리겠습니다. 질문이 이야기의 내용과 맞으면
‘예,’ 틀리면 ‘아니오’라고 말씀해 주십시오.”
질문 반응 점수
1 주인공의 이름이 정수입니까? 예 아니오 0 1
2 강아지 이름이 다롱이입니까? 예 아니오 0 1
3 강아지가 3시간 동안 없어졌습니까? 예 아니오 0 1
4 강아지가 없어져서 주인공이 눈물을 흘렸습니까? 예 아니오 0 1 5 주인공은 집안에서 강아지를 찾으러 다녔습니까? 예 아니오 0 1 6 주인공의 가족들이 강아지를 찾으러 다녔습니까? 예 아니오 0 1 7 주인공의 친구들이 집 주변에서 강아지를 찾으러 다녔습니까? 예 아니오 0 1 8 주인공은 강아지가 없어져서 경찰에 신고를 하였습니까? 예 아니오 0 1 9 주인공은 강아지를 찾으려고 전단지를 만들었습니까? 예 아니오 0 1 10 주인공은 전단지를 사람들에게 나눠주었습니까? 예 아니오 0 1
11 주인공은 외투를 입고 외출하였습니까? 예 아니오 0 1
12 주인공은 강아지를 집안에서 발견했습니까? 예 아니오 0 1
13 강아지는 옷장 안에 있었습니까? 예 아니오 0 1
14 강아지는 이불 위에 있었습니까? 예 아니오 0 1
15 강아지는 자고 있었습니까? 예 아니오 0 1
총
총 점점 //1155