X-BAND SAR CALIBRATION CAMPAIGNS USING TERRASAR-X AND COSMO-SKYMED
Soon-gu Kwon
1, Duk-jin Kim
2, Yisok Oh
31)Department of Electronic Information and Communication Engineering, Hongik University, Seoul 121-791, Korea [email protected]
2)School of Earth and Environmental Sciences, Seoul National University, Seoul 151-742, Korea [email protected]
3)School of Electronic and Electrical Engineering, Hongik University, Seoul 121-791, Korea yisokoh@ hongik.ac.kr
ABSTRACT: This paper presents X-band SAR calibration campaigns using TerraSAR-X and COSMO-SkyMed SAR.
Algorithms for retrieving precise radar cross sections (RCS) of a polarimetric active radar calibrator (PARC) and a trihedral corner reflector (TCR) are proposed. The theoretical RCS of the PARC was computed using the measured loop gain and antenna gains. The RCS of the TCR was computed based on the physical optics (PO), geometrical optics (GO), and geometrical theory of diffraction (GTD) techniques. We have acquired COSMO-SkyMed and TerraSAR-X data over the study area where the PARC and TCRs were installed, and extracted the RCSs of the calibration targets from the SAR data. The RCSs of the calibration targets were obtained from the SAR data by integrating pixel intensities around the target positions and removing the backgrounds. We extracted the calibration constants using the difference between the theoretical and experimental RCSs of the calibration targets.
KEY WORDS: X-band SAR calibration, RCS, trihedral corner reflector, polarimetric active radar calibrator
1. INTRODUCTION
Unlike an optical sensor, a synthetic aperture radar (SAR) can be used anytime and anywhere regardless of the sun-orientation and weather. With such an advantage, it is widely utilized to classify information on the ground and detect the ecosystem, the ocean, and various disasters (Entekhabi et al., 2004). Also, it can be utilized for a military purpose among various fields (Ulaby et al., 1982). The utilization of the SAR images depends on the quality of the images, while the quality of the images is directly related to the calibration accuracy of the SAR.
The SAR can be externally calibrated by deploying a calibration target in the testing field and accurately measuring its RCS (Sarabandi et al., 1992a). The active calibration target is small, RCS-controllable, but expensive. Other advantage of the PARC is to allow data recording (Doring et al., 2007). On the contrary, the passive calibration target such as trihedral corner reflector (TCR) is big and heavy, but cheap. The TCR has been widely used as a calibration target because of its wide angular pattern, stability, and easiness on its manufacture with a high radiometric accuracy (Ulaby and Elachi, 1990).
In this study, the designs of the calibration targets such as TCR and PARC as well as the theoretical calculation of RCSs are explained. Also, the RCSs of the calibration targets are extracted from the SAR images of TerraSAR- X and COSMO-SkyMed. The RCSs of the calibration targets were obtained from the SAR data by integrating pixel intensities around the impulse response function (IRF) and removing the background. This technique
assumes that the background is homogeneous (Buck, 2002).
2. RCS COMPUTATION FOR THE CALIBRATION TARGETS 2.1 Trihedral Corner Reflector (TCR)
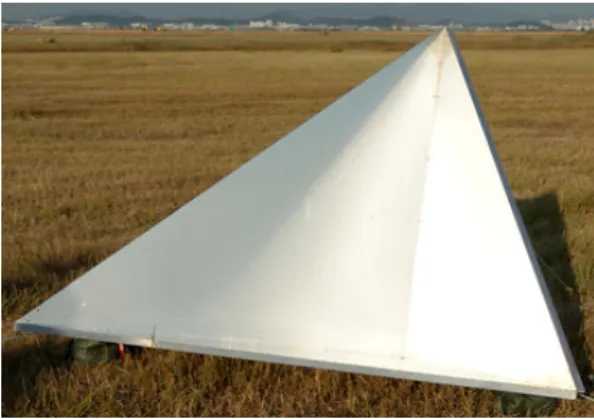
During the calibration campaign, five different TCRs are used. Figure 1 shows the installation of one of those TCRs in the field.
Figure 1. A field-installed TCR.
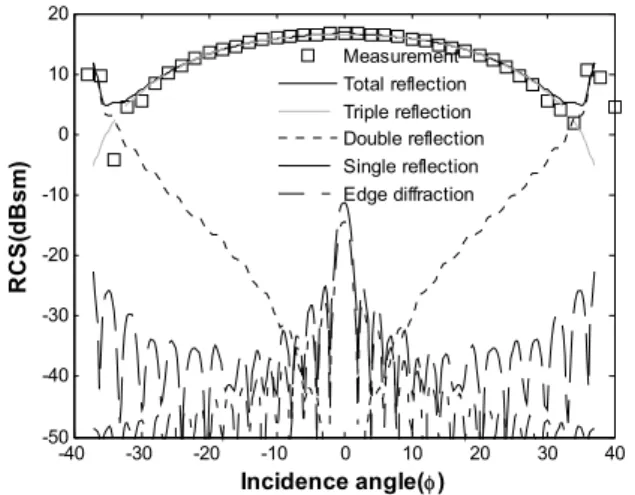
The theoretical RCS of a calibration target should be calculated accurately for an accurate SAR external calibration. The theoretical RCS of the TCR has been calculated using the PO, GO, and GTD techniques. We considered three single-reflected waves with the PO, six double-reflected waves with the GO-PO, six triple-
reflected waves with the GO-GO-PO and three edge- diffracted waves with the GTD in the computation of the RCS of the TCR. Figure 2 shows a comparison between the measured and calculated RCSs of a 32-cm TCR at 9.65 GHz. The theoretical RCSs at 9.65 GHz for the TCRs of 1.2 m, 1.35 m and 1.5 m are listed in Table 2.
-40 -30 -20 -10 0 10 20 30 40
-50 -40 -30 -20 -10 0 10 20
Incidence angle(φ)
RCS(dBsm)
Measurement Total reflection Triple reflection Double reflection Single reflection Edge diffraction
Figure 2. A comparison between the measured and calculated RCS of 32-cm TCR at 9.65 GHz.
2.2 Polarimetric Active Radar Calibrator (PARC) The PARC, which we used in these campaigns, receives and transmits signals with two horn antennas.
Each horn antenna must be installed with 45-degree rotation for adequate polarimetric responses; i.e., equal RCS values for vv-, hh-, hv-, and vh-polarizations at nadir direction. It has also been designed to increase the level of isolation between two antennas. The amplifying circuit of the PARC includes a low-noise amplifier (LNA), a band-pass filter (BPF), a coupler, and a power amplifier (PA) as shown in Fig. 3. Isolators have been installed to reduce the multiple reflections. A detector and a data acquisition (DAQ) board are used to log receiving signals. The designed PARC has a broad bandwidth of 700 MHz with a center frequency of 9.65 GHz. The gains of the both horn antenna are 22.8dBi.
Figure 3. PARC Circuit
The loop gain of the PARC circuit, which has been measured by the spectrum analyzer, is shown in Fig. 4 for various input powers ranging from -70 dBm to -30 dBm. The measured loop gain is about 64 dB. The 1-dB compression point is about -40 dBm, which gives the dynamic range larger than 30 dB.
-70 -65 -60 -55 -50 -45 -40 -35 -30
-10 -5 0 5 10 15 20 25 30
Source Power.[dBm]
Output power[dBm]
Freq. = 9.65 GHz PARC circuit
Figure 4. The loop gain of the PARC circuit.
The RCS of the PARC can be computed with the loop gain, the effective receiving-antenna aperture, and the transmit-antenna gain as in (1) (Sarabandi et al., 1992b).
π
σT =41⋅Gloop⋅GR⋅GT⋅4λ2 (1)
where Gloop is the loop gain of the PARC circuit, G R and G is the gain of the receiving and the transmitting T antenna. The constant 1/4 was multiplied because of the 45-degree rotations of the antennas. The RCS of the PARC is 62.5dBsm with this computation, and its RCS was confirmed with measurements. Although the maximum RCS is 62.5dBsm with the output power of 20dBm, the RCS can be controlled with appropriate attenuator sets. Table 1 shows the specification of the designed PARC. Figure 4 shows the field-installed PARC.
Table 1. PARC specification
parameters value unit
Center frequency 9.65 GHz
Bandwidth 700 MHz
Maximum RCS 62.5 dBsm Maximum loop gain
Dynamic range 64
>30 dB dB Max output power 20 dBm Time delay <10 ns
Figure 5. A field-installed PARC.
3. FIELD CAMPAIGNS 3.1 TerraSAR-X
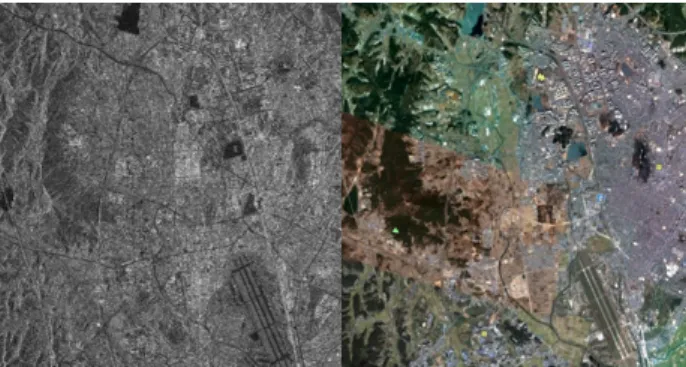
Five TCRs of various sizes have been installed in the area of Sihwa Lake before taking an image of the site with the TerraSAR-X at 09:29 (UTC) on October 10th, 2009. Figure 6 shows the spot-mode TerraSAR-X image with HH/VV polarizations (Fritz., 2007) and an optical image of the site.
Figure 6. Sihwa Lake (left: SAR image, right: optical image)
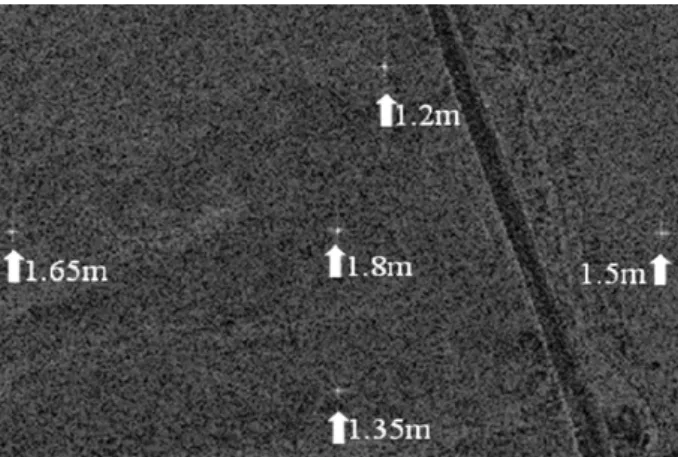
Figure 7 shows an enlarged image of the area where the calibration targets have been installed. The theoretical RCSs are 39.58 dBsm, 41.52 dBsm and 43.49 dBsm for the 1.2-m, 1.35-m, 1.5-m TCRs, respectively, as shown in Table 2. The 1.65-m and 1.8-m TCRs are not listed in this table because of the installation errors of the TCRs.
In order to extract the measured RCSs of the TCRs from the SAR image, it is necessary to integrate all the powers which have been dispersed by the characteristic of the impulse response function (IRF) of the SAR (Na and Oh, 2007). According to the power integration technique, it is assumed that the surrounding area has the same backscattering coefficient with the area where the TCR has installed.
Figure 7. Five TCRs in the TerraSAR-X image.
The RCS of the calibration target can be estimated using the following equation.
g a areaC
N ij
areaA
N C
ij A
E a PP
N a N
a
A ⎟⎟
⎠
⎞
⎜⎜
⎝
⎛ ∑ − ∑
= ( ) 2 ( ) 2
σ (2)
where N is the number of pixels, the subscript A is for the integration area and the subscript C is for the background area, aij2 represents the backscattering coefficient of the i,jth pixel. Pa is the azimuth resolution and Pg is the ground resolution. Table 2 shows the comparison between the theoretical RCSs and the extracted RCSs from images for VV and HH- polarizations. The calibration constants, therefore, could be computed as shown in Table 2.
Table 2. Comparison of theoretical and extracted RCSs.
TCR size (m)
Theoretical RCS (dBsm)
Extracted RCS
(dBsm) Calibration constant (dB) VV HH VV HH 1.20 39.58 38.95 39.24 0.63 0.34 1.35 41.52 41.74 42.04 -0.22 -0.52 1.50 43.49 43.24 43.54 0.25 -0.05
Avg. - - - 0.22 -0.23
Because we used a pre-calibrated image, the calibration constant might be 0 dB, it both external calibrations of the DLR and this campaign have no errors.
The errors could be from the pre-calibration the of DLR or this external calibration campaign. The 1.2-m, 1.35-m and 1.5-m TCRs are seemed to well calibrated within
±1.0 dB. However, the errors of the 1.65-m and 1.8-m TCRs are larger than 1 dB. We assume that the uncertainty of the RCS may be caused from (1) target misalignment and (2) TCR structural errors such as angular deviation from orthogonality, plate curvature deviation, and surface irregularities.
3.2 COSMO-SkyMed
A PARC has been installed in the area of Suwon before taking an image of the site with COSMO SkyMed SAR at 21:24 (UTC) on August 11th, 2010. Figure 8 shows the COSMO-SkyMed SAR spot-mode image for HH-polarization and an optical image of the site.
Figure 8. COSMO-SkyMed Image (left:SAR image, right: optical image)
Figure 9 shows the image of the PARC in the area where PARC has been installed, which also shows a large power spill according to the SAR IRF. We computed the measured RCS of the PARC using the power integration method in (2). The extracted RCS was much lower than the theoretical RCS because of a position error. We found afterward that the PARC had been positioned with about 6.5deg off-center in the azimuth direction.
Therefore, for alleviating the position error should have a broad beam; that is, a lower antenna gain. This positioning error could lower the RCS more than 6dB, because antenna’s half power band width (HPBW) is only 12.5deg. The other errors may be from the power integration because of the inhomogeneous background area and the large power spill over the area.
100 200 300 400 500
50 100 150 200 250 300 350 400 450
500 -40
-30 -20 -10 0 10 20 30 40 50
Figure 9. A PARC in the SAR image.
4. CONCLUSION
The theoretical RCSs of the TCRs and PARC were accurately computed. We installed the passive and active X-band SAR calibration targets at a calibration site before the data acquisitions with TerraSAR-X and COSMOS SkyMed SAR. Then, we extracted the RCSs of the calibration targets from the SAR data, and analyzed
the results. The results of these calibration campaigns will help us for the external calibration of the KOMPSAT-5 and other X-band SAR systems.
ACKNOWLEDGEMENTS
The authors would like to thank J-H. Hwang, S-M.
Park (Hongik University) and K-Y. Lee (Korea Aerospace Research Institute) for their help in the data acquisition. This work was supported by the Korea Aerospace Research Institute.
REFERENCE
Buck, C., 2002. ASAR External Calibration. Proc. of the ENVISAT Calibration Review, ESTEC, ESA publication SP-520.
Doring, B., Schwerdt, M., and Bauer, R. 2007.
TerraSAR-X Calibration Ground Equipment. Conference of ITG – Commission on Wave Propagation, Dresden, Germany.
Entekhabi, D., Njoku, EG., and many more, 2004, The hydrosphere state(hydros) satellite mission: An earth system pathfinder for global mapping of soil moisture and land freeze/thaw, IEEE Trans. Geosci. Remote Sensing, 42(10): 2185-2195.
Fritz, T., 2007. TerraSAR-X Ground Segment Level 1b Product Format Specification. http://sss.terrasar-x.dlr.
de/
Lenz, R., Pontes, J., and Wiesbeck, W., 2005. The TerraSAR-X ground calibration system and pattern estimation software. IGARSS, Seoul, Korea, 7, pp. 4894- 4897.
Na, J-H., Oh, Y., 2007. Examination of spatial integration method for extracting the RCS of a calibration target from SAR images. Intern. Symp. Remote Sensing, 1, pp. 540-549.
Sarabandi, K., Pierce, L.E., and Ulaby, F. T., 1992a.
Calibration of a polarimetric imaging SAR. IEEE Trans.
Geosci. Remote Sensing, 30(3), pp. 540-549.
Sarabandi, K, Oh, Y., and Ulaby, F.T., 1992b.
Performance characterization of polarimetric active radar calibrators and a new single antenna PARC design. IEEE Trans, Antennas Propagat., 40(10), pp. 1147-1154.
Ulaby, F.T., Elachi C., 1990. Radar Polarimetry for Geoscience Applications, Artech House, Norwood, MA,USA.
Ulaby, F.T., Moore R.K., and Fung A.K., 1982.
Microwave Remote Sensing, Artech House, Norwood, MA, USA.