RELATIONSHIP BETWEEN FOREST STAND PARAMETERS AND MULTI-BAND SAR BACKSCATTERING
Jung-il Shin*, Jong-suk Yoon, and Kyu-sung Lee
Department of Geoinformatic Engineering, Inha University [email protected] , [email protected]
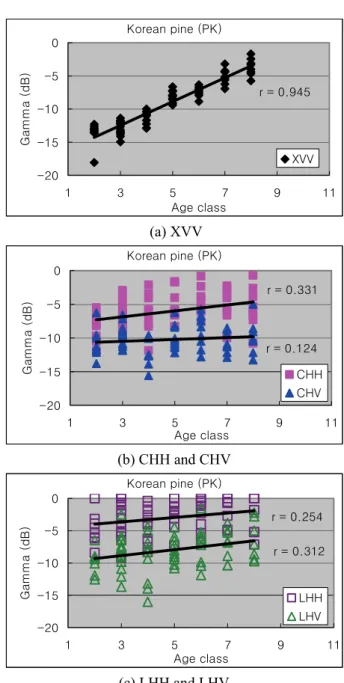
ABSTRACT ... Newly developing SAR (Synthetic Aperture Radar) sensors commonly include high resolution X-band those data are expected to contribute various applications. Recent few studies are presenting potential of X-band SAR data in forest related application. This study tried to investigate the relationship between forest stand parameters and multi-band SAR normalized backscattering. Multi-band SAR data was radiometric corrected to compare signal from different forest stand condition. Then correlation coefficients were estimated between attribute of forest stand map and normalized backscattering coefficients. Although overall correlation coefficients are not high, only X-band shows strong relationship with DBH class than other bands. The signal of C- and L-band is composed of a large number of discrete tree components such as leaves, stems, even background soil. In forest, strength of radar backscattering is affected by complex parameters. Further study might be considered more various forest stand parameters such as canopy density, stand height, volume, and biomass.
KEY WORDS: Synthetic Aperture Radar, Multi-band, Forestry, Signal characteristics
1. INTRODUCTION
Several new space-borne Synthetic Aperture Radar (SAR) sensors are recently developing those are commonly including high resolution X-band. Recently a few studies are presenting potential of X-band SAR data in various applications such as agriculture, marine science, glacier monitoring, even forestry (Baghdadi et al., 2008;
Gade et al., 2008, Tedesco and Miller, 2007; Guglielmetti et al, 2007). Application of SAR data in forestry have been focused on the estimation of forest stand parameters such as canopy height, stand density, volume, and biomass (Neeff et al, 2005; Walker et al., 2007; Ranson et al., 1997). In conventional forest related applications, C-, L-, P-band SAR data were primarily used due to the penetration capability in tree canopy (Henderson and Lewis, 1998). However, SAR signal of each band may have different information because of different volume scattering location. Especially, X-band SAR signal is backscattered on top of the tree canopy (Jensen, 2000).
Backscattering coefficient is the ratio the power of the pulse transmitted and received (CREASO ©, 2007).
Backscattering coefficient is classified by data processing level (Weber and Bodechtel, 1998). Firstly, the beta nought (β
o) is the radar brightness coefficient in slant range. Secondly, the sigma nought (σ
o) is the reflected strength of radar signals in horizontal plane which is significantly affected by incidence angle, wavelength and polarization. Lastly, the gamma (γ ) is the normalized backscattering coefficient by the cosine of the incidence angle. Backscattering coefficient is needed to calibrate for comparison from different sensors, modes and incidence angle (CREASO ©, 2007; Lee, 1997).
Until now, radiometric correction methods are developing for mountainous area and also signal characteristics of SAR data are needed to study in forestry.
In our previous study, we presented potential of multi- band SAR data for classifying forest cover type. As the second stage, this study aimed to investigate the relationship between forest stand parameters and multi- band SAR normalized backscattering. Multi-band SAR data was radiometric corrected to compare signal from different forest stand condition, Then correlation coefficients were estimated between attribute of forest stand and normalized backscattering coefficients.
2. STUDY AREA AND DATA
The study area is a mountainous national forest area near Seoul Metropolitan area, S. Korea. Since the study area has been well conserved by the Korea Forest Research Institute (KFRI), it has sufficient and accurate forest information database to verify samples from SAR data. Dominant tree species are oak (Quercus), larch (Larix leptolepis), and Korean pine (Pinus koraiensis) in 6x10km
2area.
Synthetic Aperture Radar data, SIR-C/X-SAR, was
obtained simultaneously on 3
rdOctober 1994. SIR-C data
(C- and L-band) were obtained with dual-polarized (HH,
HV) mode and X-SAR data were obtained with VV
polarization. All five datasets (XVV, CHH, CHV, LHH
and LHV) were almost identical value of incidence angle
and look directions. Table 1 shows specification of three
data sets over the study area.
Table 1. Specification of SIR-C/X-SAR data.
Sensor SIR-C X-SAR Frequency(GHz) 5.304(C), 1.254(L) 9.602(X)
Polarization HH, HV VV Date/Time(GMT) Oct. 3, 1994 /
04:54:15.473
Oct. 3, 1994 / 04:54:18.240 Line/pixel
spacing(m) 12.5 / 12.5 12.5 / 12.5 Orbital direction Descending Descending Incidence angle at
image center(deg.) 40.3460000 38.9921778
3. METHODS 3.1 Pre-processing of SIR-C/X-SAR data
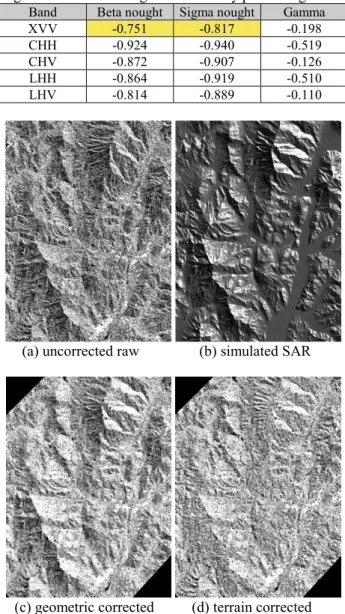
As an initial process, SIR-C/X-SAR data were precisely geometric corrected for radiometric calibration.
Because, side-looking radar image shows extreme terrain effect such as foreshortening and layover. RFM (Rational Function Model) was used for geometric correction with 70 GCPs and RMSE was 2.7pixels (33.75m). RFM is generic sensor model with high order polynomial equation which can be used to universal sensor even though some disadvantages such as low accuracy, instability, uncertainty and complexity (Dowmann and Dolloff, 2000). The simulated SAR image was used to collect GCPs which was generated with DEM, sensor altitude, heading direction and incidence angle information.
The SIR-C/X-SAR data were radiometric calibrated as suggested by the data distributor (DLR and ASI, 1995) to convert pixel’s DN value to backscattering coefficients σ
o(1).
) ) (
) sin(
sin( N K
,0K i
K
I
raw N Ni o i
S