DoP-CPD DECOMPOSITION TECHNIQUE FOR POLARIMETRIC SAR DATA
Kyung-yup Lee1, Yisok Oh2, Youn-Soo Kim3
1Korea Aerospace Research Institute, Daejeon, Korea, e-mails: [email protected] 2Hongik University, Seoul, Korea, e-mails: [email protected] 1Korea Aerospace Research Institute, Daejeon, Korea, e-mails: [email protected]
ABSTRACT: This paper proposes a new decomposition technique for polarimetric synthetic aperture radar (SAR) images. This new decomposition technique is based on the degree of polarization (DoP) and co-polarized phase- difference (CPD) of the measured polarimetric backscattering coefficients. This decomposition technique is compared with the existing three- and four-component decomposition techniques with the ALOS PALSAR full polarimetric L- band data acquired in 2009. It is shown that the new decomposition technique is better or comparable to the existing techniques for the study areas such as sea, bare soil, forest, and urban area.
KEY WORDS: SAR image classification technique, degree of polarization, co-polarized phase difference.
1. INTRODUCTION
Synthetic Aperture Radar (SAR) images are used to remotely sense the characteristics of the Earth surfaces;
that is, forest resources exploration, topographical and geographic surveys, grain yield estimation, artificial structure detection, remote sensing of sea pollutions, monitoring of typhoons, forest fires, or floods, sea state and weather forecasts, polar region exploration, and so forth (Ulaby et al, 1986). As the SAR technology is enhanced, an accurate classification and decomposition of the full-polarimetric SAR images are required. There are various decomposition algorithms for polarimetric SAR images (Ulaby and Elachi,1990; Lee and Pottier, 2009).
The most common decomposition technique for polarimetric SAR images is the model-based decomposition technique (Freeman and Duren, 1998), which had been proposed by Freeman and Durden. Using the polarimetric coherency matrix, the SAR data can be decomposed to three scattering mechanisms; that is, surface, double-bounce, and volume scatterings. Later, Yamaguchi extended the Freeman decomposition to a four-component decomposition for both the covariance and coherency matrices (Yamaguchi, 2005).
In this paper, we propose a simple decomposition technique using the degree of polarization (DoP) and the co-polarized phase difference (CPD) statistics. The DoP is closely related to the scattering mechanisms which represent mixed ratio of volume scattering in total scattering, and the CPD is related to the physical status of a target area which can separate between surface and double-bounce component except volume component in total scattering. The decomposition based on the DoP and CPD which is called DoP–CPD decomposition is introduced in Sec. 2, and the decomposition scheme is verified with SAR images in Sec. 3.
2. DoP-CPD DECOMPOSITION
In general, the scattered electric field Esc is elliptically polarized with complex targets, and can be written as
ˆ ˆ
s s s
x y
E =E x E y+ (1) where x, y denotes h for horizontally polarized wave and v for vertically polarized wave. The complex 2x2 scattering matrix S is defined as in (Sinclair, 1950).
s jk r0 i
hh hv
h h
s i
vh vv
h h
S S
E e E
S S
E r E
⎡ ⎤ − ⎡ ⎤⎡ ⎤
⎢ ⎥= ⎢ ⎥⎢ ⎥
⎣ ⎦
⎣ ⎦ ⎣ ⎦ (2)
The Stokes vector for a partially polarized wave are defined as
( )
( )
2 Re 2 Im
s s s s
h h v v
s
s s s s
s h h v v
s
s s s
h v
s
s s
h v
E E E E
I E E E E
F Q
U E E
V
E E
∗ ∗
∗ ∗
∗
∗
⎡ + ⎤
⎢ ⎥
⎡ ⎤ ⎢ ⎥
⎢ ⎥ ⎢ − ⎥
⎢ ⎥ ⎢ ⎥
=⎢ ⎥==⎢ ⎥
⎢ ⎥ ⎢ ⎥
⎢ ⎥
⎣ ⎦ ⎢ ⎥
⎢ ⎥
⎣ ⎦
(3)
where <···> indicates the ensemble average (Ulaby and Elachi, 1990). For general cases, a partially polarized wave has the following relation:
2 2 2 2
s s s s
I ≥Q +U +V (4) The DoP of the partially polarized wave is defined as in (Ulaby and Elachi, 1990).
2 2 2
s s s
s
Q U V
DoP I
+ +
= (5)
The DoP measures how much the effect of multiple reflections is contained in the target area (Elices and Le Jeune, 1997). Therefore, the DoP could be used as an important factor for classifying classes. For example, the bare surface or buildings has a high value of the DoP because there are only single-bounce or double-bounce scattering, while the forest or pastures have low values of the DoP because it contains various multiple scattering effects. Hence, the DoP is able to be used to decompose the scattering mechanism components from the total power.
The CPD is defined as the ensemble average of the phase difference between the hh- and vv-polarized scattered waves. In the backscattering case, the measured scattering matrix by a polarimetric radar system consists of five quantities; |Shh|, |Svv| and |Shv|, Φc=Φhh-Φvv, and Φx=Φhv-Φvv. The CPD Φc can be written as
* 1
*
Im( )
tan
Re( )
hh vv
c hh vv
hh vv
S S
φ φ φ − S S
⎛ ⎞
⎜ ⎟
= − = ⎜ ⎟
⎜ ⎟
⎝ ⎠
(6)
The CPD φ shows a Gaussian PDF with the standard c deviation and the mean values which depend on the target characteristics. For example, CPD=0° for radar scattering from a flat surface, and CPD=180° for a dihedral-type double-bounce scattering. Otherwise, the CPD has various values depending on the scattering mechanisms, such as single-bounce scattering, double bounce scattering and volume scattering.
The total power Pt can be expressed as
v d s
t P P P
P = + + (7)
where Ps, Pd, and Pv are the scattered powers by single scattering, double-bounce scattering, and volume scattering, respectively. At first, we tried to separate the volume component power from the total power using the DoP, because the DoP can be used as a descriptor for the multiple scattering; that is, the DoP is almost 1 for bare surfaces or building areas where the volume scattering component power is almost zero. On the other hand, when the DoP is under 0.4 for a forest having dense leaves which volume scattering component dominates the total scattering power. The other areas with medium DoP values are assumed to have the volume scattering component powers which are inversely proportional to the DoP. Therefore, we can empirically propose the following relation between the volume scattering component power and the DoP,
(1 )
v t
P = ⋅ −P α (8) where the constant α is defined as
⎪⎩
⎪⎨
⎧
<
− ≥
= 0 DoP 04
4 0 DoP 6
0 4 0 DoP
. for
. . for
α . (9)
The constant α has a value between 0 and 1 which varies linearly in accordance with the DoP value when it has a value between 0.4 and 1.0.
When we take out the volume-scattering component power from the total power using the DoP value, we obtain the rest of the total power might be the sum of the single-bounce and double-bounce scattering powers.
sd s d t
P = +P P = ⋅ (10) P α Then, we can decompose the power in (1) into the surface scattering and the double-bounce scattering components using the CPD. When the CPD has a value near 0°, we can consider that the most power is scattered with the surface scattering mechanism. On the other hand, when the CPD has a value near 180o, we can consider that the most power is scattered with the double-bounce scattering component. Therefore, we can empirically relate the double-bounce scattering and single scattering component powers with the CPD value as
d t 180
P = ⋅ ⋅P α CPD (11) 180
s t 180
P = ⋅ ⋅P α −CPD (12)
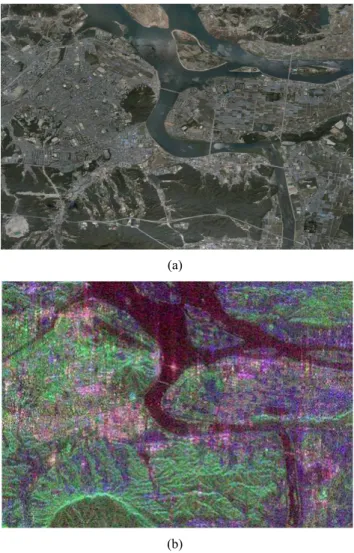
3. VERIFICATION WITH SAR IMAGE DATA For the verification of this DoP-CPD decomposition technique, a polarimetric SAR data set was acquired using the ALOS PALSAR on the area near Choon-chun city, Korea in 2009. Figures 2(a) and (b) show the aerial photo of the area and the result of the DoP-CPD decomposition technique.
The relative strength of each color in the resulting Red- Green-Blue (RGB) images can be related to the relative strengths of the scattering mechanisms. Red color represents the double-bounce scattering power, and green and blue colors represent the volume and surface scattering, respectively, as shown in Fig. 2. Table 1 shows quantitatively the results of the DoP-CPD decomposition technique for the selected areas such as river, bare soil surfaces, forests, and villages. As we expected, the surface scattering component power is dominant for the river and bare soil surfaces, while the volume scattering component power is dominant for the forest area.
For the comparison purposes, in addition to the result of the DoP-CPD decomposition technique, the results of the three-component and four-component decomposition techniques were also obtained as shown qualitatively in Fig. 3 and quantitatively in Table 2.
(a)
(b)
Figure 2. Verification of the new algorithm with the PALSAR image of Choon-chun area; (a) Aerial photo and (b) DoP-CPD decomposition with Ps (blue), Pd (red),
and Pv (green).
TABLE 1.AVERAGED BACKSCATTERED POWERS DECOMPOSED BY THE NEW DOP-CPD DECOMPOSITION
TECHNIQUE
|CPD|
DoP Pt DoP-CPD Decom.
[dB]
[deg.] [dB] Pv Ps Pd
River 15.6 0.93 -4.8 -17.5 -5.6 -17.9 Bare soil 17.7 0.91 -2.5 -14.8 -3.4 -15.4 Forest 83.9 0.64 0.52 -3.2 -5.7 -11.8 Village 160.7 0.89 4.7 -6.4 -0.3 -0.2
For the three-component decomposition technique, the total power Pt is decomposed into three components as
(
1 2) (
1 2)
8 / 3t s d v
s d v
P f f f
P P P
β α
= + + + +
= + +
(13)
where the five unknown coefficients such as
, , , , d v α
s f f
f and β can be computed from the
covariance matrix with a proper assumption.
[ ] ⎥⎥⎥
⎦
⎤
⎢⎢
⎢
⎣
⎡
+ + +
−
+
− +
+
=
v d s v
d s
v
v d s v
d s
f f f f
f f
f
f f f f
f f C
0 3 /
0 3
/ 2 0
3 /
2 0
2
α β
α β α
β (14)
(a)
(b)
Figure 3. SAR image decomposition with (a) three- component and (b) four-component decomposition
techniques with Ps (blue), Pd (red), Pv (green).
The four-component decomposition technique is developed by Yamaguchi et al. (2005) by adding the helix scattering term at the three-component decomposition technique as the fourth component. It was assumed that the scattering matrices, corresponding to a left-helix target or to a right-helix target, have the form:
[ ]
SLH =12⎡⎢⎣1j −j1⎤⎥⎦ and[ ]
SRH =12⎡⎢⎣−1j −−1j⎤⎥⎦ (15)Figure 3 (a) and (b) show the results of the three- and four-component decomposition techniques with RGB color code for the comparison with the DoP-CPD decomposition technique in Fig. 2 (b). Table 2 shows that the new simple decomposition technique shows better or
comparable accuracy with the three- and four-component decomposition technique.
TABLE 2.AVERAGED BACKSCATTER POWERS DECOMPOSED BY THE EXISTING DECOMPOSITION
TECHNIQUES FOR THE SAME AREAS. 3-com. decom. [dB] 4-com. decom. [dB]
Pv Ps Pd Pv Ps Pd Pc
River -13.2 -6.1 -15.3 -12.4 -6.0 -20.3 -17.8 Bare soil -10.3 -4.0 -12.9 -10.0 -3.7 -17.3 -15.2 Forest -0.26 -4.4 -6.38 -0.28 -2.77 -7.42 -6.76 Village -2.6 -0.6 0.2 0.2 0.2 -0.5 -3.9
4. CONCLUDING REMARKS
We proposed a new polarimetric SAR image decomposition technique, and this new technique was verified with ALOS PALSAR data. Also, this technique was compared with the existing three- and four- component decomposition techniques. The DoP-CPD decomposition technique has better accuracy about volume component than three- and four-component decomposition techniques. This technique needs to be more improved for higher accuracy on the relationship between the DoP and the volume power.
5. REFERENCES
Elies P., B. Le Jeune, P. Olivard, J. Cariou, J. Lotrian, 1997. The application of de-polarization analysis to polarimetric characterization and classification of metallic and dielectric samples, J. Phys. D :Appl. Phys.
30 .
Freeman A., S. L. Durden, 1998. A Three-Component Scattering Model for Polarimetric SAR Data, IEEE Trans.
Geosci. Remote Sensong, 36(3)
Lee, J.S., and E. Pottier, 2009, Polarimeric Radar Imaging; From Basics to Applications, CRC Press
Sinclair G., “The transmission and reception of elliptically polarized waves” Proc. IRE, 1950, pp.148-151.
Ulaby, F.T., Moore, M.K., and Fung, A.K., 1986.
Microwave Remote Sensing, Active and Passive, vol. 2, Artech House, Norwood, MA, USA.
Ulaby F. T., C. Elachi, 1990. Radar Polarimetry for Geoscience Applications, Artech House Remote Sensing Library.
Yamaguchi, Y., Moriyama, T., Ishido, M., Yamada, H., 2005. Four-component scattering model for polarimetric SAR image decomposition, IEEE Trans. Geosci. Remote Sensing, 43(8) , pp.1699 - 1706
6. ACKNOWLEDGEMENTS
The authors would like to thank Y. Yamaguchi (Niigata University) and JAXA for their help in the polarimetric SAR data acquisition. This work was supported in part by JAXA in the ALOS second RA (PI No. 393) and in part by the Korea Aerospace Research Institute.