Airborne video as a remote sensor for environmental monitoring of linear infrastructure: a case study and review
Jung-Sup Um*
1)
ABSTRACT
At present, environmental monitoring of linear infrastructure is based mainly on field sampling. The 'integrated mapping' approach has received only limited attention from field scientists. The increased environmental regulation of corridor targets has required remote sensing research to develop a sensor or technique for targets ranging from 15 m to 100 m in swath width. In an attempt to identify the optimal remote sensing system for linear targets, an overview is provided of the application requirements and the technology currently available.
The relative limitation of traditional remote sensing systems in such a linear application is briefly discussed. It is noted that airborne video could provide, in a cost-effective manner, information required for a very narrow and long strip target utilising the narrow view angle and dynamic stereo coverage. The value of this paper is warranted in proposing a new concept of video infrastructure monitoring as a future research direction in the recognition of sensor characteristics and limitations.
Keywords : linear infrastructure, airborne video, environmental monitoring
요 약
도로, 철도, 송전선 등 선형개발 사업에 대한 환경평가과정은 몇 군데의 샘플 조사 결과에 의거하여 전체 대상지역의 실태를 유추하는 현지조사에 의존하는 것이 일반 적으로 정착된 방법이다. 현지조사와 원격탐사를 연계한 통합적인 접근에 의거하여 환경감시를 수행하는 사례를 실무에서 찾아보기 어렵다. 선형개발사업은 산지, 습지, 하천 등 자연환경에서 보전우선순위가 높은 지역을 통과하여 인간 생활권을 연결하는 경향이 있어 통상의 면형개발사업 (예: 공단건설)보다 자연환경에 광역적이고 부정적인
* Department of Geography, Kyungpook National University
영향을 미치기 때문에 각국 정부가 선형개발 사업에 대하여 환경규제를 보다 강화하 고 있는 추세가 두드러지고 있다. 지형적으로 길고(수백 킬로미터) 폭이 좁은(수십∼
수백 미터) 특징을 지닌 선형개발사업의 환경감시를 위한 최적의 원격센서를 개발하 는 것이 시급하게 요청되고 있다. 본 연구에서는 실제 선형개발 사업에서 현지조사를 통해 수집되는 데이터를 분석하고 상응한 정보를 취득할 수 있는 최적의 원격센서를 평가하고자 하였다. 항공 비디오가 저렴한 경비로 실시간 동영상을 제공하고 협각조 망 때문에 선형개발 사업에 최적의 센서로 평가된다. 특별히 본 논문은 센서의 장단 점을 확실히 규명하고 미래의 연구방향에 있어 “비디오 선형 모니터링”이라는 새로운 개념을 제시하였다는 데 그 가치를 지닌다고 하겠다. 궁극적으로 본 논문에서 제안이 비디오 선형모니터링의 가능성에 대해 새로운 전기를 마련할 수 있을 것으로 기대된다.
주요어 : 선행개발사업, 항공비디오, 환경감시
1. Introduction
Environmental monitoring of sites affected by the construction of power plants, transmission lines, gas lines, utility roads and other related linear facilities is essential as it is required by regulatory agencies (Chan, 1984). Utility companies are actively involved in monitoring natural landscape areas which have been disturbed by linear development.
Environmental monitoring of 'corridor-based' facilities is different from the traditional targets of 'area-based' mapping such as industrial complexes, city development, etc.
The corridor itself is linear and generally very long (hundreds or thousands of kilometres) yet very narrow (10-100 metres). The types of facilities which fit these criteria include cross-country pipelines, electric transmission lines and overhead cables, but also include railways, roads, highways, rivers and coastlines.
Railways and transmission lines or pipelines
as well as fibre optic cables are physically quite dissimilar. These facilities do, however, fit the same corridor target for purposes of environmental monitoring. Such corridor-based facilities have a number of characteristics in common: they are expensive to build, expensive to maintain and are subject to strict environmental regulation. All of these facilities do, however, fit the description of a 'corridor' target for purposes of environmental monitoring.
In general, current monitoring programmes for disturbed corridor sites have been based on the attributes of an area at one point in time, reflecting the emphasis on the small number of in-situ data (British Gas, 1988;
Ritchie et al., 1988; Ritchie et al., 1990;
Gimingham et al., 1991; Environmental
Consultants (Alta.) Ltd., 1996; Calvert-Hayes,
1996; Chambers Group Inc., 1997). One of
the major disadvantages of traditional field
monitoring is that it is costly, laborious and
time consuming due to the large number of samples required. Nevertheless, sampling errors can be quite large, especially where the ground vegetation is not uniformly distributed in the field. Furthermore, point observations have the disadvantage that they provide only limited information on historical trends and spatial distribution of the vegetation recovery, which is possible through a comparison of scenes of different dates. Until recently, the investigations of a shifting mosaic and patch dynamics in linear projects remained largely theoretical because the current field survey technique has difficulty in assembling multi-temporal images simultaneously. Present ground-based regular inventories are not practical in terms of either cost or scientific reliability (Um, 1997).
Over the last 20 years, remote sensing research has been primarily used to support global, national or large area applications(Cherrill et al., 1994; Mumby et al., 1999). As a consequence, those charged with more site-specific responsibilities such as the environmental monitoring of a linear development facility have benefited far less from the fruits of that research. It is important to identify an optimal remote sensor best suited to the characteristics of the ground target. Remote sensing techniques, in order to be practical, must be part of a methodology that delivers the most useful information at as low a cost as possible to the potential user.
For the requirements of corridor monitoring, various sensors can be deployed from satellite or aircraft (i.e. from photographic cameras to scanners and complex imaging spectrometers).
Satellite image resolution is currently limited to a minimum mapping unit of 1 m per picture elements (pixels). It would still not be possible to extract detailed information on a 10 m or so wide Right-of-Way (ROW). For this type of narrow target, it will still be necessary to use aerial photography to get fine details at larger scales.
Aerial photography is one of the oldest and most widely applied sensors, capable of recording information in visible and near- infrared wavebands onto photographic film.
Large-scale photography has often been used for this type of application to investigate detailed ground features (Hoover, 1974;
Aird, 1980; Ellis et al., 1984; Jadkowski et al., 1994). However, many inconveniences involved in the collection and processing of data, as well as the cost, have proven to be a barrier to its widespread use for this type of application. If digital remote sensing techniques are applied, the film image and hard copy must be digitized into machine- readable pixels and stored on computer- compatible media such as tape or disks.
The cost of scanning conventional aerial photography is prohibitively expensive for a long linear target. Furthermore, manual handling of hundreds or thousands of hard- copy aerial photographs may prove to be unmanageable.
Traditional sensors are essentially designed
for site-by-site assessment of a specific ground
target. They do little to address the overall
impact of such linear developments on the
landscape. Moreover, if large areas are to be
covered to detect sufficient ground detail, the cost disadvantage will apply to the whole coverage. To fulfill the data requirements of corridor monitoring, it is sufficient to have information along a line in the vicinity of the corridor disturbed. Traditional remote sensing systems have many inherent drawbacks when incorporated within a monitoring programme for a long narrow target. Needless much recording of redundant information in linear applications occurs when using traditional area-based sensors. Clearly, economic factors hinder the use of standard area-based remote sensors in this type of application. This is one reason why most of the information for strip features at lower levels is currently gathered from ground surveys. Corridor monitoring represents a potential application for remote sensing which is largely unfulfilled (Um, 1997).
For environmental monitoring of linear targets using remote sensing techniques, it is necessary to acquire detailed aerial survey data for a narrow corridor regularly to keep the ecological monitoring process at a relatively low cost.
Depending upon the width and length of the corridor, the facility operator should maintain a ROW of 10-100 metres wide and should assess the environmental impact along the route.
The ROW managers are continually being faced with the challenge of monitoring the ROW with reduced budgets and personnel.
It is certain that more linear projects will be implemented in many places in the near future and it is also apparent from recent global trends that concern about the environmental impact of such linear development may be
of world-wide importance.
There is, therefore, an imperative need to identify an appropriate practical technique to monitor the environmental impact along routes. Consequently, major research questions investigated in this paper focused on identifying the optimal remote sensors for environmental monitoring of linear projects.
This is to overcome the apparent scientific gaps that exist between field scientists such as ecologists and the remote sensing experts and to share common interests between the two groups.
2. Environmental significance of linear development projects
The number of linear development projects has increased substantially in the last few decades.
The standard sequence of linear development
projects starts with the preparation of the
working width to limit the contractor's
movement. The working width is prepared to
facilitate easy passage of equipment with top
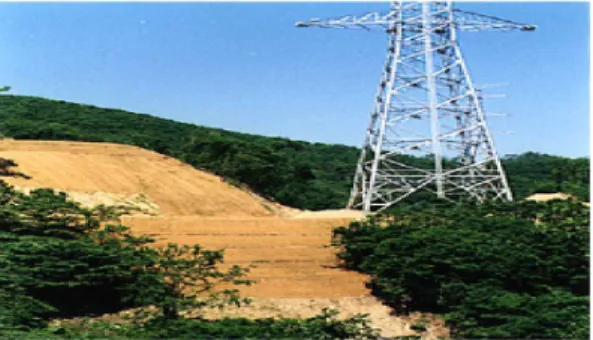
soil removed to one side (Figure 1). Disturbance
of the ground during construction usually results
in a change from the previously vegetated area
to bare ground. The stark linear boundaries
of ROW have the effect of breaking up the
natural habitat visually, immediately after the
disturbance (British Gas, 1988). Because of
this, Ritchie (1989) noted that "the public's
suspicion for a new corridor magnifies itself
in the appearance of the bare ground shortly
after the development projects" (Figure 2).
The assessment of landscape impact by linear projects involves the consideration of numerous habitat types. For example, a pipeline trench may have to be dug through agricultural land, woodland and moorland as well as traverse streams and rivers (Ryder et al., 1989).
In particular, linear developments (including roads, railways, pipelines, canals and overhead transmission lines) tend to occupy the most convenient and short routes between centres of population or sources of supply and demand. Such a prominent impact has made environmentalists more eager to protect all natural ecosystems, which may be disturbed.
Figure 1. A typical linear development site
Figure 2. A typical scene shortly after the linear development projects
Therefore, one of the critical issues influencing the approval of linear development projects by government agencies is a demonstration of how the environmental impact will be evaluated. Recently, there has been a trend toward the strict enforcement of government regulations concerning the environmental impact of linear development projects. In particular, during the past twenty years or so, much public interest has focused on disturbance caused by linear projects. After World War II, rapid economic development provided many advanced countries with extensive linear projects in a comparatively short time. Due to the increased density of linear projects, many of them require EIA by the planning authorities. In fact, 70%
of projects subject to Environmental Impact Assessment (EIA) are classified as linear development (Um, 1997).
For example, under the Electricity and
Pipeline Works Regulations (1990) of the UK,
cross-country pipelines for the transmission
of hazardous materials, when over 16 km
in length, require an EIA for Construction
Authorization from the Secretary of State
for Energy. It is now standard practice to
include provisions for the restoration and
monitoring of pipeline routes at the initial
planning stage within the legal framework
of the UK. In addition, in accordance with such
a legally binding agreement being included
at the planning stage, subsequent monitoring
procedures should be carried out to ensure
the restoration of pipeline routes after pipeline
construction.
When granting Pipeline Construction Authorization (PCA), the Secretary of State requires the developer to agree with the method statement with the relevant local planning authority over environmentally sensitive crossings such as moorlands. The method statement specifies the methods of reinstatement and also the requirements for subsequent environmental monitoring. Based on this statement, the developer undertakes the monitoring of all the environmental effects of the projects and provides the relevant local planning authorities and nature conservation bodies with the monitoring results. Many other countries throughout the world have similar regulations for the restoration monitoring of pipeline routes. For example, in the case of the USA, Calvert-Hayes (1996) states "Our monitoring follows the strict guidelines of the Federal Energy Regulatory Commission (FERC) Upland Erosion Control, Revegetation, and Maintenance Plan and the Wetland and Waterbody Construction and Mitigation Procedures. Both the Plan and Procedures become conditions of approval for the permit to construct issued by the FERC".
3. Present monitoring practice for the disturbed corridor
Traditional methods for environmental monitoring of linear projects can be exemplified by current practice in relation to the Shell
North West Ethylene Pipeline (NWEP), which was constructed in 1992. The NWEP consists of approximately 411 kilometres of 25-cm diameter pipeline. There are several stages of monitoring for reinstatement of a pipeline route, before and after pipeline construction.
The method of monitoring varies depending on the degree of disturbance by pipeline construction and the environmental significance of the site. The Pipeline Construction Authorization (PCA) of the UK requires the monitoring of all environmentally sensitive sites.
Shell monitored the success of reinstatement over the 5-year period following construction.
It also made the results of the monitoring available to the relevant local planning authorities and to the statutory nature conservation organizations: English Nature and Scottish Natural Heritage (RSK Environment Ltd., 1995).
Before the pipeline construction, a series of progressively detailed field surveys were carried out and detailed qualitative ecological data were collected along the pipeline route. These were to be used as a baseline against which the success of reinstatement could be measured along the route and to determine any short or long-term disturbance effects (Shell Chemicals UK Limited, 1992). After the pipeline construction, an annual field survey was carried out in the summer. The results were compiled, with maps drawn to indicate position and extent of the communities. An overall estimate for the revegetation was made by a subjective visual assessment (by percentage).
At certain ecologically important sites, transects
were recorded across the pipeline. These were marked out with one or more wooden stakes, so that recording may be repeated along a similar line in future years. The transects are generally 40 m in length, with the vegetation recorded at 2 m intervals. Records were also made by percentage of cover, in 1 m by 1 m quadrats.
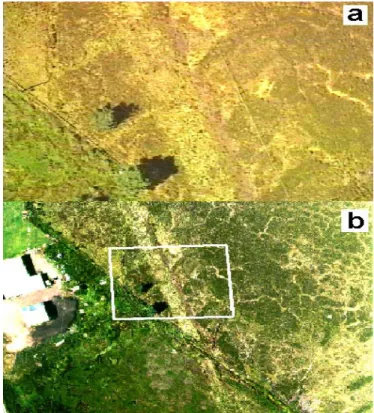
Figure 3. Photograph which shows scene to locate the existing field transect and the following quadrat
recordings of vegetation recovery
Figure 3 is a photograph, which shows the scene to locate an existing field transect, followed by quadrat recordings of vegetation recovery at the Carnwath Moss during the 1995 annual field survey for the NWEP. Information from the vegetation transect recordings was used to compile a set of histograms for vegetation recovery between the disturbed ROW and surrounding undisturbed areas.
The survey results are followed by general comments on the state of the vegetation both inside (20 m) and outside the spread (RSK Environment Ltd., 1995).
Many other countries have similar practices for restoration monitoring of a pipeline route.
In the case of the USA, Calvert-Hayes (1996) states "Our firm monitors the restoration of pipelines during and after construction. Our monitoring is based on field surveys conducted during construction, just after the completion of construction, and yearly". An Interim Resource Management Plan for the San Joaquin Hills Transportation prepared by Chambers Group Inc. (1997) specifies subsequent monitoring of restoration efforts. Plant mixes for revegetating approximately 155 acres of coastal sage scrub were developed from baseline data obtained from transects through representative scrub in the project ROW. In addition, they were supplemented by several non-invasive native pioneer species to assure coverage in the first years of revegetation to aid in soil development and provide erosion control. More than 600 Coast live oak trees in the construction path and the ROW were tagged, measured (diameter at breast height [dbh], height, canopy), and assessed for health, aesthetic value and potential for relocation (Chambers Group Inc., 1997).
As an example from Canada, the Environmental Protection Plan (EPP) for Banff Natural Gas pipeline construction states "Canadian Western Natural Gas Company Limited (CWNG) monitors the pipeline following construction to assess revegetation, erosion and trench subsidence.
Particular attention is being paid after
heavy rains or winds and the first spring after
construction. Weed growth is monitored and corrected, if required. Touch up reclamation is being undertaken on an 'as needed' basis, depending on the problem with touch up seeding where plant establishment has failed.
A rare and endangered plant survey is being undertaken"(Environmental Consultants, Alta Ltd., 1996).
4. On-site observation for the field survey
On-site observation for monitoring methods described in the previous section was carried out. The field work was started with a community-based survey. First, the surveyor looked at the entire vegetation cover at the edge of the survey site by walking around the site. The survey result was recorded based on the surveyor's personal impression from such a community overview and observations from walking over the ROW. The observer could locate himself at any direction or point to get an overall view. Different directions, heights and positions may produce different results for vegetation recovery. The observer could also start to survey, to get an overall view, in a different direction from the previous year.
Furthermore, the surveyor could walk over a well-reinstated site and a badly-recovered site, depending on his mood. It was suspected that the field survey identified the ground condition reliably in that the ability to perceive visual change is strongly influenced by location of survey points and personal subjectivity.
Following the community-based survey, a transect recording was carried out for the site.
It was difficult to locate exactly the same transect line as the previous year (despite the presence of a bare wood stake mark) since the ground is not always flat and recovered vegetation (height of heather: around 30-40 cm) seriously interrupted an accurate measurement of the straight transect stretches. It was noticed that it is easy for whole 40-m transect stretches of 1-m width to be displaced differently leftward or rightward, further or back and forth from the straight line due to vegetation growth and topographic condition change. If the initial transect location is different from the previous year by about 10 to 20cm, then the succeeding quadrats will be placed in the wrong position. It was very difficult to locate the same 1 m by 1 m quadrat in the same place as the previous year. If the initial quadrat begins from a 10-cm displacement, then subsequent quadrats and the entire transect will show totally misleading results for the ROW recovery. If twenty quadrats per transect are considered, then it would be impractical to carry out reliable measurements of vegetation recovery.
It is also desirable that the transect should
be designed to be representative of vegetation
recovery at the survey site. In the field, there
were many places where the fixed transect
had not properly represented the vegetation
recovery of the sites to be surveyed. The
surveyor usually relies on the previous year's
record and tries to increase the percentage
recovery from the previous survey. If the first year survey is not well recorded, then the next survey (which is usually based on the previous one) will give a totally misleading result. Consequently, the results of recovery monitoring mostly show an annual increase according to the RSK ecological survey report.
Generally, such an approach is really not comprehensible in the eye of a remote sensing practitioner. Although the experienced surveyor may have spent a full working day for two communities and three transect recordings at the Carnwath Moss site of the NWEP, it could be argued that this is a waste of time and money.
Ground-based surveys designed to regularly document the size, shape and location of recovered vegetation are not economically feasible. Environmental monitoring of a corridor target first requires clear identification of the level of information necessary to solve the specific field problem. In practice, the most feasible remedial measures based on the field survey results are drainage restoration in waterlogged areas as well as reseeding and spading of bare soil sites, as described in the field ecological monitoring result (RSK Environment Ltd., 1995). Practically, it is very difficult to implement any better means to assist ROW recovery. To meet such requirements for the remedial measures, it is possible that overview monitoring using remote sensing could be successfully designed to show the feasibility of much more cost-effective and reliable information than that of the field
survey. To show annual change of the ROW site recovery, the monitoring result should be able to generate a recovery inventory for the ROW site. It is sufficient for remedial measures in ROW site reinstatement if the inventory includes very simple thematic ground classes such as 'vegetated area/non-vegetated area' and 'waterlogged area'. Such an inventory will easily show inadequately recovered areas which are not well adapted to the surrounding disturbed site and require ROW maintenance.
Based on this, the ROW manager could produce a landscape replanting programme over the ROW. In particular, in 1997 the environmental manager of the NWEP pipeline route (Dr. S. Rapson) showed keen interest to know whether the airborne video could show the percentages of bare ground and biomass as useful indicators of the success of the restoration (which is, in essence, the basic information acquired by statistical classification of digitized video). However, for certain cases, to meet the interests of the ecologist and environmentalist, the inventory would require some more detailed ground classes: recovered heather, moss, revegetated grass and unvegetated peat, bare soil and waterlogged area (Harwood, 1997).
Field monitoring may be conducted just
because it is a legal requirement and to
demonstrate the environmental conservation
will of the oil company for the ecologist and
environmentalist. Detailed documentation of the
ROW recovery status may also create a good
impression with the regulatory agencies. The
funding and number of personnel that were available to do ground monitoring 10 years ago are now a thing of the past. On the other hand, the cost of remote sensing data is getting much cheaper and it is more powerful in terms of information content than before. The collection of field data via remote sensing is, therefore, proposed as a practical alternative. Such an aerial survey should be conducted regularly as an integral part of the ecological monitoring process.
However, even using a remote sensing method for hundreds or thousands of kilometres of pipeline, such monitoring could be quite a costly activity. Consequently, it is necessary to identify an optimal sensor to solve the field data problem in the most cost-effective manner.
5. Limitations of traditional remote sensing techniques in a linear application
The characteristics of linear ground targets are considerably different from the conventional target on which traditional remote sensing has focused. It is necessary to acquire the remotely sensed image from an extremely low altitude, with a narrow angle of view, along a long corridor. It will generally be necessary to acquire imagery with a ground field-of-view (swath width) of less than 100 m for several hundreds of kilometres.
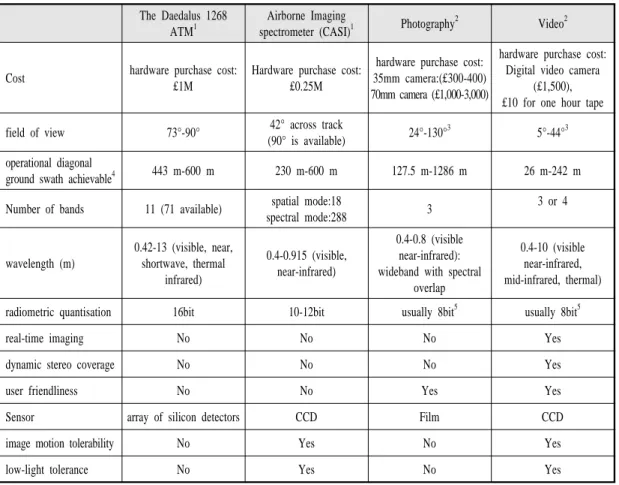
To identify an optimal sensor for this target, four typical airborne sensors have been compared in consideration of the imaging
requirement, based on target characteristics (as presented in Table 1). Satellite remote sensing is ruled out since the ground resolution is too coarse for the task being considered in the corridor target.
The most critical requirement for any remote sensing system is cost-effectiveness.
The cost of inventory mapping with aerial photography is a good standard against which other sensors can be readily compared. To monitor the 400-km length of the corridor with aerial photography (in the case of 36-mm format) of a 100-m swath, the number of photographs required is estimated at 10,000 frames (as shown below*). For multi-year monitoring, the cost would increase several times. It is considered too expensive to monitor a long narrow corridor frequently by aerial photography. Due to such limitations, corridor monitoring using aerial photography has not achieved operational status, although a few previous attempts have been reported (Hoover, 1974; Aird, 1980; Ellis et al., 1984;
Jadkowski et al., 1994).
*NOTE : Estimation of the number of photos required for a 60% stereo overlap - Estimation of along-track ground coverage =
along-track format size of small format photographic camera (36 mm) * flying height (300 m)/focal length (106 mm) = 100 m - Net gain = along-track ground coverage
(100 m) * 4/10 (standard forward overlap 60%) = 40 m
The number of photographs required for
stereo-cover = 400km/40m = 10,000 exposures
The Daedalus 1268 ATM
1Airborne Imaging
spectrometer (CASI)
1Photography
2Video
2Cost hardware purchase cost:
£1M
Hardware purchase cost:
£0.25M
hardware purchase cost:
35mm camera:(£300-400) 70mm camera (£1,000-3,000)
hardware purchase cost:
Digital video camera (£1,500),
£10 for one hour tape
field of view 73°-90° 42° across track
(90° is available) 24°-130°
35°-44°
3operational diagonal
ground swath achievable
4443 m-600 m 230 m-600 m 127.5 m-1286 m 26 m-242 m
Number of bands 11 (71 available) spatial mode:18
spectral mode:288 3 3 or 4
wavelength (m)
0.42-13 (visible, near, shortwave, thermal
infrared)
0.4-0.915 (visible, near-infrared)
0.4-0.8 (visible near-infrared):
wideband with spectral overlap
0.4-10 (visible near-infrared, mid-infrared, thermal)
radiometric quantisation 16bit 10-12bit usually 8bit
5usually 8bit
5real-time imaging No No No Yes
dynamic stereo coverage No No No Yes
user friendliness No No Yes Yes
Sensor array of silicon detectors CCD Film CCD
image motion tolerability No Yes No Yes
low-light tolerance No Yes No Yes
1. For the line scanner and imaging spectrometer, ATM and CASI have been used as examples, which the Natural Environment Research Council in the UK presently uses to provide airborne remotely sensed data for research by environmental scientists (Wilson, 1995).
2. The purchase cost of the photographic camera and video camera were estimated based on the current price of professional grade digital camera.
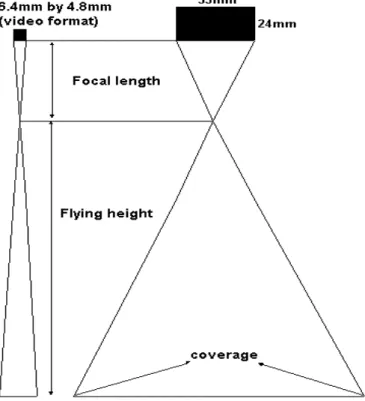
3. A field of view was estimated by assuming a 10 mm-100 mm focal length for 36 mm by 24 mm film sensor and 6.4 mm by 4.8 mm video sensor. [Field of view ((θ) is given by tan (θ/2 = half diagonal length of sensor format/focal length]
4. A diagonal swath width was estimated by assuming a 300-m flying height from the above range of Field of View (FOV).
[Diagonal swath width = 2 * flying height * tan (θ/2 ((: Field of view)]
5. Video and photo images have their own grey levels under analogue imaging conditions. In a digital environment, it all depends on the digitizing device.