AIR-SEA INTERACTION FROM SIR-C SAR SEA SURFACE WIND VECTORS OVER OCEANIC PLUME OFF THE EAST
COAST OF KOREA
Tai-Sung Kim
1and Kyung-Ae Park
1,21Department of Science Education, Seoul National University, , [email protected]
1,2Department of Earth Science Education / Research Institute of Oceanography, Seoul National University, [email protected]
ABSTRACT : Remotely-measured wind vector information have contributed to understand phenomena over ocean but its low resolution makes it difficulty to observe the small scale winds at coastal regions. For these reasons, SAR-derived wind application, which can provide wind vector fields with much higher resolution, has become more important to observe sea surface wind, especially in the coastal regions. In this study, we retrieved the sea surface winds from SIR-C SAR imagery off the East coast of Korea. CMOD4 empirical model was used to calculate wind speed and wind directions by 2D FFT spectrum analysis. To settle 180° ambiguity problem and compare with SAR-derived wind vector results, ECMWF interim reanalysis data were used. As a result, RMS errors for wind speed and wind direction of SIR- C SAR wind retrieval appeared to be 2.07 ms-1 and 25.06°, respectively. Given the high resolution SAR-derived wind field, it was available to observe smaller scale phenomena due to air-sea interaction. On SIR-C SAR wind field results composited with the SST map, wind vectors blown to warmer SST region increase in magnitude and have smaller veering angle, while wind vectors blown to colder SST region decreased in magnitude and have larger veering angle.
KEY WORDS: sea surface wind, air-sea interaction, SIR-C, CMOD4, 2D-FFT spectra, SST, ECMWF 1. INTRODUCTION
Wind vector measurements from space have provided fundamental scientific background to observe and understand oceanographic phenomena. Until now, wind vector information over ocean has been obtained using scatterometer with 25km resolution typically and used to many oceanic applications. But the low spatial resolution of the scatterometer data limits its applicability and usefulness in coastal regions. It, moreover, makes difficulty to interpret small-scale phenomena related to air-sea interaction. For these reasons, nowadays many oceanographic researchers have been increasingly interested in wind vector measurements using SAR, which can provide high resolution wind vector data.
In this study we retrieved SIR-C SAR imagery to extract high resolution wind vector information using CMOD4 and 2D FFT method. This result allows the opportunity to observe the small scale phenomena such as the alternation of wind vectors due to the SST differences. It means that SAR wind field can extend to smaller scale phenomena observations and important information in coastal areas. And then it will contribute to the understanding of atmospheric dynamics, air-sea interaction, and climatology.
2. DATA SET DESCRIPTION
The SAR imagery utilized in this study was collected with the Spaceborne Imaging Radar C-band, SIR-C,
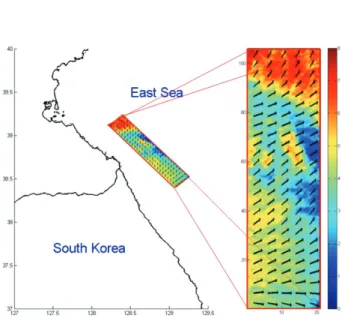
operated during the second space shuttle SIR-C/X-SAR mission (SRL-2) in October 1994. We used SIR-C image close to the east coast of Korea which was taken at 05:31:15(UTC) on October 1 (Fig. 1). This SAR imagery was obtained at C-band (5.8cm wavelength), appropriate to be applied on CMOD4 algorithm, with full- polarization including VV-polarization. To compare with SAR-derived wind vector field results and settle 180°
ambiguity problem when determining wind direction from 2D Fourier transform spectrum, ECMWF Interim reanalysis data was used. ECMWF data include 1.5° grid 10m wind vectors and the time differences with SAR imagery are within 30 minutes. And we also used Sea surface temperature (SST) images off the East sea of Korea obtained from NOAA AVHRR. Using composited Figure 1. Map of study site off the east coast of Korea in the East Sea and SIR-C SAR intensity image (05:31:15 10/01/1994(UTC))
SIR-C SAR wind field results with the SST map, we suggest that the changes of wind vector relate to the SST differences and MABL stability.
3. ESTIMATING WIND VECTOR FROM SIR-C SAR IMAGERY
SIR-C SAR imagery were preprocessed to extract backscattering coefficient( ) values and geocoded. The extracted values were used in estimating the wind directions and then applied on CMOD4 algorithm to obtain wind speed information.
3.1 WIND DIRECTION
For estimating wind speed using CMOD4 algorithm, it is necessary to obtain wind direction previously. While the features related to wind-derived motion can be observed on the SAR images, it is available to extract wind direction information from the SAR imagery directly. Linear features within km-scale are assumed to be caused by Langmuir circulations and aligned with the mean wind direction (Gerling, 1972; Leibovich, 1983;
Kim, 2001). We, therefore, can extract wind direction using 2D- Fourier transform (Fig. 2). As shown in Fig. 2, the peak orientation is perpendicular to the mean wind direction (Shuchman et al., 1994). Despite the wind direction can be extracted directly from the SAR imagery, there is still 180° ambiguity problem. We applied ECMWF data on the estimated results to settle a 180°
ambiguity.
3.2 WIND SPEED
Since the European Space Agency launched the ERS-1 SAR satellite, the C-band geophysical model function relating wind speed and direction to the backscattering coefficient has made great development. There are several well-developed wind retrieval models optimized for the each frequency and polarization mode. Among them, CMOD4 [5], [6] algorithm appropriate for C-band frequency and VV-polarization, of which response to wind speed and direction is well characterized, was used to calculate wind speed from the SAR imagery in this study.
4. RESULTS
4.1 WIND VECTOR FIELD FROM SIR-C SAR IMAGERY
Fig. 3 shows the SIR-C SAR wind retrieval result using CMOD4. In comparison with ECMWF data, RMS errors for wind speed and wind direction are 2.07 ms-1 and 25.06°, respectively. It is assumed that the wind direction estimated from the SAR imagery corresponds to the mean wind vector in this study area overall, but in the small scale the changes of wind direction were appeared and these resulted in the wind speed difference such as shown Figs 4 and 5.
Figure 3. SIR-C SAR wind retrieved by using CMOD4 (Located off the East coast of Korea. 10/01/1994).
Figure 2. Backscattering coefficient image in the study area(Left) and 2D FFT spectrum results. The peak orientation is perpendicular to the mean wind direction.
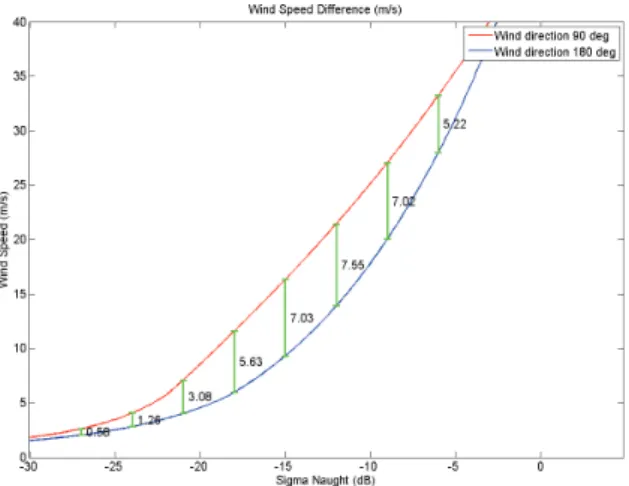
Figure 4. Wind Speed as a function of wind direction and backscattering coefficient value from CMOD4 model.
4.2 AIR-SEA INTERACTION OVER OCEANIC PLUME ON THE SAR-DERIVED WIND FIELD IMAGERY
Given the high resolution SAR-derived wind field, it is possible to observe the smaller scale air-sea interaction phenomena. Fig. 6 shows SIR-C SAR wind field results composited with the SST map. When horizontally uniform wind blows (Large bold arrows on the figure) over the sea surface, it is influenced by SST differences and modified its speed magnitude and veering angle. As the difference between SST and surface air temperature, , becomes increasing, MABL stability is reduced.
Therefore high SST makes MABL destabilized, enhances vertical latent and sensible heat fluxes, and promotes
more active vertical turbulence. This will transmit the higher momentum, amplifying surface winds, and vice versa (Park et al., 2006). As wind vectors blow to warmer SST region (red dashed circle), wind vectors become increasing in wind speed and veering with small angle (6.9°). On the other hand, wind vectors blown to colder SST region (blue dashed circle) decrease in magnitude and have larger veering angle (21.2°) relative to the former.
5. CONCLUSION AND DISCUSSION
SAR-derived wind fields with high resolution shows that it can contribute to the understanding of atmospheric dynamics, air-sea interaction, and climatology. Using SIR-C SAR imagery off the east coast of Korea, we obtained high resolution wind vector information. Based on the wind field, it was possible to observe smaller scale phenomena due to air-sea interaction. It seemed that downwind SST difference altered the stability of the marine atmospheric boundary layer and changed the wind vectors in terms of wind speed magnitude and veering angle.
SAR-derived wind fields provide to the opportunity which observe small scale phenomena, though, its speed magnitude can be influenced by wind direction itself.
Therefore it is necessary to investigate the error characteristics of the wind vectors by comparing the satellite measurements and in-situ measurements based on marine boundary layer dynamics
6. ACKNOWLEGEMENT
This work was supported by the Korea Aerospace Research Institute (KARI).
REFERENCES
Gerling, T. W., 1972. Structure of the surface wind field from Seasat SAR, Journal of Geophysical Research, 91(C2), pp. 2308-2320.
Kim, D. J., 2001. Estimation of sea surface wind vector using space-borne SAR data, Thesis for an M.S. Degree, pp. 21-22.
Leibovich, S., 1983, The form and dynamics of Langmuir circulations, Journal of Fluid Mechanics, 15, pp. 391-427.
Park, K. A., Cornilon, P. and Codiga, D. L., 2006, Modification of surface winds near ocean fronts : Effects of Gulf Stream rings on scatterometer(QuikSCAT, NSCAT) wind observations, Journal of Geophysical Research, 111, C03021.
Figure 5. Plot of wind speed depending on wind direction. Values mean the wind speed difference in m/s.
Figure 6. SIR-C SAR wind field composited on the SST map. Gray arrows indicate the mean wind vector from the climatology. Magnitude of wind vectors is relative to the mean wind vector.
Shuchman, R., Johannessen, J. and Rufenach, C., 1994, Determination of wind speed, wind direction and atmospheric structure using ERS-1 SAR data during NORCSEX’91, IGARSS’94, pp. 537-539.