IEG 환경지질연구정보센터
11
0
0
전체 글
(2) Korean Journal of Remote Sensing, Vol.19, No.5, 2003. commercial, industrial, and other developmental. fusion is one of the possibilities of combining disparate. activities has clearly indicated the urgent need to. images to produce a new data set containing the. manage these coastal areas in an optimal and judicious. characteristics of both input images (Genderen and Pohl,. manner. In the recent years, the optical remote sensing. 1994). The classification can be performed on the fused. systems have proven useful in providing information. image of optical and radar data in order to achieve more. about coastal wetlands and at the same time limitations. accuracy (Ramsey et al., 1998).. in the abilities of such sensors to discriminate wetland. However, for synthetic aperture radar images, speckle. features especially estuarine wetlands from adjacent. noise constitutes one of the main obstacles. Lee (1986). land cover types. More than 20 years of operation of. describes speckle as a “form of multiplicative noise” in. optical remote sensing satellites have shown that it is. the sense that the noise level increases with the. very difficult to obtain cloud free imagery especially in. magnitude of radar back scattering. Speckle is a. coastal regions that are frequently covered by cloud. In. dominating factor in SAR imagery, as is well known. It. contrast, microwaves are capable of penetrating clouds. is less well known that speckle carries valuable. and are actively sent by the antenna. So that the radar. information about the imaging system itself, and about. sensor is independent of weather or day light (Genderen. all digital analysis steps between the original image and. and Pohl, 1994).. any given image product (Henderson and Lewis, 1998).. The launching of ERS-2 SAR radar satellite in 1995. According to Trevett (1986), speckle causes a grainy. was a significant achievement of the earth resources. appearance in SAR images and is an effect of surface. scientific community in these efforts to improve. roughness and system factors on image production. It is. operational monitoring of land cover changes in the. a phenomenon of coherent scattering and accounts for. coastal regions that are frequently affected by cloud. the interference contribution of individual scatters (e.g.. coverage and atmospheric problems. Thus, the. individual leaves from vegetated areas). The interference. combination of microwave and visible and infrared. of these returning waves causes variation in the grey. image data provides valuable tools for mapping such. levels in the adjacent pixels in the image and produces. complex coastal features with high accuracy (Ramsey et. the speckle. Numerous studies investigated various SAR. al., 1998). In the first instance, cloudy areas in optical. filtering techniques applied to spaceborne SAR data. imagery can be replaced by radar data. Secondly, the. (Lee, 1981; Paudyal, Aschbacher, 1993; Hagg and Sties,. optical data can serve substituting no data areas in SAR. 1994). It is therefore essential to remove the speckle. data, i.e., radar shadow. Thirdly, the different data sets. noise before going for any interpretation or classification. provide complementary information due to the. of SAR data by filtering the speckle (Durand et al.,. differences in wavelength and their physical. 1987). This study aims to (1) investigate the. characteristics. While optical data contain the reflectance. complementarity of the use of multisensor data set of. of ground cover in visible and near infrared, the radar is. optical (IRS-1D LISS-III) and microwave (ERS-2 SAR). very sensitive to the surface roughness and moisture. data for mapping the complex coastal mangrove wetland. content of the illuminated targets. Thus the combined. features of southern India, and (2) evaluate the. use of multisensor data visualizes the valuable additional. suitability of certain speckle suppression and data. information of the earth surface features and shows the. integration techniques for improved mapping of the. potential to overcome the cloud cover problems. Image. study region.. –352–.
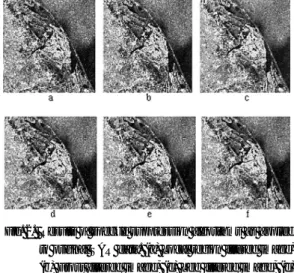
(3) Integration of ERS-2 SAR and IRS-1D LISS-III Image Data for Improved Coastal Wetland Mapping of southern India. 2. Study Area and Data Products. covering an area of approximately 100×100 km2. A subscene covering the study site was selected for. The Pitchavaram coastal wetland is situated on the. detailed analysis (Fig.1b). Similarly, IRS-1D LISS-III. southeastern coastal part of Peninsular India and. image data was acquired on 14 January 1998 and a. represents a heterogeneous mixture of mangrove. subset of the same was analyzed (Fig. 1a). In addition to. wetland ecosystem. It lies between the coordinates of. this study, a field investigation was carried out in. latitude 11˚ 20’ 00’’ N to 11˚ 30’ 00’’ N and longitude. different parts of the study site with the help of global. 79˚ 45’ 00’’ E to 79˚ 51’ 00’’ E. It is an estuarine type of. positioning system (GPS) to collect ground information. mangrove wetland ecosystem, situated at the end of a. about various mangrove communities and other wetland. canal called Uppanar, which is a distributory of the. features so that later the ground and resulting image. Coleroon River. The Pitchavaram mangroves are. information could be compared.. connected to the Vellar estuary in the north and Coleroon estuary in the south along with the Killai. 3. Implementation of Speckle Suppression Algorithms. lagoon by a well-developed backwater system (Fig.1a). This area is often referred to as the Vellar-Coleroon estuarine complex, which includes various wetland features such as mangroves, marsh, scrub, mudflat,. There have been many speckle suppression. aquaculture, lagoon, beach, and other associated land. algorithms developed to reduce the speckle noise in the. cover features such as agricultural vegetation, plantation. radar images. These algorithms are divided into two. and fallow lands, etc. Concerning data products, SAR. main categories that are non-speckle specific (median. image was acquired by the European Space Agency’s. filter) and speckle specific (used in this study). The non-. (ESA) ERS-2 satellite on 19 November 1997 and. speckle specific filters do not explicity take into account. processed to a 16-bit, 3 look standard ERS-2 Precision. the multiplicative noise model of speckles, where as. Image (SAR.PRI) with a pixel size of 12.5m×12.5m,. speckle specific filters do so (Lee, 1986). The use of radar images for further digital interpretation and classification purposes requires the spatial filtering algorithms that preserve edges, textures, and smoothing of homogeneous areas. A few of these filters include: Median filter, Leesigma filter, Lee filter, Gamma filter, Frost filter and Local region filter. Further details about filtering algorithms may be seen in Paudyal and Aschbacher (1993) or Shi and Fung (1994). The above speckle suppression filters were implemented and tested on the subscene of ERS-2 SAR image data of the study site (Fig. 2). The filtered images were examined based on visual and statistical procedures. In general,. Fig. 1. (a) IRS-1D LISS-III (band-321) of the Pitchavaram study site, (b) ERS-2 SAR image, and (c) Rhizophora apiculata.. successful speckle filtering has to accomplish the following requirements: reduction of variance in homogeneous areas, preservation of edges and linear. –353–.
(4) Korean Journal of Remote Sensing, Vol.19, No.5, 2003. antenna pattern of ERS-SAR causes distortions in radar pixel intensities in range directions. Usually, this appears as gradual increase and then decrease in mean column grey-levels. The antenna pattern correction compensates for this non-uniform illumination of the target in range direction. It is, however, SAR PRI product from SAR data archival facilities at National Remote Sensing Agency, India, was delivered system corrected, i.e., the images had been calibrated and corrected for the SAR antenna pattern. Hence, no further corrections for the Fig. 2. Results of speckle suppression algorithms as applied to original SAR data. (a) Local region filtered image, (b) Frost filtered image, (c) Lee filtered image, (d) median filtered image, (e) Leesigma filtered image, and (f) gamma filtered image.. same were made. Subsequently, 16 bit SAR data was linearly rescaled into 8 bit data to be able to compare with 8 bit optical data. The speckle filtering algorithms were then implemented and tested on SAR image data in different levels of processing. After necessary processing was made on the original. features, exclusion of point scatterers, preservation of. SAR data, it needed to be geometrically corrected. spatial variability, avoidance of artifacts (Shanmugam,. because the side looking SAR is highly sensitive to the. 2002). The successful of these filters also depend on the. terrain variations. The filtered images were subjected to. window size and number of iterations.. rectification with respect to topographic map. For rectification of SAR image data with respect to map, sixteen GCPs were selected so that the RMS error. 4. Radiometric and Geometric Correction. achieved was quite satisfactorily less than one pixel (RMS error: 0.868 to 0.892 for all images). A careful selection of same GCPs in all filtered images would. Radiometric and geometric corrections play an. result the above values because the selection of GCPs in. important role in satellite image analysis because of. SAR images is difficult compared to optical image data.. having various radiometric and geometric distortions. Subsequently, the subscene of IRS-1D LISS-III image. being encountered during the image acquisition. The. was then coregistered to the rectified SAR images and. purpose of geometric correction is to compensate for the. resampled to 12.5m. The RMS error was found to be. distortions introduced by certain factors so that the. less than one pixel level in all images. Finally, the. corrected image will have the geometric integrity of a. rectified images were integrated using different fusion. map. This is necessary for many applications before the. techniques and the results were compared based on. information can be extracted. It is understood that the. visual, statistical procedures (Fig. 3). The resulting. satellite data (IRS-1D LISS-III) are radiometrically. images have brought out various mangrove. corrected at ground station. Hence, no further. communities and other wetland features as well while. radiometric correction was made for IRS-1D LISS-III. removing the cloud cover which were present in the. data. In the case of SAR PRI image data, a vertical. optical image data.. –354–.
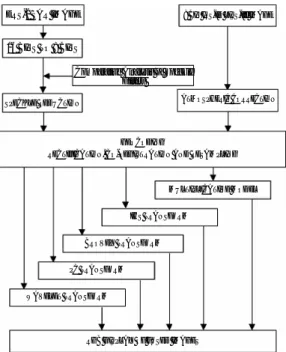
(5) Integration of ERS-2 SAR and IRS-1D LISS-III Image Data for Improved Coastal Wetland Mapping of southern India. ERS-2 SAR IMAGE. are Multiplicative Transform (MT), Principal. 8 BIT IRS-ID LISS-III IMAGE. Component Transform (PCT), Intensity-Hue-Saturation 16 BITS TO 8 BITS. (IHS), Brovey Transform (BT) and Wavelet Transform (WT). The image data sets were subjected to each of the. Comparative Analysis of Speckle Filters. five data fusion techniques. More details concerning. ATMOSPHERIC CORRECTION. SPECKLE REDUCTION. fusion techniques can be found in a referee (Shanmugam, 2002). The results of these techniques. GEOCODING RECTIFICATION, CO-REGISTRATION AND RESAMPLING. were analyzed in order to evaluate their spectral integrity and image-interpretive potential for better information. MULTIPLICATIVE MODEL. extraction about coastal wetland features.. IHS TRANSFORM BROVEY TRANSFORM. 6. Results and Discussions. PC TRANSFORM WAVELET TRANSFORM. The comparative performances of several speckle suppression algorithms and integration techniques were. RGB DISPLAY OF FUSED IMAGES. Fig. 3. Outline of methodology adopted to obtain integrated images using different integration techniques.. investigated based on visual and statistical procedures to assess the potential use of combining optical and microwave image data for mapping the complex coastal. 5. Integration Techniques. wetland features of southern India. Since, the SAR image makes difficult in differentiating number of grey. Integration of data from different sensors has been. levels by human perception, the comparative analysis of. published in several applications (Genderen and Pohl,. speckle filters was studied on the microwave (SAR) data. 1994). The motivation behind data integration is to. alone and on the combined multispectral + SAR data. generate an interpretation of the scene not obtainable. (using brovey transform) for better evaluation (Fig. 4).. with data from single sensor. It is interesting to combine data from optical and microwave sensors, since the optical portion provided information concerning vegetation type, density and moisture content, while the microwave portion furnished information on surface roughness and texture. The overall objective of this study is to determine if there are synergistic effects when digital space borne ERS-2 SAR data combined with IRS-1D LISS-III data. The hypothesis is that the combined data set from optical and microwave sensors would improve the interpretation capability of coastal wetland features compared to utilizing data from either radar or optical data (Ramsey et al., 1998). In the present study, five fusion models attempted for data integration. Fig. 4. Results of speckle filters showing a part of the Pitchavaram study site: (a) Local region filtered SAR+LISS-III (b) Frost filtered SAR+LISS-III (c) Median filtered SAR+LISS-III, (d) Lee filtered SAR+LISS-III, (e) Gamma filtered SAR+LISS-III, and (f) Leesigma filtered SAR+LISS-III.. –355–.
(6) Korean Journal of Remote Sensing, Vol.19, No.5, 2003. Visual analysis reveals that significant improvement was. (Figs. 4b&c). Lee filter (5×5) seems effective in. achieved by all filtering algorithms in terms of. smoothening homogeneous areas of mangrove. enhancing mangrove communities in the fused images.. communities, but is not as effective in conserving. It is, however, that the local region filter (3×3) yields. boundaries and textures (Fig. 4d). Gamma and leesigma. good information about the two mangrove communities. filters (3×3) show adaptivity as well but the textures. (Rhizophora apiculata and Avicennia marina) in. and boundaries of the mangroves are partially blurred. preserving boundaries, textures and in smoothening. (Figs. 4e and 4f). The investigation was also carried out. homogeneous areas of mangroves (Fig. 4a). The frost. on different wetland features by increasing window size. and median filters (3×3) are slightly less superior to. but these features were not clear and highly degraded. local region filter in smoothening homogeneous areas of. with increasing window size. The general statistics of. mangrove communities and conserving their textures. the original, filtered and combined images (SAR+LISS-. Fig. 5. Mean spectral signatures (TD) of five cover types derived from combined SAR and LISS-III images of the Local region filter (a), Frost filter (b), Lee filter (c), Gamma filter (d), Median filter (e), and Leesigma filter (f).. –356–.
(7) Integration of ERS-2 SAR and IRS-1D LISS-III Image Data for Improved Coastal Wetland Mapping of southern India. III) are reported in Table. 1. From this table, it is inferred. speckle as well compared to local region filter while. that the local region algorithm seems to suppress the. there is considerable spectral distortion observed in lee. noise content in the filtered image and is found to. filtered image.. preserve spectral content of the combined image. The. The comparative performance of various speckle. filtered frost and leesigma images appear to preserve. suppression algorithms applied on radar images was also. speckle as of original SAR image while yielding less. investigated using separability analysis in the view of. spectral values in the combined images. Similarly,. classification. In this study, Transformed Divergence. gamma and median filters are not capable in suppressing. (TD) that is a measure of separability is used to. Table. 1. General statistics of the original and processed images of the study site.. Original, filtered and combined Images Original, filtered and combined Images. Layers. Mean. Std.D. 1. 117.5. 17.5. 2. 75.5. 16.9. 3. 85.1. 23.6. ERS-2 SAR image. 1. 190.2. 60.8. Local region filtered SAR image. 1. 188.2. 55.8. Frost filtered SAR image. 1. 189.5. 53.3. Gamma filtered SAR image. 1. 188.8. 48.2. Lee filtered SAR image. 1. 187.5. 51.3. IRS-1D LISS-III image. Lee-sigma SAR filtered image. 1. 189.6. 48.6. Median filtered SAR image. 1. 188.3. 49.2. Local region filtered SAR+LISS-III. 1. 99.2. 53.2. 2. 74.3. 48.4. 3. 88.3. 54.8. 1. 98.8. 51.3. 2. 73. 47.3. 3. 86. 54.3. 1. 97.3. 49.3. 2. 71.5. 45.6. 3. 84.2. 53.5. 1. 98.2. 51.2. 2. 72.7. 47.1. 3. 85.5. 54.3. 1. 97. 48.3. 2. 70.6. 44.7. 3. 83.1. 53. Frost filtered SAR+LISS-III. Gamma filtered SAR+LISS-III. Lee filtered SAR+LISS-III. Lee-sigma filtered SAR+LISS-III. Median filter (SAR+LISS-III). –357–. 1. 98.1. 50.5. 2. 72.3. 46.7. 3. 85.7. 54.1.
(8) Korean Journal of Remote Sensing, Vol.19, No.5, 2003. determine whether the signatures are separable. TD. image of local region for mangroves, marsh and. values have an upper (2000) and a lower bound (0). If. agricultural vegetation are always found to be higher. the calculated divergence is equal to the upper bound,. than the mean spectral values of the images of other. then the signatures can be said to be totally separable in. filters (Fig. 5a). Similarly, frost filter provided moderate. the bands being analyzed. A calculated divergence of. separability for vegetation classes but it yielded poor. zero means that the signatures are inseparable.. separability for mudflat and water classes. The classes. Transformed Divergence (TD) was used over the bands. derived from Lee and Gamma filtered images. 1, 2, and 3 of the combined SAR and LISS-III images.. (combined image) were moderately separable. In. Six coastal landcover features, namely marsh,. contrast, Leesigma filter yielded good separability in. mangrove, mudflat, water, agricultural vegetation and. mudflat and water classes while poor separability was. fallow land were selected for the analysis (Fig. 5).. found in other classes by using this filter. Based on. Transformed Divergence was computed for each of the. visual, statistical and separability analysis, it was. six classes. It was observed that the classes derived from. strongly confirmed that the local region filter performed. the combined image of local region filter yielded highest. well in preserving boundaries, textures, and. separability among the classes compared to other filters.. smoothening homogeneous regions, and yielding good. The mean spectral values obtained from the combined. separability among the classes.. Fig. 6. Results of fusion of IRS-1D LISS-III (band 321) and ERS-2 SAR images of Pitchavaram study site: (a) PCT image, (b) WT image, (c) IHS image, (d) MT image, and (e) BT image.. –358–.
(9) Integration of ERS-2 SAR and IRS-1D LISS-III Image Data for Improved Coastal Wetland Mapping of southern India. Based on the detailed analysis of speckle filtering. vegetation communities while IHS technique has good. algorithms, the local region filter was found to be more. potential in enhancing the mangroves, scrub, mudflat,. appropriate for further analysis of integration. Thus local. plantation, agricultural vegetation and lagoon but it yields. region filtered SAR data was subjected to integration. less information about aquaculture, fallow, sandy area.. with LISS-III data using above fusion techniques. The. Multiplicative transform distorts overall information and. combination of LISS-III + SAR data produced enhanced. the features are highly blurred in the fused image. In. images. The visual comparison shows that a significant. contrast, the wavelet transform does not show any visual. improvement in discriminating mangrove communities. interpretability as can be seen in Fig. 6b. Similarly, the. and other wetland features was achieved in fused images. statistical analysis of original and fused images (made on. compared to either of a single data alone. As shown in. subset images) shows that the brovey transform yields. Fig. 4, the mangrove communities (Rhizophora. satisfactory result in preserving spectral content of the. apiculata- red tone, Avicennia marina- light red tone). original image data while others tend to distort the. are well discriminated in the fused images compared to. spectral integrity of LISS-III image data (Table. 2).. the LISS-III image (Fig. 1a). In Pitchavaram study site,. Although the Wavelet fused image is quite satisfactory in. it can be observed that largely Rhizophora apiculata. preserving spectral content, the visual interpretability of. species located on the margin of lagoon waters are of. this image is poor compared to other techniques. The. relatively low density, with extensive above root. PCT overestimates the statistics of original image data. systems contributing to a large proportion of the. while IHS transform underestimates the original spectral. biomass (Fig. 1c). In contrast, Avicennia marina just. values. The multiplicative transform yields poor spectral. away from the water has lower overall biomass than. information of the original image. The results of the. Rhizophora apiculata but the tree density is much. above procedure showed that the combined use of. greater than Rhizophora apiculata. This is evident in all. different characteristics of the image data by fusion. fused images. The change in tonal variation as seen in. techniques improved the visual and digital. Fig. 4a is mainly due to differing in radar backscatter. interpretability of different mangrove communities and. where the high backscatter from Rhizophora apiculata. other wetland features of the study site.. appears as dark red tone while low backscatter from Avicennia marina appears to be light red. As the C-. 7. Conclusions. band of ERS-2 SAR is highly sensitive to crown characteristics (number, density, size and orientation of leaves) and structure (architecture and heterogeneity), it. Optical (IRS-1D LISS-III) and microwave (ERS-2. results in high backscatter at co-polarization to. SAR) data are complementary to coastal information. increasing biomass of Rhizophora apiculata rather than. extraction and they provided excellent information about. Avicennia marina.. different mangrove communities, degraded mangroves,. It can be observed that among all techniques used in. aquaculture ponds, dry and wet mudflat, reclaimed. this study, the brovey transform appears to be more. mudflat, marsh and associated lagoonal system in the. effective in enhancing mangrove communities, mudflat,. study site. No previous study discriminated Rhizophora. aquaculture, scrub, plantation, agricultural area and. apiculata and Avicennia marina from the remotely. fallow land while reducing cloud cover significantly. sensed data. The fact is that these features are not clearly. compared to other models (Fig. 6). PCT highlights. seen in the original LISS-III image or LISS-III and PAN. –359–.
(10) Korean Journal of Remote Sensing, Vol.19, No.5, 2003. Table. 2. General statistics of the original and fused images of the Pitchavaram study site.. Original and fused images. Layers. Minimum. Maximum. Mean. SD. ERS-2 SAR image. 1. 25. 964. 212.6. 81.6. Filtered SAR image (LRF*). 1. 29. 782. 210.8. 77.3. IRS-1D LISS-III image. Brovey image. IHS image. PCT image. Multiplicative image. Wavelet image. 1. 45. 255. 81. 21.8. 2. 21. 239. 54. 23.6. 3. 12. 217. 76. 39.7. 1. 4. 255. 71.5. 38.8. 2. 8. 227. 53.6. 21.5. 3. 14. 255. 85. 35.3. 1. 1. 38. 7.5. 2. 103. 116. 105.5. 1.3. 4. 3. 1. 27. 7.7. 3.4. 1. 25. 138. 56.3. 11.3. 2. 24. 165. 62.2. 12. 3. 10. 106. 73.5. 7.7. 1. 2. 31. 7.6. 2.7. 2. 2. 31. 6.8. 3.1. 3. 1. 65. 9.8. 5.8. 1. 1. 228. 92.4. 43. 2. 1. 188. 71.2. 37. 3. 1. 220. 91.4. 41.7. *Local region filter, SD- Standard deviation. fused image (Shanmugam, 2002). But, the distribution. LISS-III bands were eventually preserved in the fused. of these communities can be identified and mapped. image of wavelet transform. On the other hand, the. when fusing optical and C-band (low penetration). visual and statistical analyses clearly indicated the. synthetic aperture radar data as demonstrated in the. necessity of performing speckle-filtering algorithms to. previous sections. Based on the visual and statistical. remove the speckle noise from the radar image data. The. analysis, it was observed that the brovey transform. performance of local region filter was found to be. appeared to be good potential of preserving spatial and. superior among all filters adopted in the present study.. spectral information of the original image data. This was. From this study, we conclude with the potential use of. followed by PCT and IHS transforms that enhanced. filtering algorithms and the complementary data sets for. vegetation communities within the study region, but. more accurate mapping of highly fragile coastal. distorted spectral details to the extent. In contrast, the. mangrove wetland ecosystem. The future work will. spatial details were highly degraded in using wavelet. focus on the use of different SAR systems (with multi-. transform and it failed to operate well for cloudy. band and multi-polarizations) for improved. regions. This is due to the fact that the high values in the. understanding of the coastal zone wetland systems.. –360–.
(11) Integration of ERS-2 SAR and IRS-1D LISS-III Image Data for Improved Coastal Wetland Mapping of southern India. Graphics and Image Processing, 17: 24-32.. Acknowledgements. Lee, J. S., 1986. Speckle suppression and analysis for Synthetic Aperture Radar images, Optical. The author would like to thank the Director, National. Engineering, 25: 636-643.. Remote Sensing Agency (NRSA), Dept. of Space, Govt. of India, Hyderabad, for having permitted to carry out. Lundin and Olof Linden, 1993. Coastal ecosystem:. the research work under the guidance of Dr. A.S.. attempts to manage a threatened resource,. Manjunath (Group Head, Data Analysis and Microwave. Ambio, 22(7): 469-473.. Remote Sensing) at NRSA and provided ERS-2 SAR. Paudyal, D. R. and J. Aschbacher, 1993. Evaluation and. data for the same. A part of this research work was also. performance tests of selected SAR speckle. supported by MOST-KORDI, Korea under the contract. filters, Proceedings of the International. M1-0211-00-0037.. Symposium on Operationalization of Remote Sensing, pp.89-96. Ramsey, E. W., G. A. Nelson, and S. K. Sapkota, 1998. Classifying coastal resources by integrating. References. optical and radar imagery and color infrared photography, Mangroves and Salt Marshes,. Durand, J. M., B. J. Gimonet, and J. R. Perbos, 1987.. Vol. II, pp.109-119.. SAR data filtering for classification, IEEE Transactions on Geoscience and Remote. Shanmugam, P., 2002. Multi-sensor image analysis and sub-pixel classification for improved coastal. Sensing, 25(5): 629-637.. mapping, Ph.D Thesis, Anna University,. Genderen, J. L. and C. Pohl, 1994. Image fusion: Issues,. Madras, India.. techniques and application, Proc. of EARSel workshop on Intelligent Image Fusion,. Shi, Z. and K. B. Fung, 1994. A comparison of digital speckle filters. Proceedings of IEEE. Stransbourg, France. Hagg, W. and M. Sties, 1994. Efficient speckle filtering. International Geoscience and Remote Sensing. of SAR images. In Proceedings IEEE. Symposium, Pasadena, California, USA, pp.. International Geoscience and Remote Sensing. 2129-2131. Trevett, J. W., 1986. Imaging Radar for Resources. Symposium, pp. 2140-2142. Henderson, F. M. and A. J. Lewis, 1998. Principles and. Surveys, Series of remote sensing applications,. Applications of Imaging Radar, Manual of. E.C Barrett and L.F. Curtis (editors), Chapman. Remote Sensing, American Society for. & Hall Publishers, ISBN 0-412-25520-0, pp.. Photogrammetry and Remote Sensing,. 3rd. 313.. Ed,. Viles, H. A., 1988. Coastal landform: human activity,. Vol. II. Lee, J. S., 1981. Speckle analysis and smoothening of synthetic aperture radar images, Computer. –361–. geomorphology and ecology in the coastal zone, Physical Geography, 12(2): 293-301..
(12)
수치


관련 문서
processes and tools required to transform enterprise data into information, information into knowledge that can be used to enhance decision-making and to create actionable
Performed by multiplying the spectrum by a low-pass filter and then applying the inverse transform to obtain the
Filtration: Water, nutrients, 1 and wastes are filtered from the glomerular capillaries into the Bowman’s capsule of the nephron. blood leaving
1 John Owen, Justification by Faith Alone, in The Works of John Owen, ed. John Bolt, trans. Scott Clark, "Do This and Live: Christ's Active Obedience as the
Direction of a flux vector: direction of contaminant transport, normal to the frame Magnitude of a flux vector: net rate of contaminant transport per unit area of the
8.4.1 Two-phase equilibrium between the liquid and a solid solution (iii) Extension of tie line cannot intersect the vertex of triangle6. Exception : solubility
Harmful algae SAR (Structure-Activity Relationship) Microcystis aeruginosa, Anabaena flos-aquae Selenastrum capricornutum Microplate assay. Anabaena flos-aquae
선박기본설계개론, 2006.3 Computer Aided Ship Design 2008 Computer Aided Ship Design 2008 –– PART III: Optimization Methods , 2006.3 PART III: Optimization
