Genetic Diversity and Phenetic Relationships of Genus Oxalis in Korea Using Random Amplified Polymorphic DNA (RAPD) Markers
Man Kyu Huh* and Byoung-Ki Choi
Department of Molecular Biology, Dong-eui University, Busan 614-714, Korea
Received March 19, 2014 /Revised July 11, 2014 /Accepted July 16, 2014We evaluated the phenetic relationships within six taxa of genus Oxalis L. in Korea with random am- plified polymorphic DNA (RAPD) markers. Ten primers produced 125 bands for six taxa, and the mean number of bands per primer was 12.5. Across the six taxa, 121 (96.8%) bands were polymorphic, and only four were monomorphic. The mean number of RAPD phenotypes across the six taxa varied from 3.6 (O. stricta and O. corymbosa) to 4.8 (O. corniculata for. rubrifolia). In a simple measure of intra- species variability according to the percentage of polymorphic bands, O. stricta and O. corymbosa ex- hibited the lowest variation (28.8%), and O. corniculata for. rubrifolia showed the highest (38.4%). A mean of 32.7% of the loci was polymorphic within taxa. The total interspecies genetic diversity (H
T) and intraspecies genetic diversity (H
S) was 0.362 and 0.122, respectively. On a per-locus basis, the pro- portion of total genetic variation due to differences among species (G
ST) was 0.663. This indicates that about 66.3% of the total variation was among species. The node of O. stricta and O. corniculata for.
rubrifolia was strongly supported, with a high bootstrap value in the NJ tree and sistered with O.
corniculata. According to RAPD analysis, the number of chromosomes was not congruent with a phe- netic relationship.
Key words : Genetic diversity, genus Oxalis, phenetic relationships, polymorphic, random amplified polymorphic DNA (RAPD)
*Corresponding author
*Tel : +82-51-890-1521, Fax : +82-51-890-1529
*E-mail : [email protected]
This is an Open-Access article distributed under the terms of the Creative Commons Attribution Non-Commercial License (http://creativecommons.org/licenses/by-nc/3.0) which permits unrestricted non-commercial use, distribution, and reproduction in any medium, provided the original work is properly cited.
Journal of Life Science 2014 Vol. 24. No. 7. 707~712 DOI : http://dx.doi.org/10.5352/JLS.2014.24.7.707
Introduction
Oxalis is by far the largest genus in the wood-sorrel family [17]. There are some 850 different species of them, according to the Encyclopedia Britannica [11]. The genus occurs throughout most of the world, except for the polar areas.
Some species of the genus are economically important and cultivated as crops [1]. For example, edible, somewhat sim- ilar to a small potato, have long been cultivated for food in Colombia and elsewhere in the northern Andes Mountains of South America [3]. The leaves of scurvy-grass sorrel (Oxalis enneaphylla) were eaten by sailors travelling around Patagonia as a source of vitamin C to avoid scurvy.
In India, creeping wood sorrel (Oxalis corniculata) is eaten only seasonally, starting December/January. The leaves of common wood sorrel (Oxalis acetosella) may be used to make a lemony-tasting tea when dried.
Classification of species has been at the heart of all plant systematics. The classification process generally tries to ar- range plants into a logical form and doing so to sort the species in some evolutionary manner. Genus Oxalis L. is a taxonomically problematic group because of variations of morphological characters (even within a species) [10] and difficulty in defining specific boundaries [16].
Oxalis L. reaches major diversity in southern Africa [20]
and South America [11] especially in arid desert and moun- tain environments. Members of section Carnosae Reiche are typical components of the flora of the subtropical desert belt along the South American Pacific coast and their diversity is centered in the Atacama coastal desert between 24°S and 30°S with about sixteen endemic species [5, 11]. Within South Africa, the main diversity center is located in the Cape Town-Hottentot’s Holland area, while two secondary centers are found in the Clanwilliams-Nieuwoudtville areas [15].
In Korea, Lee [8] and Lee [9] have provided detailed taxo-
nomic species of the genus Oxalis. Their classifications of
species do not match each other. This was a problem for
many plant sytematicists who had few examples of species
available and used this limited number to describe the
species. Koo et al. [7] have well studied the systematic rela-
tionships of the five Korean Oxalis species by the nucleotide
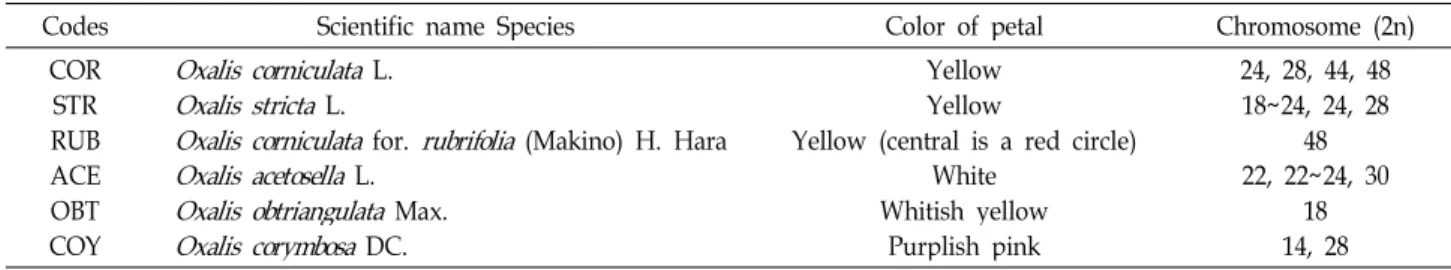
Table 1. The codes, color of petal, number of chromosome, and population location of genus
Oxalis
Codes Scientific name Species Color of petal Chromosome (2n)
COR RUBSTR ACEOBT COY
Oxalis corniculata
L.Oxalis stricta
L.Oxalis corniculata
for.rubrifolia
(Makino) H. HaraOxalis acetosella
L.Oxalis obtriangulata
Max.Oxalis corymbosa
DC.Yellow Yellow
Yellow (central is a red circle) White
Whitish yellow Purplish pink
24, 28, 44, 48 18~24, 24, 28
48 22, 22~24, 30
18 14, 28
sequences (ITS). Their work included a detailed analysis of
nine individuals and an understanding of the phonetic rela- tionships of this genus. However, they omitted one species and it is necessary to perform extensive work to fully under- stand the within species variation.
The random amplified polymorphic DNA (RAPD) mark- ers are DNA fragments from PCR amplification of the ge- nomic DNA’s random segments with single primer of arbi- trary nucleotide sequence [24]. It is a relatively easy, inex- pensive and rapid technique because of its simplicity and requirement for minimal amounts of genomic DNA [13].
Thus, RAPD markers have popular means for identification and authentication of plant and animal species because these marker techniques may generate relatively high numbers of DNA markers per sample and are technically simple [2]. The improved RAPD can improve the resolution of the PCR products and its repeatability [18]. The methods have been used extensively in genetic analysis of prokaryotes and eu- karyotes though the marker system has certain dis- advantages such as reproducibility [6].
In this paper, RAPD analysis of the intraspecific molecular variation patterns of Oxalis in Korea is first presented. We analyzed intra- and interspecific phylogenic relationships within genus Oxalis in Korea and to compare with the results of previous studies of this genus.
Materials and Methods Sample materials
Five species and one form were selected to represent main lineages within genus Oxalis; O. corniculata, O. stricta, O. cor- niculata for. rubrifolia, O. acetosella, O. obtriangulata, and O.
corymbosa (Table 1). Geranium koraiense Nakai was used as an outgroup species in this study.
The genomic DNA of the samples was extracted from fresh leaves using the plant DNA Zol Kit (Life Technologies Inc., Grand Island, New York, U.S.A.) according to the man- ufacturer’s protocol. The concentration of DNA samples was
adjusted to 20 μg/ml.
RAPD analysis
Forty arbitrarily chosen primers of Kit A (OPA-01 to 20) and Kit B (OPB-01 to 20) (Operon Technologies, Alameda, CA) were used. From the primers used for a preliminary RAPD analysis, ten primers of them produced good amplifi- cation products both in quality and variability.
Amplification reactions were performed in 0.6 ml tubes containing 2.5 μl of the reaction buffer, 10 mM Tris-HCl (pH 8.8), 1.25 mM each of dATP, dCTP, dGTP, dTTP, 5.0 pM primer, 2.5 units Taq DNA polymerase, and 25 ng of ge- nomic DNA. The samples amplified for 45 cycles. The ampli- fication products were separated by electrophoresis on 2.0%
agarose gels and 2.5 μl (500 μg/ml) of 100 bp ladder DNA marker (Pharmacia, Piscataway, NJ) was used in the end of the gel for the estimation of fragment size. The gel was stained with ethidium bromide and photographed under UV light using Alpha Image TM (Alpha Innotech Co., USA). All experiments were repeated twice and only reproducible bands were scored for analyses.
Statistical analyses
All RAPD bands were scored by eye and only un- ambiguously scored bands were used in the analyses.
Because RAPDs are dominant markers, they were assumed that each band corresponded to a single character with two alleles, presence (1) and absence (0) of the band, respectively.
The following genetic parameters were calculated using a POPGENE computer program (ver. 1.31) developed by Yeh et al. [25]: the percentage of polymorphic loci (P
p), mean numbers of alleles per locus (A), effective number of alleles per locus (A
E) and gene diversity (H) [14].
Nei's gene diversity formulae (H
T, H
S, and G
ST) were used
to evaluate genetic diversity within and among populations
[14]. H
Tis the expected heterozygosity of an individual in
an equivalent random mating total interspecies. H
Sis the
expected heterozygosity of an individual in an equivalent
Table 2. List of decamer oligonucleotidesutilized as primers, their sequences, and associated polymorphic frag- ments amplified in genus
Oxalis
No. of
primer Sequence (5’->3’) No. of fragments
No. of polymorphic
bands OPA -04
OPA -05 OPA -08 OPA -09 OPA -10 OPA -14 OPA -17 OPB -01 OPB -02 OPB -06
AATCGGGCTG AGGGGTCTTG GTGACGTAGG GGGTAACGCC GTGATCGCAG TCTGTGCTGG GACCGCTTGT GTTTCGCTCC TGATCCCTGG TGCTCTGCCC
1612 1813 17 1311 108 7
1512 1713 17 1211 108 6
Total - 125 121
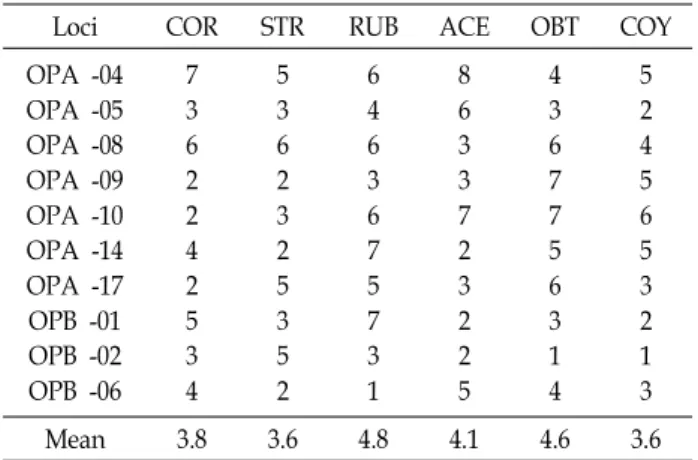
Table 3. The number of RAPD phenotypes in six taxa of
Oxalis
detected by each of the 10 primersLoci COR STR RUB ACE OBT COY
OPA -04 OPA -05 OPA -08 OPA -09 OPA -10 OPA -14 OPA -17 OPB -01 OPB -02 OPB -06
7 36 22 42 53 4
5 36 23 25 35 2
6 46 36 75 73 1
8 63 37 23 22 5
4 36 77 56 31 4
5 24 56 53 21 3
Mean 3.8 3.6 4.8 4.1 4.6 3.6
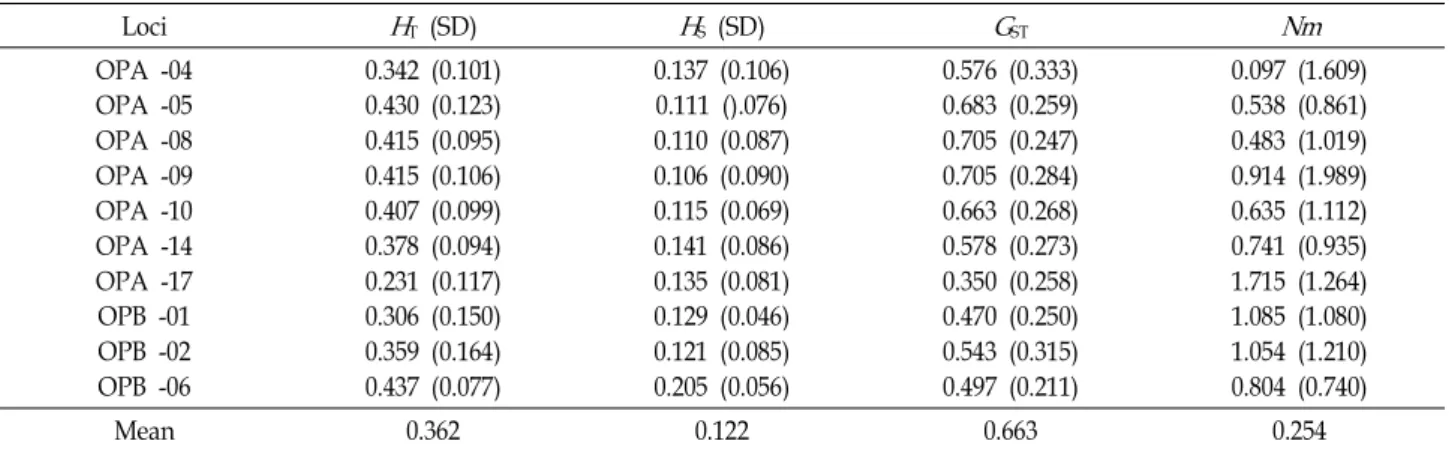
Table 4. Measures of genetic variation for genus
Oxalis
Taxa
N
pP
pA A
EH I
COR RUBSTR ACEOBT COY
38 3648 4146 36
30.4 28.838.4 32.836.8 28.8
1.304 1.288 1.384 1.328 1.368 1.288
1.206 1.191 1.244 1.212 1.216 1.174
0.118 0.110 0.144 0.124 0.131 0.104
0.173 0.164 0.214 0.184 0.198 0.157 Mean 40.8 32.7 1.327 1.207 0.122 0.182 The number of polymorphic loci (
N
p), percentage of poly- morphism (P
p), mean number of alleles per locus (A
), effective number of alleles per locus (A
E), gene diversity (H
), and Shannon's information index (I
).random mating total intraspecies. The G
STcoefficient corre- sponds to the relative amount of differentiation among populations. Furthermore, gene flow (Nm) between the pairs of species was calculated from G
STvalues by Nm = 0.5(1/G
ST- 1) [12].
Nei's genetic identity and genetic distance between geno- types were based on the probability that an amplified frag- ment from one individual will also be present in another [14].
A phenetic relationship was constructed by the neigh- bor-joining (NJ) method [19] in PHYLIP version 3.57 [4] us- ing MEGA5 program [22].
Results
From the ten decamer primers used for a preliminary RAPD analysis, ten primers of them produced good amplifi- cation products for six taxa of genus Oxalis in quality and variability, while the remaining primers did not amplified or showed smear banding patterns (Table 2). Ten primers produced 125 bands for six taxa and mean number of bands per primer was 12.5. A total of 121 (96.8%) of these bands were polymorphic and only four bands were monomorphic across six taxa. The remaining fragments were monomorphic in all taxa.
The mean number of RAPD phenotypes across six taxa varied from 3.6 (O. stricta and O. corymbosa) to 4.8 (O. cornicu- lata for. rubrifolia) (Table 3).
In a simple measure of intraspecies variability by the per- centage of polymorphic bands, O. stricta and O. corymbosa
exhibited the lowest variation (28.8%) and O. corniculata for.
rubrifolia showed the highest (38.4%) (Table 4). A mean of 32.7% of the loci was polymorphic within taxa.
Mean number of alleles per locus (A) ranged from 1.288 to 1.368 with a mean of 1.327. O. corniculata for. rubrifolia showed the highest and O. stricta and O. corymbosa did the lowest. The effective number of alleles per locus (A
E) ranged from 1.174 to 1.244 with a mean of 1.207. The phenotypic frequency of each band was calculated and used in estimat- ing genetic diversity (H) within taxa. As the typical pop- ulations of wild Oxalis were small, isolated, and patchily dis- tributed for natural populations, they maintained a moder- ate level of genetic diversity for polymorphic primers. The total H was 0.122 across species. Shannon’s index of pheno- typic diversity (I) of O. corniculata for. rubrifolia (0.214) was highest of all taxa and O. corymbosa was the second (0.157).
A total genetic diversity value (HT) was 0.362 (Table 5).
Genetic diversity in the within- species (H
S) was low (0.122).
On a per-locus basis, the proportion of total genetic variation
Table 5. Estimates of genetic diversity of genus
Oxalis
Loci
H
T (SD)H
S (SD)G
STNm
OPA -04 OPA -05 OPA -08 OPA -09 OPA -10 OPA -14 OPA -17 OPB -01 OPB -02 OPB -06
0.342 (0.101) 0.430 (0.123) 0.415 (0.095) 0.415 (0.106) 0.407 (0.099) 0.378 (0.094) 0.231 (0.117) 0.306 (0.150) 0.359 (0.164) 0.437 (0.077)
0.137 (0.106) 0.111 ().076) 0.110 (0.087) 0.106 (0.090) 0.115 (0.069) 0.141 (0.086) 0.135 (0.081) 0.129 (0.046) 0.121 (0.085) 0.205 (0.056)
0.576 (0.333) 0.683 (0.259) 0.705 (0.247) 0.705 (0.284) 0.663 (0.268) 0.578 (0.273) 0.350 (0.258) 0.470 (0.250) 0.543 (0.315) 0.497 (0.211)
0.097 (1.609) 0.538 (0.861) 0.483 (1.019) 0.914 (1.989) 0.635 (1.112) 0.741 (0.935) 1.715 (1.264) 1.085 (1.080) 1.054 (1.210) 0.804 (0.740)
Mean 0.362 0.122 0.663 0.254
Total genetic diversity (
H
T), genetic diversity within populations (H
S) proportion of total genetic diversity partitioned among pop- ulations (G
ST), and gene flow (Nm
).Nei’s genetic distance
1.0 0.8 0.6 0.4 0.2 0.0
O. stricta
O. corniculata
for.rubrifolia O. corniculata
O. acetosella O. obtriangulata O. corymbosa Geranium koraience
Fig. 1. A phenogram showing the rela- tionships among eight species of genus
Oxalis
based on data of genetic distance obtained by RAPD.Geranium koraience
is outgroup.Table 6. Nei's genetic identity (above diagonal) and genetic dis- tance (below diagonal) in genus
Oxalis
using RAPD markersTaxa COR STR RUB ACE OBT COY
COR STR RUBACE COYOBT
- 0.192 0.128 0.346 0.501 0.584
0.825 - 0.166 0.297 0.494 0.555
0.880 0.847 0.305- 0.508 0.575
0.708 0.743 0.737 - 0.383 0.467
0.606 0.610 0.602 0.682 0.216-
0.557 0.574 0.563 0.627 0.806 - The taxon codes are the same as Table 1.
due to differences among species (G
ST) was 0.663. This in- dicated that about 66.3% of the total variation was among species. The estimate of gene flow, based on G
ST, was very low among species (Nm = 0.254).
A genetic identity matrix based on the proportion of shared fragments was used to evaluate relatedness among species (Table 6). The genetic identities between species
ranged from a minimum value of 0.557 between O. cornicula- ta and O. corymbosa and the maximum value of 0.880 be- tween O. corniculata and O. corniculata for. rubrifolia. Values of genetic distance were <0.584.
Clustering of taxa using the NJ algorithm was performed based on the matrix of calculated distances (Fig. 1). Three main clades were recognized: (1) O. stricta, O. corniculata for.
rubrifolia, and O. corniculata, (2) O. acetosella, (3) O. obtriangu- lata and O. corymbosa. Phenetic relationships of taxa were related to color of petal, but not numbers of chromosome (Table 1, Fig. 1).
Discussion
In order to further evaluate the suitability of the morpho-
logical characters traditionally used in the taxonomy of
Oxalis, selected morphological characters were mapped onto
the combined plastid rbcL DNA sequence [16]. The evolu-
tionary patterns encountered illustrate that some morpho-
logical characters traditionally used in the classification of Oxalis. For example, morphologies (color of petal, the num- ber of chromosome, the position and shape of ovary, locule number, numbers of ovules per locule and indumentum, the shape of fruit (capsule), the number of seeds, and the pres- ence or absence of hairs on the epidermis of the cotyledons) have been used to separate genus Oxalis.
This finding suggests that morphological evolution of ge- nus Oxalis was complex. In addition, morphological charac- teristics are restricted by their resolving power mainly be- cause of the small number of variables available.
Several species in section Corniculatae share a base chro- mosome number x=5 with species in section Ripariae, while other species in the former have a x=6 [23]. In this study, phenetic relationships of taxa were related to color of petal, but not numbers of chromosome (Fig. 1). It was no one rea- son that the number of chromosome for species were or con- stant (Table 1).
RAPD analysis was applied to estimate the genetic varia- bility in Japanese populations of O. corniculata [21]. They found that about 22% of the total variation was attributed to the variation component among populations. In this study, RAPD variation within species was 33.7%, while 66.3% among species (Table 5). OPA-04-16 locus and OPA-09-03 locus can be recognized as unique locus of O.
corymbosa. Thus these loci can be used distinguish in- troduced species from natural Korean Oxalis species.
In the study with nuclear ribosomal DNA internal tran- scribed spacer sequences (ITS) [7], O. corniculata and O. corni- culata for. rubrifolia were grouped into small clades, while O. acetosella and O. obtriangulata have distinct relationships.
The results by RAPD were not in agreement with results obtained by ITS analysis. This is in agreement with the re- sults of this study. In addition, additional molecular experi- ments such as AFLP (amplified fragment length poly- morphism), microsatellites, and ITS (nuclear ribosomal DNA internal transcribed spacer sequences) are necessary to iden- tify species. Oxalis is a taxonomically problematic group be- cause of variations of morphological characters. Many bota- nists have had difficulty in defining specific boundaries and some have given different scientific names for same species.
It is a problem for classification of Oxalis that plant encyclo- pedias in Korea have not match each other. Hybridization events are taking place in many foreign countries. It is neces- sary to establish the standard taxonomic keys for Oxalis quickly. This study can be contributed in information on the
taxonomic research.
References
1. Bais, H. P., Park, S. W., Stermitz, F. R., Halligan, K. M. and Vivanco, J. M. 2002. Exudation of fluorescent b-carbolines from
Oxalis tuberosa
L. roots.Phytochemistry
61, 539-543.2. Bornet, B. and Branchard, M. 2001. Nonanchored Inter sim- ple sequence repeat (ISSR) markers: reproducible and spe- cific tools for genome fingerprinting.
Plant Mol Biol Rept
19, 209-215.3. Duke, J. A. 2001.
Handbook of Edible Weeds
, pp. 140-141, CRC Press, Florida, USA.4. Felsenstein, J. 1985. Confidence limits on phylogenies: An approach using the bootstrap.
Evolution
39, 783-791.5. Heibl, C. 2005. Studies on the systematics, evolution, and biogeography of
Oxalis
sectionsCaesiae, Carnosae,
andGiganteae
, endemic to the Atacama desert of northern Chile.Diploma thesis, University of Munich, Munich, Germany.
6. Iruela, M., Rubio, J., Cubero, J. I., Gil, J. and Mill, T. 2002.
Phylogenetic analysis in the genus
Cicer
and cultivated chickpea using RAPD and ISSR markers.Theor Appl Genet
104, 643-651.7. Koo, J., Chae, M. S., Lee, J. K. and Whang, S. S. 2007.
Analysis of ITS DNA sequences of Korean Oxalis species (Oxalidaceae).
Korean J Pl Taxon
37, 419-430.8. Lee, T. B. 2003.
Coloured Flora of Korea
, pp. 914, Hyangmoon Publishing Co., Seoul, Korea.9. Lee, Y. N. 2007.
New Flora of Korea
, pp. 885, Kyo-Yak Publishing Co, Seoul, Korea.10. Lopez, A. and Mulgura, M. E. 2011. A new species of
Oxalis
sectionPalmatifoliae
(Oxalidaceae) from southern Argentina.Phytotaxa
33, 41-45.11. Lourteig, A. 2000.
Oxalis
L. SubgénerosMonoxalis
(Small) Lourt.,Oxalis
xTrifidus
Lourt.Bradea
7, 201-629.12. McDermott, J. M. and McDonald, B. A. 1993. Gene flow in plant pathosystems.
Ann Rev Phytopathy
31, 353-373.13. Micheli, M. R., Bova, R., Pascale, E. and Ambrosio, E. 1994.
Reproducible DNA fingerprint with the random amplified polymorphic DNA (RAPD) method.
Nucleic Acids Res
22, 1921-1922.14. Nei, M. 1973. Analysis of gene diversity in subdivided populations.
Proc Natl Acad Sci USA
701, 3321-3323.15. Oberlander, K. C., Dreyer, L. L. and Esler, K. J. 2002.
Biogeography of
Oxalis
(Oxalidaceae) in South Africa: a pre- liminary study.Bothalia
32, 97-100.16. Obone, C. 2005. The systematic significance of the fruit and seed morphology and anatomy in selected
Oxalis
L.(Oxalidaceae) species, Master dissertation, Stellenbosch University, Stellenbosch, South Africa.
17. Radford, A. E., Ahles, H. E. and Bell, C. R. 1964.
Manual of the Vascular Flora of the Carolinas,
pp. 648, Chapel Hill, NC: University of North Carolina Press.18. Ramos, J. R., Telles, M. P., Diniz-Filho, J. A., Soares, T. N., Melo, D. B. and Oliveira, G. 2008. Optimizing reproduci-
초록:RAPD마크를 이용한 한국 내 괭이밥속 식물의 유전적 다양성과 표현형 관계 허만규*․최병기
(동의대학교 분자생물학과)
RAPD마크를 이용한 한국 내 괭이밥속(Oxalis L.) 식물의 유전적 다양성과 표현형 관계를 평가하였다. 10개의 시발체로 125개의 밴드를 얻었으며 시발체당 12.5개였다. 이들 밴드 중 121개(96.8%)는 다형성을 나타내었으며 단
지 4개만 단형성을 나타내었다. 6개 분류군에서 RAPD 표현형의 평균은 3.6개(선괭이밥, 괭이밥)에서 4.8개(붉은괭
이밥 )였다. 종간 변이에서 선괭이밥과 자주괭이밥이 가장 낮은 변이를 나타내었으며(28.8%), 붉은괭이밥이 가장
높은 변이를 나타내었다 (38.4%). 분류군 내 대립유전자좌위는 평균 32.7%였다. 종 간 전체 유전적 다양도와 종
내 유전적 다양도는 각각 0.362와 0.122였다. 종간 분화에 근거한 전체 변이의 몫(G
ST)은 0.663이였다. 이는 전체
변이의 66.3%는 종간에 있음을 나타낸다. NJ tree에서 선괭이밥과 붉은괭이밥의 분지군은 높은 지지도를 가지며
괭이밥과 자매군을 형성하였다 . 염색체의 수와 RAPD의 표현형적 관계와 일치하지 않았다.
bility evaluation for random amplified polymorphic DNA markers.
Genet Mol Res
7, 1384-1391.19. Saitou, N. and Nei, M. 1987. The neighbor-joining method:
A new method for reconstructing phylogenetic trees.
Mol Biol Evol
4, 406-425.20. Salter, T. M. 1944. The genus
Oxalis
in South Africa: a taxo- nomic revision.J South African Bot Suppl
1, 1-355.21. Shibaike, H., Ishiguri, Y. and Kawano, S. 1997. Genetic var- iation and relationships of Japanese populations of
Oxalis corniculata
L. (Oxalidaceae) detected by random amplified polymorphic DNA (RAPD).Plant Species Biol
12, 25-34.22. Tamura, K., Peterson, D., Peterson, N., Stecher, G., Nei, M.
and Kumar, S. 2011. MEGA5: Molecular evolutionary genet- ics analysis using maximum likelihood, evolutionary dis
tance, and maximum parsimony methods.
Mol Biol Evol
28, 2731-2739.23. Vaio, M., Gardner, A., Emshwiller, E. and Guerra, M. 2013.
Molecular phylogeny and chromosome evolution among the creeping herbaceous Oxalis species of sections Corniculatae and Ripariae (Oxalidaceae).
Mol Phylogenet Evol
68, 199-211.24. Williams, J. G. K., Kubelik, A. R., Livak, K. J., Rafalski, J.
A. and Tingey, S. V. 1990. DNA polymorphisms amplified by arbitrary primers are useful as genetic markers.
Nucleic Acids Res
18, 6531-6535.25. Yeh, F. C., Yang, R. C. and Boyle, T. 1999. POPGENE Version 1.31, Microsoft Windows-based Freeware for Population Genetic Analysis. University of Alberta, Alberta.