Genetic Diversity and Population Structure of the Scallop Patinopecten yessoensis in Korea, China, and Japan by Random Amplified Polymorphic DNA Markers
Myung-Mo Nam
1, Chu Lee
1, Tae Seok Moon
1and Man Kyu Huh
2*
1
Aquaculture Industry Division, East Sea Fisheries Research Institute, Gangneung-si, Gangwan-do 210-861, Korea
2
Department of Molecular Biology, Dongeui University 995 Eomgwangno, Busanjin-gu, Busan 614-714, Korea
Received January 31, 2012 /Revised March 9, 2012 /Accepted March 15, 2012Sixty individuals of the scallop Patinopecten yessoensis (Genus Pecten) were sampled to examine the genetic diversity and population structure of this species. Random amplified polymorphic DNA (RAPD) identified 109 genotypes and produced 79 polymorphic loci (72.8%). Total genetic diversity values (H
T) and interlocus variation in the within-population genetic diversity (H
S) were 0.254 and 0.178, respectively. On a per-locus basis, the proportion of total genetic variation due to differences among populations (G
ST) was 0.299. This indicated that about 70.1% of the total variation was within populations. The unique loci and bands of P. yessoensis were shown in only one population among the three countries. RAPD markers were very effective in classifying the natural population levels of P. yessoensis in Korea, China, and Japan. In addition, insights into the relative gene diversity among and within populations of P. yessoensis would be useful in breeding and for the development of strat- egies for animal genetic resources.
Key words : Random amplified polymorphic DNA (RAPD), genetic diversity, Patinopecten yessoensis
*Corresponding author
*Tel:+82-51-890-1521, Fax:+82-51-890-1529
*E-mail : [email protected]
Introduction
Bivalves comprise 30,000 extant species, constituting the second largest group of mollusks. However, limited genetic research has focused on this group of animals so far, which is, in part, due to the lack of genomic resources. Patinopecten (Mizuhopecten) yessoensis (Yesso scallop, Giant Ezo scallop, Ezo giant scallop) is a species of scallop and one of marine bivalve mollusks in the family Pectinidae. Its name Yesso/Ezo refers to its being found north of Japan. The Japanese scallop, P. yessoensis is a cold-tolerant species in- habiting coastal waters of the northern islands of Japan, the northern part of the Korean Peninsula, and Russian Primorye, Sakhalin and possibly as far north as the Kamchatka Peninsula and the Aleutian Islands [7].
This species is aqua-farmed in China, South Korea, Japan, and Russia, with over 1,400,000 tones worth over US$373 million harvested in 2007 [4]. This commercially valuable Pacific Asian low-boreal scallop species supported sub- stantial fisheries until the 1930s; then stocks diminished mainly through over-exploitation. Capture fisheries pro- duction appears to have peaked in the mid-1930s when 80,000 tones (shell-on) were landed in Japan
(http://www.thefishsite.com/articles). At about the same time, the Russian Yesso scallop population along the coast of Primorye was estimated at about 40 million, inhabiting an area of about 16,000 ha (http://www.thefishsite.com/ar- ticles). Regional catches declined dramatically thereafter, falling to 6,000 tones in Japan in 1968. The development of off-bottom culture, supported by wild seed capture after 1945 led to a sustained upsurge in production, which con- tinued until the year 2000. Since then annual production has stabilized at 1.1-1.2 million tones. China and Japan are the major producers, together accounting for over 1.1 million tons in 2003 (http://www.fao.org/fishery/culturedspecies).
The scallop is an economically important species, partic- ularly in Japan, where it is mainly cultured in Hokkaido prefecture, and the production reached 287,000 metric tons in 2005 [8].
Many megabenthic species living in soft sediment exhibit contagious distributional patterns, grouping together in large patches or beds. However, their spatial distribution tends to be more dispersed or random within patches [1].
Analysis of geographic distribution requires precise esti-
mates of localities and genetic diversity that are also neces-
sary in the management of this edible resource. Although
there are several studies on distribution and population esti-
mates of a number of scallop species [2,9,12], little work has
been done on P. yessoensis.
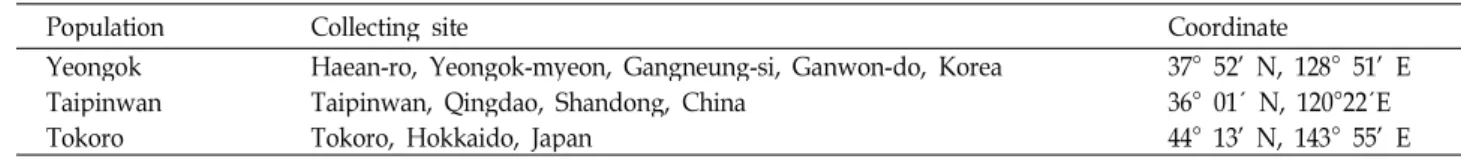
Table 1. Accessions used in the molecular study of the
Patinopecten yessoensis
including population locationsPopulation Collecting site Coordinate
Yeongok Haean-ro, Yeongok-myeon, Gangneung-si, Ganwon-do, Korea 37° 52' N, 128° 51' E
Taipinwan Taipinwan, Qingdao, Shandong, China 36° 01′ N, 120°22′E
Tokoro Tokoro, Hokkaido, Japan 44° 13' N, 143° 55' E
In this study, three populations of P. yessoensis from Korea, China and japan were analyzed for RAPD (random amplified polymorphic DNA) markers. RAPD assay has been useful in determining genetic relationships among closely related species [13]. RAPD analysis is quick, robust, requires minimal preliminary work [11].
However, the genetic diversity and population structure of P. yessoensis in East Asia has not been studied. The basic question is to detect the identification of cultivated pop- ulations using RAPD makers.
This study was carried out to examine three populations of P. yessoensis in order to evaluate genetic diversity and population structure in this species.
Materials and Methods DNA extraction and RAPD procedure
The matured scallops are captured by collectors sus- pended in mid water in June when fully developed larvae are abundant. Sixty individuals of P. yessoensis were sampled from three natural populations (Table 1). The distance be- tween the selected individuals was about 20 m to avoid in- cluding individuals emanating from the same lineage.
Samples were labeled by removing a portion of the fresh foot. DNA was extracted from tissues of samples with the DNA Zol Kit (Life Technologies Inc., Grand Island, New York, USA) according to the manufacturer’s protocol.
RAPD analysis was performed using 60 different 10-base oligonucleotide primers (OPA-01~20, OPB-01~20, and OPC-01~20, series) purchased from Operon Technologies (Alameda, CA). A mixture contained 20 ng of template DNA, 0.5 pmol of a random primer, 10x PCR buffer (20 mM Tris-HCl pH 8.4, 50 mM KCl), 3.0 mM MgCl
2, 2.5 μM each dNTP, and 1.0 U Taq DNA polymerase. Amplification was performed in a Gene Amp PCR System 9700 (Perkin Elmer–
Applied Biosystems, Foster City, CA), which was pro- grammed for initially denatured at 94℃ for 30 sec, followed by 40 cycles of 40 sec of denaturation at 94℃, 40 sec of an- nealing at 40℃ and 60 sec of primer extension at 72℃, then finally incubated at 72℃ for 7 min. A 100 bp ladder DNA
marker was used in the end of gels for the estimation of fragment size. Because RAPD markers had a disadvantage of reproduction, all experiments were done twice.
The amplification products were separated by electro- phoresis on 1.5% agarose gels, stained with ethidium bro- mide, and photographed under UV light using Alpha Image TM (Alpha Innotech Co., USA).
Statistical analyses
All RAPD bands were scored by eye and only un- ambiguously scored bands were used in the analyses.
Because RAPDs are dominant markers, they were assumed that each band corresponded to a single character with two alleles, presence (1) and absence (0) of the band, respectively.
Loci were named based on the primer and observed band size.
The following genetic parameters were calculated using a POPGENE computer program (ver. 1.31) developed by Yeh et al. [19]: allele frequencies, the percentage of poly- morphic loci (P
p), mean numbers of alleles per locus (A), effective number of alleles per locus (A
E), gene diversity (H), and Shannon’'s index of phenotypic diversity [6].
The estimation of genetic similarity (GS) between geno- types was based on the probability that an amplified frag- ment from one individual will also be present in another.
GS was converted to genetic distance (1-GS). Homogeneity of variance among accessions was tested by Bartlett’s statistics.
The Mantel test was examined the correlation between the matrix of genetic distance and spatial distance within a site.
A genetic relationship was constructed by the neighbor joining (NJ) method [14] using the NEIGHBOR program in MEGA5 [16].
Results
From the sixty decamer primers used for a preliminary
RAPD analysis, eleven primers of them produced good am-
plification products both in quality and variability (Table 2).
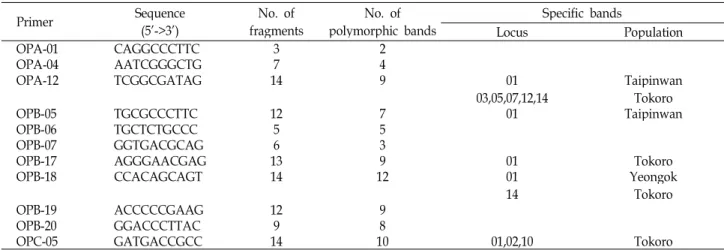
Table 2. Lists of decamer oligonucleotides utilized as primers, their sequences, and associated fragments amplified in
P. yessoensis
Primer Sequence
(5’->3’) No. of
fragments No. of
polymorphic bands Specific bands
Locus Population
OPA-01 CAGGCCCTTC 3 2
OPA-04 AATCGGGCTG 7 4
OPA-12 TCGGCGATAG 14 9 01
03,05,07,12,14 Taipinwan Tokoro
OPB-05 TGCGCCCTTC 12 7 01 Taipinwan
OPB-06 TGCTCTGCCC 5 5
OPB-07 GGTGACGCAG 6 3
OPB-17 AGGGAACGAG 13 9 01 Tokoro
OPB-18 CCACAGCAGT 14 12 01
14 Yeongok
Tokoro
OPB-19 ACCCCCGAAG 12 9
OPB-20 GGACCCTTAC 9 8
OPC-05 GATGACCGCC 14 10 01,02,10 Tokoro
Table 3. Measures of genetic variation for
P. yessoensis
. The number of polymorphic loci (N
p), percentage of polymorphism (P
p), mean number of alleles per locus (A
), effective number of alleles per locus (A
E), gene diversity (H
), and Shannon's information index (I
)Population
N
pP
pA A
EH I
Yeongok 45 41.3 1.413 1.314 0.174 0.252
Taipinwan 54 49.5 1.495 1.290 0.169 0.254
Tokoro 55 50.5 1.505 1.342 0.192 0.282
Mean 51.3 47.1 1.471 1.315 0.178 0.263
Species 79 72.5 1.725 1.440 0.254 0.379
Fig. 1. DNA bands obtained from
P. yessoensis
amplified with OPA-12 primer. M: Molecular weight of standard.For the sixty samples, these eleven primers produced 109 scorable bands, 79 of which were polymorphic (85.5%). Fig.
1 showed the amplified products of the primer OPA-11.
The unique loci and bands of P. yessoensis were shown in only one population among three countries (Fig. 2). The unique multilocus genotypes which were not share with oth- er populations were two in Korean population. The unique multilocus band which was not share with other populations and other animals within same population was one in the Korean population (Table 2). Chinese unique loci and bands were three and two, respective. Japanese unique loci and bands were ten and four, respective. These results were very informative to identify of populations of P. yessoensis.
Fig. 2. Unique loci and bands of
P. yessoensis
were shown in only one country among three countries. Locus: the unique locus is shown only one population which is not share with other populations. Unique: the unique band is shown only one animal which is lacked other animals within same population as well as other populations.Across populations, the average number of alleles per lo-
cus (A) was 1.513, ranging from 1.413 to 1.505 (Table 3). The
effective numbers of alleles per locus (A
E) at the species (A
ES)
and the population levels (A
EP) were 1.440 and 1.315,
respectively. Mean genetic diversity within populations was
0.178. In particular, the Japanese population had the highest
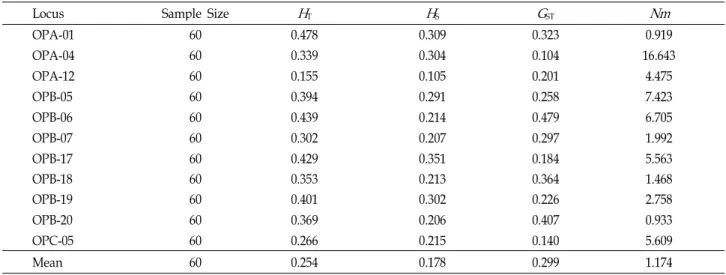
Table 4. Estimates of genetic diversity of
P. yessoensis
. Total genetic diversity (H
T), genetic diversity within populations (H
S), the proportion of total genetic diversity partitioned among populations (G
ST), and gene flow (Nm
)Locus Sample Size
H
TH
SG
STNm
OPA-01 60 0.478 0.309 0.323 0.919
OPA-04 60 0.339 0.304 0.104 16.643
OPA-12 60 0.155 0.105 0.201 4.475
OPB-05 60 0.394 0.291 0.258 7.423
OPB-06 60 0.439 0.214 0.479 6.705
OPB-07 60 0.302 0.207 0.297 1.992
OPB-17 60 0.429 0.351 0.184 5.563
OPB-18 60 0.353 0.213 0.364 1.468
OPB-19 60 0.401 0.302 0.226 2.758
OPB-20 60 0.369 0.206 0.407 0.933
OPC-05 60 0.266 0.215 0.140 5.609
Mean 60 0.254 0.178 0.299 1.174
Table 5. Genetic identity (upper diagonal) among populations of
P. yessoensis
and genetic distances (low diagonal) based on RAPD analysisCountry Yeongok Taipinwan Tokoro
Yeongok - 0.868 0.851
Taipinwan 0.141 - 0.865
Tokoro 0.162 0.145 -
expected diversity (H=0.192); the Chinese population, the lowest (0.169). Mean Shannon's information index (I) was 0.263, ranging from 0.251 to 0.282.
Total genetic diversity values (H
T) and interlocus varia- tion in the within-population genetic diversity (H
S) were 0.254 and 0.178, respectively (Table 4). On a per-locus basis, the proportion of total genetic variation due to differences among populations (G
ST) was 0.299. This indicated that about 29.9% of the total variation was among populations. These values indicate that most of the genetic diversity of P. yes- soensis is found within populations and there is a little among-population differentiation. The estimate of gene flow, based on G
ST, was slightly low among populations of P. yes- soensis (N
m=1.174).
Values of genetic distance (D) were <0.162 (Table 5).
Genetic identity values among pairs of populations ranged from 0.851 to 0.868.
The Mantel test was used to test for correlations between the matrix of genetic diversity and spatial distance. Genetic diversity correlated with spatial distance in P. yessoensis populations.
Clustering of accessions was performed based on the matr ix of calculated distances using the NJ algorithm (Fig. 3).
Yeongok Taipinwan Tokoro
0.4 0.3 0.2 0.1 0.0
Fig. 3. A phenogram showing the relationships among three populaions based on data of genetic distance obtained by RAPD.
In dendrogram, all populations were well separated from each other. Thus, RAPD markers are very effective in classi- fying natural population levels of P. yessoensis in East Asia.
Korean population was similar to Chinese population and sistered to Japanese population.
Discussion
Three P. yessoensis populations with 60 individuals in-
cluded 109 genotypes, 13 of which were restricted to a single
population. Three multilocus genotypes were shared by
more than one animal within a population (Fig. 2). Because
clustering of P. yessoensis is considered mainly sexual re- production, it is expected that the shared genotypes among individuals at a long distance is the result of sib lines by random mating. Unlike many species of scallop, sexes are separate with hermaphrodites rarely observed [10]. Yesso scallops are protandrous hermaphrodites maturing initially as males and changing sex to female as they age [10].
Spawning occurs in spring as water temperature rises and reaches 7-12°C [15]. Males dominate in younger year classes and females in older year classes. Females of 12-15 cm shell height produce 8-18 million eggs.
In RAPD analysis, P. yessoensis maintains a higher than average level of genetic diversity (Table 3). The same trends are observed at other genetic parameters such A and A
E. Thus, the high genetic diversity resulted from outcrossing.
The results were consistent with other scallops. The mean H with microsatellite markers and the haplotype diversity with mitochondrial markers were at high levels in all pop- ulations examined [8]. Hence the likelihood of a parent pro- ducing an identical offspring should increase the probability of identical genotypes from independent sexual events.
At natural populations, P. yessoensis could not be respon- sible for long distance dispersal events. It is expected the sperms are disperse only a short distance from the parents, producing a patchy distribution. The Mantel test supported this by showing correlation between genetic distance and spatial distribution. The data are consistent with the dis- persal of spat being an important factor in the population structure of this species. It is possible that some of these disjunctive identical genotypes were formed by neighboring individuals.
In 1982, P. yessoensis were first introduced into China from Japan by the Marine Fishery Research Institute of Liaoning province to increase scallop cultivation in the northern parts of the Chinese coast [18]. As it is larger in size and com- mands a higher market price than the native zhikong scallop Chlamys farreri and introduced bay scallop Argopecten irradi- ans, P. yessoensis quickly gained acceptance by scallop farm- ers in northern China, and aquaculture expanded rapidly after 1982. It is in good agreement with the concept that most derivation populations show a reduced level of poly- morphisms as compared to their presumed progenitors [3,17]. However, the Chinese population of P. yessoensis maintains a similar to average level of genetic diversity com- pared with the Japanese population. Why is maintained the relatively high level of genetic variation in Chinese pop-
ulation of P. yessoensis? Thus, it is assumed that the in- troduced animals may be maintained considerably high lev- els of germplasms or large samples enough to prevent genet- ic erosion due to genetic drift, natural selection, and con- sanguineous-breeding. Thus, this knowledge of genetic di- versity is essential for the formulation of sampling strategies that capture variation within species.
Acknowledgement
Research supported by the National Fisheries Research and Development Institute (NFRDI) in Korea (#RP-2012-AQ-34).
References
1. Brand, A. R. 1991. Scallop ecology: distribution and behav- ior, pp. 517-584, In Shumway, S. E. (ed.),
Scallops: Biology, Ecology and Aquaculture
, Elsevier, Amsterdam.2. Caddy, J. F. 1970. A method of surveying scallop pop- ulations from a submersible.
J. Fish. Res. Bd Can.
27, 535-549.3. Doebley, J. 1989. Isozymic evidence and the evolution of crop plants, pp. 46-72, In Soltis, D. E. and P.S. Soltis (eds.),
Isozymes in Plant Biology
, Dioscorides Press, Portland.4. Fisheries Global Information System. 2010. Food and Agriculture Organization of the United Nations.
5. Goshima, S. and Fujiwara, H. 1994. Distribution and abun- dance of cultured scallop
Patinopecten yessoensis
in extensive sea beds as assessed by underwater camera.Mar. Ecol. Prog.
Ser.
110, 151-158.6. Hedrick, P. W. 1998. Maintenance of genetic polymorphism:
spatial selection and self-fertilization.
Am. Nat.
152, 145-150.7. Ito, H. 1991.
Patinopecten
(Mizuhopecten
)yessoensis
, pp.1024-1055, In Shumway, S. E. (ed.),
Scallops: Biology, Ecology and Aquaculture
, Elsevier, Amsterdam.8. Li, Q., K. Xu, and R. I. Yu. 2007. Genetic variation in Chinese hatchery populations of the Japanese scallop (
Patinopecten yessoensis
) inferred from microsatellite data.Aquaculture
269, 211–219.9. MacDonald, B. A. and Bajdik, C. D. 1992. Orientation and distribution of individual
Placopecten magellanicus
(Gmelin) in two natural populations with differing production.Can.
J. Fish. Aquat. Sci.
49, 2086-2092.10. Martinez, G., Mettifogo, L., Perez, M. A. and Callejas, C.
2007. A method to eliminate self-fertilization in a simulta- neous hermaphrodite scallop. 1. Effects on growth and sur- vival of larvae and juveniles.
Aquaculture
273, 459-469.11. Molnar, S. J., James, L. E. and Kash, .K. J. 2000. Inheritance and RAPD tagging of multiple genes for resistance to net blotch in barley.
Genome
43, 224-231.12. Olsen, A. M. 1955. Underwater studies on the Tasmanian commercial scallop,
Notovola mendionalis
(Tate) (Lamel li- branchiata
: Pectinidae).Aust. J. mar. Freshwat. Res.
6, 392-409.13. Pacak, A., Fiedorow, P., Dabert, J. and Szweykowska-ku-
초록:RAPD 마커에 의한 한국, 중국, 일본 참가리비의 유전적 다양성과 집단 구조 남명모
1․이주
1․문태석
1․허만규
2*
(
1국립수산과학원,
2동의대학교 분자생물학과)
참가리비(Patinopecten yessoensis) 60개체를 채집하여 유전적 다양성과 집단구조를 조사하였다. 임의 유전 다형 성 DNA (RAPD)로 109개 유전자형과 79개 다형성 좌위(72.8%)를 발견하였다. 전체 유전적 다양도(H
T)와 집단 내 변이(H
S)는 각각 0.254와 0.178였다. 유전자 좌위에 근거하여 집단 간 분화 정도(G
ST)는 0.299였다. 이는 전체 변이의 약 70.1%가 집단 내에 존재하고 있음을 시사한다. 참가리비 세 나라 집단에서 한 집단에 국한되는 대립유 전자 좌위와 한 개체에만 발현된 밴드가 발견되었다. RAPD 마커는 한국, 중국, 일본에 분포하는 참가리비를 구 분하는데 매우 효과적이었다. 또한 참가리비의 집단 내, 집단 간 유전적 다양성에 대한 통찰은 동물 유전자원의 수진 전략과 양식에 유익할 것으로 사료된다.
lińska, Z. 2010. RAPD technique for taxonomic studies of
Pellia epiphylla
-complex (Hepaticae, Metzgeriales).Genetica
. 104, 179-187.14. Saitou, N. and Nei, M. 1987. The neighbor-joining method:
A new method for reconstructing phylogenetic trees.
Mol.
Biol. Evol.
4, 406-425.15. Sato, M., Kawamata, K., Zaslavskaya, N., Nakamura, A., Ohta, T., Nishikiori, T., Brykov, V. and Nagashima, K. 2005.
Development of microsatellite markers for Japanese scallop (
Mizuhopecten yessoensis
) and their application to a pop- ulation genetic study.Marine Biotech.
7, 713-728.16. Tamura, K., Peterson, D., Peterson, N., Stecher, G., Nei, M., and Kumar, S. 2011. MEGA5: Molecular evolutionary genetics analysis using maximum likelihood, evolutionary
distance, and maximum parsimony methods.
Mol. Biol. Evol.
28, 2731-2739.
17. Van Treuren, R., Bijlsma, R., van Delden, W. and Ouborg, N. J. 1991. The significance of genetic erosion in the process of extinction. I. Genetic differentiation in
Salvia pratensis
andScabiosa columbaria
in relation to population size.Heredity
66, 181-189.18. Wang, Q. C. 1984. Introduction of Japanese scallop and pros- pect of culture it in northern China.
Fish. Sci.
3, 24–27.19. Yeh, F. C., Yang, R. C., Botle, T. J., Ye, Z. H. and Mao, J.
X. 1997. POPGENE, the user friendly shareware for pop- ulation genetic analysis. Molecular Biology and Biotechnology Centre, University of Alberta, Edmonton, Canada.