Genetic Diversity and Phenetic Relationship of Dill ( Anethum graveolens L.) by rps 16- trn K DNA Sequences
Jung-Sook Sung1, Jong-Wook Chung1, Gi-An Lee1, Man-Jung Kang1, Sok-Young Lee1 and Man-Kyu Huh2*
1National Agrobiodiversity Center, NAAS, RDA, Suwon 441-717, Korea
2Department of Molecular Biology, Dong-eui University, Busan 614-714, Korea
Received August 12, 2013 /Revised October 22, 2013 /Accepted October 30, 2013
Dill (Anethum graveolens L.) is an annual herb with a long history and it is mainly used as a spice and as a medicine that is effective as a digestive aid, a sedative, and a narcotic, and that helps remove bad breath. Dill grows wild in the districts along the shores of the Mediterranean Sea, West Asia, China, and Korea. An estimate of the phylogenetic relationships within dill accessions in 20 countries was inferred using data from therps16-trnK3-intergenic spacer. The aligned data sets for dill ranged from 747 to 779 nucleotides (bp) as a result of the differences in the insert/delete nucleotides. The sequence variation within the dill accessions was mostly due to nucleotide substitutions, although sev- eral small insertions and deletions can be found. Among 100 accessions from 20 countries, the Eastern Asia accessions were more closely related to the North American accessions than to the Central Asia and European accessions. Although some accessions were not congruent completely with geographical locations, the dill accessions with rps16-trnK analysis resulted in plants with better-resolved clades.
Key words : Dill (Anethum graveolens L.), rps16-trnK, phylogenic tree, sequence variation, accession
*Corresponding author
*Tel : +82-51-890-1529, Fax : +82-51-890-1521 E-mail : [email protected]
This is an Open-Access article distributed under the terms of the Creative Commons Attribution Non-Commercial License (http://creativecommons.org/licenses/by-nc/3.0) which permits unrestricted non-commercial use, distribution, and reproduction in any medium, provided the original work is properly cited.
Journal of Life Science 2013 Vol. 23. No. 11. 1305~1310 DOI : http://dx.doi.org/10.5352/JLS.2013.23.11.1305
Introduction
Dill (Anethum graveolens L.) is one of widespread vegeta- ble herbs belonging to the family Apiaceae (Umbellifera).
Dill is also called Hongwhoa or Syrah. Wild and weedy types of dill are widespread in the Mediterranean basin and in West Asia. It is suggested that dill originated from central Asia [18]. Similarly, Grieve [5] suggested that dill originated within an area around the Mediterranean and the South of Russia. Dill has been cultivated for thousands of years as a spice and medicinal purposes. For example, dill was found in mounds of ancient Egyptian history and in the Neolithic period in Switzerland. Dill has spread expanding the terri- tory of the Roman Empire to many countries in the end of the first century BC.
This species contains biologically active constituents in- cluding carvone, limouene, dillapiole, borgaptene, umbelle- prenin, and γ-sitosterole. In the central Asian countries, dill has been used as spices, stimulant, and carminative. Young
leaves of dill can be edible. Essential oil extracted from the seeds has been used as pest control, pickles, and preserva- tives [4].
Recently, molecular methods have been used for the iden- tification and evaluation of genetic diversity within dill ac- cessions at the plant population levels [14, 15]. These results may provide clues to the spread process of dill.
Molecular markers which reveal extensive polymorphism are suitable for discriminating closely related genotypes [11].
However, RAPD (random amplified polymorphic DNA) has a problem of limited repeatability, with the confounding fac- tor that repeating DNA sequences are often amplified [9].
Therps16-trnK region in chloroplast DNA usually shows sequence conservation in the regions flanking both trnL exons, whereas the central part is highly variable [13].
Within the intergenic spacer, no secondary-structural ele- ments have been found, which could serve as splicing points, including thatrps16-trnK are probably co-transcribed [3, 8]. A general feature of cpDNA spacer regions is the oc- currence of indels that can be derived from either deletion or duplication of adjacent sequences or occur in non-repeti- tive regions of the spacer [6].
We analyzed intraspecific phylogenic relationships with- in the worldwide accessions in A. graveolens and to com- pare our results with those of previous studies of this species.
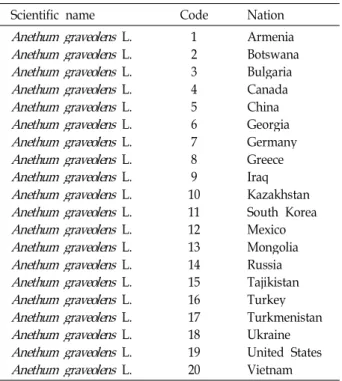
Table 1. The code names ofAnethum graveolensin 20 countries
Scientific name Code Nation
Anethum graveolens L.
Anethum graveolens L.
Anethum graveolens L.
Anethum graveolens L.
Anethum graveolens L.
Anethum graveolens L.
Anethum graveolens L.
Anethum graveolens L.
Anethum graveolens L.
Anethum graveolens L.
Anethum graveolens L.
Anethum graveolens L.
Anethum graveolens L.
Anethum graveolens L.
Anethum graveolens L.
Anethum graveolens L.
Anethum graveolens L.
Anethum graveolens L.
Anethum graveolens L.
Anethum graveolens L.
1 23 45 6 78 109 1112 1314 15 1617 1819 20
Armenia Botswana Bulgaria Canada China Georgia Germany Greece IraqKazakhstan South Korea Mexico Mongolia Russia Tajikistan Turkey Turkmenistan Ukraine United States Vietnam
Materials and Methods DNA extraction, gene amplification and sequencing
All one hundred samples (five accessions per nation) of dill accessions were obtained from National Agrobiodiversity Center, National Academy of Agricultural Science (Suwon, Gyonggi Province in Korea) and the center collected the samples from 20 countries. Genomic DNA was extracted from fresh leaves after germinating using the DNA Zol Kit (Life Technologies Inc., Grand Island, New York, U.S.A.) ac- cording to the manufacturer’s protocol. Total DNA was pre- cipitated with ethanol (-20℃), centrifuged for 30 minutes, washed in 70% ethanol to remove excess salts. DNA pellet was dried and then re-dissolved in 100ul TE buffer (10 mM Tris-HCl, pH 8.0, 1 mM EDTA, pH 8.0). DNA was checked for shearing and concentration by agarose electrophoresis and fluometry, respectively.
Specific primers (rps16F:5`-AAAGGKGCTCARCCTACA- RGAA-3`, trnK5‘R: 5`-TACTCTACCRTTGAGTTAGCAAC- 3`) were used to amplify the entire length of the sequences for therps16-trnK gene by polymerase chain reaction (PCR) using standard techniques at a 2.5 mmol/l MgCl2 con- centration.
PCR materials (50 ul volume) included 50 ng of genomic DNA, 100 uM of each dNTP, 0.2 uM of each primer, 1x en- zyme buffer, and 2 unit of Taq polymerase. The amplifica- tion profile was 28 cycles of 94℃ for 30 sec, 42℃ for 60 sec, 72℃ for 60 sec, preceded by an initial denaturation at 94℃ for 90 sec and followed by a final extension at 72℃
for 5 min.
PCR products were separated on 2.0% agarose gels and purified using the QIAquick Gel Extraction Kit (QIAGEN).
The amplified fragments were cloned into a bluescript vector and sequenced using ABI Prism 377 Sequencer (Applied Biosystem, USA). At least five clones of each accession were analyzed.
Alignment and phylogenetic analysis
The chromatogram output for each sample was edited us- ing the software Sequence Navigator 1.0.1 (Applied Biosystems Inc.), and the sequences were manually aligned.
New sequences obtained in this study were deposited in GenBank.
An alignment was calculated using the MULTIPLE ALIGNMENT MODE of the Crustal X program. Phylogenet- ic relationship was estimated by MEGA5 version with max-
imum parsimony (MP) algorithm [17]. The MP was inferred using heuristic search, branch-swapping options and tree bi- section-reconnection. Tajima's neutrality test [16] was esti- mated using MEGA5. Bayesian analysis was performed us- ing MrBayes 3.1.2 [12] on the combined matrix. We calcu- lated the MODELTEST 3.7 [10]. The best-fit maximum like- lihood model was chosen using the Akaike information cri- terion (AIC) [1].
Confidence values for individual branches were de- termined by a bootstrap analysis with 100 repeated sampling of the data.
Results
The complete sequences ofrps16-trnK regions for the 100 dill accessions in the world were amplified and sequenced with PCR and primers. The aligned data sets for dill ranged from 747 to 779 nucleotides (bp) as results of differences in insert/delete nucleotides (Table 2).
Alignments of rps16-trnK regions for the dill accessions were great similarity among the accessions and the unusual rps16-trnK insert were not shown. Sequence variation within dill was mostly due to nucleotide substitutions, although several small insertions and deletions can be found. Another source of sequence divergence was length variation due to stretches of short repeated that occurred at the sequences
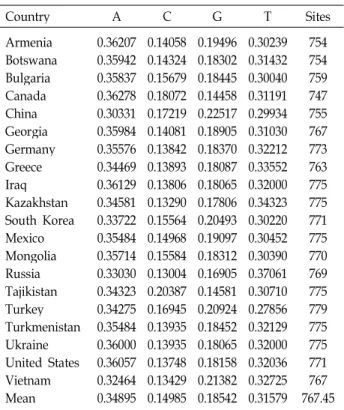
Table 2. Base frequencies across accessions of 20 countries`
Anethum graveolens usingrps16-trnK
Country A C G T Sites
Armenia Botswana Bulgaria Canada China Georgia Germany Greece Iraq Kazakhstan South Korea Mexico Mongolia Russia Tajikistan Turkey Turkmenistan Ukraine United States Vietnam Mean
0.36207 0.35942 0.35837 0.36278 0.30331 0.35984 0.35576 0.34469 0.36129 0.34581 0.33722 0.35484 0.35714 0.33030 0.34323 0.34275 0.35484 0.36000 0.36057 0.32464 0.34895
0.14058 0.14324 0.15679 0.18072 0.17219 0.14081 0.13842 0.13893 0.13806 0.13290 0.15564 0.14968 0.15584 0.13004 0.20387 0.16945 0.13935 0.13935 0.13748 0.13429 0.14985
0.19496 0.18302 0.18445 0.14458 0.22517 0.18905 0.18370 0.18087 0.18065 0.17806 0.20493 0.19097 0.18312 0.16905 0.14581 0.20924 0.18452 0.18065 0.18158 0.21382 0.18542
0.30239 0.31432 0.30040 0.31191 0.29934 0.31030 0.32212 0.33552 0.32000 0.34323 0.30220 0.30452 0.30390 0.37061 0.30710 0.27856 0.32129 0.32000 0.32036 0.32725 0.31579
754 754759 747 755 767 773763 775 775 771 775770 769 775 779 775775 771 767 767.45
Korea China Vietnam Canada United States Mexico Mongolia Georgia Kazakhstan Germany Turkmenistan Ukraine Botswana Iraq Greece Bulgaria Turkey Russia Tajikistan Armenia Fig. 1. The maximum parsimonious tree for 20 countries`
Anethum graveolensbased onrps16-trnK analysis using MEGA5.
Table 3. Maximum composite likelihood estimate of the pattern of nucleotide substitution
A T C G
AT CG
9.78- 14.859.78
8.83- 14.64 8.83
4.176.91 4.17-
7.795.13 5.13- Each entry shows the probability of substitution (r) from one base (row) to another base (column). For simplicity, the sum of r values is made equal to 100. Rates of different transitional substitutions are shown in bold and those of transversionsal substitutions are shown initalics. The nucleotide frequencies are 35.04% (A), 31.65% (T/U), 18.39% (C), and 14.93% (G). There were a total of 689 positions in the final dataset. Evolutionary analyses were conducted in MEGA5.
of TTTTT and AAAGA.
Alignment of the DNA sequences did not require allow- ing gaps. Total alignment length was 779 positions, of which 39 were parsimony-informative characters, 76 variable but parsimony-uninformative, and 318 constant characters.
G + C content for dill ranged between 31.1% (Kazakhstan) and 39.7% (China) (Table 2). The base frequencies did not showed the significant difference to the accessions. These values were similar to the mean (33.5%) for the dill align- ments except China accession of the rps16-trnK region.
Substitution pattern and rates were estimated under the Kimura 2-parameter model. The estimated Transition/
Transversion biases (R) varied from 4.17 to 14.85. Under maximum likelihood fits of 24 different nucleotide sub- stitution models, substitution from G to A was 14.85 and the reverse was 7.79 (Table 3).
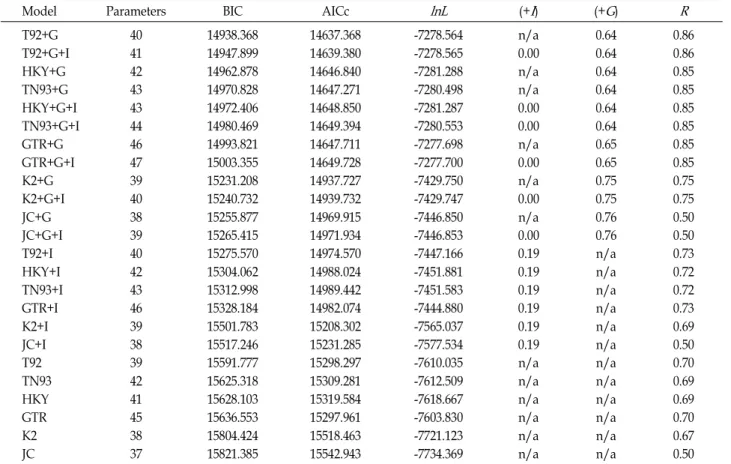
BIC score was the lowest at the Kimura parameter with 14938.4 (Table 4). AICc value was the lowest at the Tamura 3-parameter with 14637.4. Assumed or estimated values of transition/transversion bias (R) are shown for each model, as well.
Number of segregating sites was 548 and nucleotide di- versity (π) was 0.250. Under the neutral mutation hypothesis, the probability that the Tajima test statistic (D) is positive
(0.476) is less than 0.5 (Table 5). Therefore, there may be a site at which deletion/insertion, which increases the genet- ic variation, is operating.
The main phylogenetic analysis revealed many distinct clades (Fig. 1). The first clade includes three accessions (China, Korea, and Vietnam). Internal nodes were not strongly supported (only 28%). The second clade included Canada and United States and sistered to Mexico. The group was sistered to Mongol and next was Georgia, Kazakhstan,
Table 4. Maximum likelihood fits of 24 different nucleotide substitution models
Model Parameters BIC AICc lnL (+I) (+G) R
T92+G T92+G+I HKY+G TN93+G HKY+G+I TN93+G+I GTR+G GTR+G+I K2+G K2+G+I JC+G JC+G+I T92+I HKY+I TN93+I GTR+I K2+I JC+I T92 TN93 HKY GTR K2 JC
40 41 42 43 43 44 46 47 39 40 38 39 40 42 43 46 39 38 39 42 41 45 38 37
14938.368 14947.899 14962.878 14970.828 14972.406 14980.469 14993.821 15003.355 15231.208 15240.732 15255.877 15265.415 15275.570 15304.062 15312.998 15328.184 15501.783 15517.246 15591.777 15625.318 15628.103 15636.553 15804.424 15821.385
14637.368 14639.380 14646.840 14647.271 14648.850 14649.394 14647.711 14649.728 14937.727 14939.732 14969.915 14971.934 14974.570 14988.024 14989.442 14982.074 15208.302 15231.285 15298.297 15309.281 15319.584 15297.961 15518.463 15542.943
-7278.564 -7278.565 -7281.288 -7280.498 -7281.287 -7280.553 -7277.698 -7277.700 -7429.750 -7429.747 -7446.850 -7446.853 -7447.166 -7451.881 -7451.583 -7444.880 -7565.037 -7577.534 -7610.035 -7612.509 -7618.667 -7603.830 -7721.123 -7734.369
n/a 0.00 n/a n/a 0.00 0.00 n/a 0.00 n/a 0.00 n/a 0.00 0.19 0.19 0.19 0.19 0.19 0.19 n/a n/a n/a n/a n/a n/a
0.64 0.64 0.64 0.64 0.64 0.64 0.65 0.65 0.75 0.75 0.76 0.76 n/a n/a n/a n/a n/a n/a n/a n/a n/a n/a n/a n/a
0.86 0.86 0.85 0.85 0.85 0.85 0.85 0.85 0.75 0.75 0.50 0.50 0.73 0.72 0.72 0.73 0.69 0.50 0.70 0.69 0.69 0.70 0.67 0.50 Models with the lowest BIC scores (Bayesian Information Criterion) are considered to describe the substitution pattern the best.
For each model, AICc value (Akaike Information Criterion, corrected), Maximum Likelihood value (lnL), and the number of parameters (including branch lengths) are also presented. Non-uniformity of evolutionary rates among sites may be modeled by using a discrete Gamma distribution (+G) with 5 rate categories and by assuming that a certain fraction of sites are evolutionarily invariable (+I).
Whenever applicable, estimates of gamma shape parameter and/or the estimated fraction of invariant sites are shown. Assumed or estimated values of transition/transversion bias (R) are shown for each model, as well. They are followed by nucleotide frequencies (f) and rates of base substitutions (r) for each nucleotide pair. Relative values of instantaneousrshould be considered when evaluating them. For simplicity, sum ofrvalues is made equal to 1 for each model. For estimating ML values, a tree topology was automatically computed.
Table 5. Results from Tajima's neutrality test forrps16 andtrnK sequences of 20 countries’ dills
m S ps Θ π D
20 548 0.795356 0.224187 0.249729 0.476373 m=number of sequences, S=Number of segregating sites, ps= S/m,Θ=ps/a1,π=nucleotide diversity, andDis the Tajima test statistic.
and Germany. Clade of Turkmenistan and Ukrainewas sis- tered to former group. Internal node of Bulgaria and Turkey was strongly supported (71%) and sistered to Greece.
Tajikistan and Armenia were formed one clade and sistered to Russia. In addition, the positions of phylogeny based on rps16-trnK analysis were not congruenced with the geo- graphical positions.
Discussion
rps16-trnK for the one hundred accessions of dill had a total aligned length of 779 bp. Many accessions of dill con- tained the identical sequences overrps16-trnK gene, result- ing in a single, undifferentiated clade for these samples in the phylogenetic analysis, even though many of these sam- ple accessions had been obtained from very different geo- graphical origins (Table 1). However, the sequences of many dill accessions differed from each other, resulting in clear delineation of all accessions in our analysis. In particular, there are many single nucleotide polymorphisms in these sequences, allowing us to distinguish accessions from other accessions based on the sequence data.
Study of genetic diversity and phylogenetic analysis in
the 135 dill accessions using molecular markers (RAPD) were reported by Suresh et al. [15]. However, their results by RAPD showed little association with the geographic ori- gin of the collecting countries. Some accessions of same country were located in different clades of phylogenetic tree.
It might be accounted for a few bands of RAPD markers (142 bands for 135 accessions). In addition, the phenetic re- sults of RAPD were grouped into two major clusters without geographic locations. The rps16-trnK analysis resulted in trees with better-resolved clades although the present results are not congruent completely with geographical locations.
Solouki et al. [14] also reported genetic diversity and mor- phological traits in 37 accessions of dill in Iran using AFLP (amplified fragment length polymorphism) markers. They concluded that morphological traits showed a high degree of variation among the dill accessions and molecular mark- ers showed a low variation.
Low numbers of bands (fragments) used for RAPD or AFLP markers did not present a good relationships among accessions of dill. In addition, we are unaware of any unique anatomical or morphological traits that would support the union of these accessions of dill. As a pointed by Solouki et al. [14], dill has shown the phenetic plasticity and morpho- logical traits may be controlled by few genes. RAPD frag- ments have not made the expected bands related to the mor- phological similarity. These similar results have been re- ported other species [2, 7].
Acknowledgements
This study was carried out with the support of
"Cooperative Research Program for Agricultural Science &
Technology Development (Project No. PJ0086232013 )", Rural Development Administration, Republic of Korea.
References
1. Akaike, H. 1974. A new look at statistical model identi- fication, IEEE Trans. Automatic Control 19, 716-723.
2. Ali, G. M., Yasumoto, S. and Katsuta, M. S. 2007.
Assessment of genetic diversity in sesame (Sesamum indicum L.) detected by Amplified Fragment Length Polymorphism markers. Electronic J Biotech10, 12-23.
3. Andersson, L. and Rova, J. H. 1999. Therps16 intron and the phylogeny of the Rubioideae (Rubiaceae).Plant Syst Evol 214, 161-186.
4. Bakkali, F., Averbeck, S., Averbeck, D. and Idaomar, M.
2008. Biological effects of essential oils – a review. Food Chem Toxicol 46, 446-465.
5. Grieve, M. 2011. "Dill". A Modern Herbal. Botanical. Com.
http://www.botanical.com/botanical/mgmh/d/dill- 13.html. Retrieved 2011-12-21.
6. Golenberg, E. M., Clegg, M. T., Durbin, M. L., Doebley, J.
and Ma, D. P. 1993. Evolution of a noncoding region of the chloroplast genome. Mol Phylogenet Evol 2, 52-64.
7. Lopez, P. A., Widrlechner, M. P., Simon, P. W., Boylston, S. R. T. D., Isbell, T. A., Bailey, T. B., Gardner, C. A. and Wilson, L. A. 2008. Assessing phenotypic, biochemical, and molecular diversity in coriander (Coriandrum sativum L.) germplasm. Genet Resour Crop55, 247-275.
8. Oxelman, B., Liden, M. and Berglund, D. 1997. Chloroplast rps16 intron phylogeny of the tribe Sileneae (Caryophylla- ceae). Plant Syst Evol 206, 393-410.
9. Penner, G. A., Chong, J., Levesque-Lamay, M., Molnar, S.
I. and Fedak, K. G. 1993. Identification of a RAPD marker linked to the oat stem rust genePg3.Theor Appl Genet85, 702-705.
10. Posada, D. and Crandall, K. 1998. Modelist: testing the mod- el of DNA substitution. Bioinformatics14, 817-873.
11. Rajaseger, G., Tan, T. W. H., Turner, I. M. and Kumar, P.
R. 1997. Analysis of genetic diversity amongIxoracultivars (Rubiaceae) using random amplified polymorphic DNA.
Ann Bot 80, 355-361.
12. Ronquist, F. and Huelsenbeck, J. P. 2003. MrBayes: Bayesian phylogenetic inference under mixed models.Bioinformatics 19, 1972-1974.
13. Shaw, J., Lickey, E. B., Beck, J. T., Farmer, S. B., Liu, W., Miller, J., Siripun, K. C., Winder, C. T., Schilling, E. E. and Small, R. L. 2005. The tortoise and the hare II: relative utility of 21 noncoding chloroplast DNA sequences for phyloge- netic analysis. Am J Bot 92, 142-166.
14. Solouki, M. S., Hoseini, S. B. and Tavassoli, A. 2012. Genetic diversity in dill (Anethum graveolensL.) populations on the basis of morphological traits and molecular markers.African J Biotech11, 3649-3655.
15. Suresh, S., Chung, J. W., Sung, J. S., Cho, G. T., Park, J.
H., Yoon, M. S., Kim, C. K. and Back, H. J. 2012. Analysis of genetic diversity and population structure of 135 dill (Anethum graveolens L.) accessions using RAPD markers.
Genet Resour Crop Evol DOI 10.1007/s10722-012-9886-7.
16. Tajima, F. 1989. Statistical methods to test for nucleotide mutation hypothesis by DNA polymorphism.Genetics123, 585-595.
17. Tamura, K., Peterson, D., Peterson, G., Stecher, G., Nei, M.
and Kumar, S. 2011. MEGA5: Molecular Evolutionary Genetics Analysis using Maximum Likelihood, Evolutio- nary Distance, and Maximum Parsimony Methods.Mol Biol Evol 28, 2731-2739.
18. Zohary, D. and Hopf, M. 2000.Domestication of plants in the Old World, pp. 206, third ed., Oxford University Press, NY, USA.
초록:rps16-trnK DNA 서열에 의한 딜(Anethum graveolens L.)의 유전적 다양성과 유전 관계 성정숙1․정종욱1․이기안1․강만정1․이석영1․허만규2*
(1국립농업과학원 농업유전자원센터, 2동의대학교 분자생물학과)
딜(Anethum graveolens L.)은 세계적으로 중요한 초본으로 양념과 약용뿐만 아니라 소화제, 진정제, 마취제, 활력 제로 오래 전부터 사용되어왔다. 딜은 지중해, 서아시아, 중국과 한국 등에서 분포한다. 20개국 100계통 간 rps16-trnK3 서열을 이용하여 유전적 다양성과 유연관계를 조사하였다. 배당된 서열은 747에서 779 염기쌍으로 삽입과 결실이 있었다. 비록 일부 삽입과 결실이 발견되었지만 서열 변이는 염기 치환에 기인하였다. 동아시아 계통이 중앙아시아와 유럽보다 북미에 근연하였다. 딜의 일부 계통은 지리적 분포와 계통도에서 위치가 일치하지 않았지만 rps16-trnK로 잘 분리되었다.