Genetic Diversity and Relationship of Genus Spiraea by Random Amplified Polymorphic DNA Markers
Man Kyu Huh*
Department of Molecular Biology, Dongeui University 995 Eomgwangno, Busanjin-gu, Busan 614-714, Korea
Received April 6, 2010 /Accepted April 29, 2010Genus Spiraea is a woody species primarily distributed throughout Asia. Many species of this genus are important plants medicinally and ecologically. I evaluated a representative sample of the sixteen taxa with random amplified polymorphic DNA (RAPD) markers to estimate genetic relationships within genus Spiraea. In addition, RAPD analysis was also conducted to estimate the genetic diversity and population structure of these species. As the typical populations of Spiraea were small, isolated, and patchily distributed for natural populations, they maintained a low level of genetic diversity for polymorphic primers. The mean H was 0.117 across species. The Korean endemic species (S. chartacea) and patchily distributed species (S. betulifolia) showed fewer alleles per locus (mean 1.240 vs. 1.297), lower percent polymorphic locus (24.0 vs. 29.7), and lower diversity (0.092 vs. 0.121) than a relatively widely spread species. An assessment of the proportion of diversity present within species, H
POP/H
SP, indicated that about 87.8% the total genetic diversity was among species. Thus, the majority of genetic variation (87.8%) resided within species. The phylogenic tree showed three distinct groups. One clade includes S. prunifolia for. simpliciflora, S. thunbergii, S. chamaedryfolia var. ulmifolia, S. media, and S.
cantoniensis. Another clade includes S. blumei, S. pubescens, S. chartacea, and S. chinensis. The other clade is the remaining seven species.
Key words : Genus Spiraea, genetic diversity, RAPD, phylogenic tree
*Corresponding author
*Tel:+82--51-890-1529, Fax:+82-51-890-1521
*E-mail : [email protected]
Introduction
Spiraea (also known as Meadowsweet) is a genus of about 80~100 species of shrubs in the Rosaceae, subfamily Spiraeoideae [21]. The genus Spiraea is native to the temper- ate Northern Hemisphere, with the greatest diversity in east- ern Asia [23]. For example, Spiraea prunifolia Siebold & Zucc.
forma simpliciflora Nakai occurs in mountains of Korea. This species is also reported from China and Taiwan [13].
Spiraea contains methyl salicylate and other salicylates, compounds with similar medicinal properties of aspirin.
Unlike aspirin, meadowsweet is effective in treating stomach disorders in minute amounts. The salicylates in this plant are a highly effective analgesic, anti-inflammatory, and fever reducer, without the side effects attributed to aspirin [18].
Asian regions such as China, Korea, Japan and Russia are well known for giving various Spiraea species [9]. The genus Spiraea is comprised of about 10~14 species in Korea. The taxonomy of Spiraea has processed mainly through morpho- logical characteristics [8]. However morphological character-
istics are restricted their resolving power mainly because of the small number of variables available. The development of molecular makers has provided powerful tools that may overcome such limitations [3].
The random amplified polymorphic DNA (RAPD) mark-
ers have popular means for identification and authentication
of plant and animal species because these marker techniques
may generate relatively high numbers of DNA markers per
sample and are technically simple [14]. This molecular mark-
er is based on the PCR amplification of random locations
in the genome of the plant [16]. With this technique, a single
oligonucleotide is used to prime the amplification of ge-
nomic DNA. Because these primers are 10 nucleotides long,
they have the possibility of annealing at a number of loca-
tions in the genome [4]. For amplification products to occur,
the binding must be to inverted repeats sequences generally
150~4,000 base pairs apart. The number of amplification
products is directly related to the number and orientation
of the sequences that are complementary to the primer in
the genome. The methods have been used extensively in ge-
netic analysis of prokaryotes and eukaryotes though the
marker system has certain disadvantages such as reproduci-
bility [17].
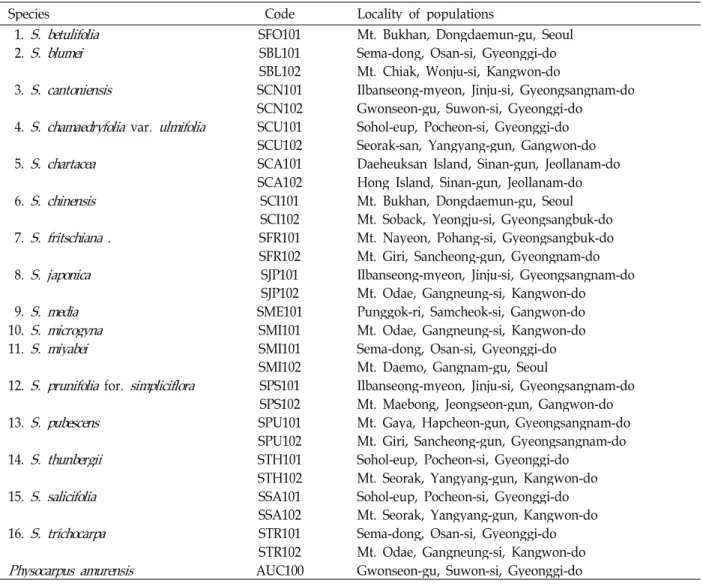
Table 1. Code and locations of the genus
Spiraea
and the outgroup in this studySpecies Code Locality of populations
1. S. betulifolia SFO101 Mt. Bukhan, Dongdaemun-gu, Seoul
2. S. blumei SBL101 Sema-dong, Osan-si, Gyeonggi-do
SBL102 Mt. Chiak, Wonju-si, Kangwon-do
3. S. cantoniensis SCN101 Ilbanseong-myeon, Jinju-si, Gyeongsangnam-do SCN102 Gwonseon-gu, Suwon-si, Gyeonggi-do
4. S. chamaedryfolia var. ulmifolia SCU101 Sohol-eup, Pocheon-si, Gyeonggi-do SCU102 Seorak-san, Yangyang-gun, Gangwon-do 5. S. chartacea SCA101 Daeheuksan Island, Sinan-gun, Jeollanam-do
SCA102 Hong Island, Sinan-gun, Jeollanam-do
6. S. chinensis SCI101 Mt. Bukhan, Dongdaemun-gu, Seoul
SCI102 Mt. Soback, Yeongju-si, Gyeongsangbuk-do 7. S. fritschiana . SFR101 Mt. Nayeon, Pohang-si, Gyeongsangbuk-do
SFR102 Mt. Giri, Sancheong-gun, Gyeongnam-do
8. S. japonica SJP101 Ilbanseong-myeon, Jinju-si, Gyeongsangnam-do
SJP102 Mt. Odae, Gangneung-si, Kangwon-do
9. S. media SME101 Punggok-ri, Samcheok-si, Gangwon-do
10. S. microgyna SMI101 Mt. Odae, Gangneung-si, Kangwon-do
11. S. miyabei SMI101 Sema-dong, Osan-si, Gyeonggi-do
SMI102 Mt. Daemo, Gangnam-gu, Seoul
12. S. prunifolia for. simpliciflora SPS101 Ilbanseong-myeon, Jinju-si, Gyeongsangnam-do SPS102 Mt. Maebong, Jeongseon-gun, Gangwon-do
13. S. pubescens SPU101 Mt. Gaya, Hapcheon-gun, Gyeongsangnam-do
SPU102 Mt. Giri, Sancheong-gun, Gyeongsangnam-do
14. S. thunbergii STH101 Sohol-eup, Pocheon-si, Gyeonggi-do
STH102 Mt. Seorak, Yangyang-gun, Kangwon-do
15. S. salicifolia SSA101 Sohol-eup, Pocheon-si, Gyeonggi-do
SSA102 Mt. Seorak, Yangyang-gun, Kangwon-do
16. S. trichocarpa STR101 Sema-dong, Osan-si, Gyeonggi-do
STR102 Mt. Odae, Gangneung-si, Kangwon-do Physocarpus amurensis AUC100 Gwonseon-gu, Suwon-si, Gyeonggi-do Although it is important to gain knowledge of the genetic
variation for conservation purposes, detailed information on the levels and distribution of this variation as well as pop- ulation structure are not available for most woody taxa in Korea. The aims of this study were: 1) to estimate how much total genetic diversity is maintained in the Spiraea species, 2) to describe how genetic variation is distributed within and among species, and to elucidate the suitability and efficiency of the RAPD analyses assess the phylogenetic relationships among the related species in Korea. In addition, we com- pared amounts of genetic variation of species between en- demic group and relative widespread group. Although ran- domly amplified polymorphic DNA (RAPD) marker has dis- advantage of low reproduction and of dominant segregation, it is a preferable approach for Spiraea species.
This study was carried out to examine several populations of Spiraea species in order to evaluate genetic diversity and
population structure in this species and genus.
Materials and Methods Plant materials
All of the 30 populations of sixteen taxa were collected from Spiraea populations in Korea (Table 1). They are Spiraea prunifolia for. simpliciflora NAKAI, S. cantoniensis LOUR., S.
chamaedryfolia var. ulmifolia (SCOP.) MAXIM., S. blumei G.
DON, S. thunbergii SIEBID., S. miyabei KOIDZ, S. trichocarpa NAKAI, S. pubescens TURCZ., S. chartacea NAKAI, S. chi- nensis MAXIM., S. salicifolia L., S. japonica L, S. betulifolia PALLAS, S. fritschiana SCHNEID, S. media SCHMIDT., and S. microgyna NAKAI. Samples of the germplasmic S. betulifo- lia were obtained from the Korea Forest Research Institute.
One young leaf per mature tree (≥5 yr) was sampled.
Twelve plants were randomly collected from each
population. In addition, the species of same family Rosaceae, Physocarpus amurensis was provided for the outgroup and used to compare the phenetic relationship.
DNA extraction and RAPD analysis
The genomic DNA of the 342 samples including outgroup was extracted from fresh leaves using the plant DNA Zol Kit (Life Technologies Inc., Grand Island, New York, USA) according to the manufacturer’s protocol.
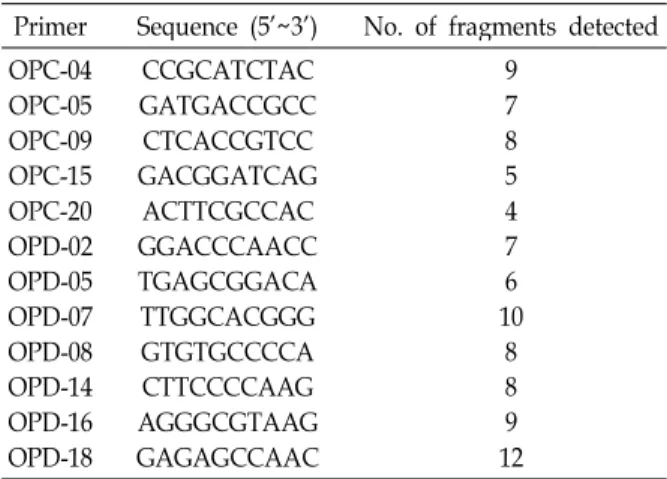
RAPD primers were obtained from Operon Technologies Inc. (USA). All the reactions were repeated twice and only reproducible bands were scored for analyses. Of 40 primers (OPC01-OPC20 and OPD01-OPD20) used for a preliminary RAPD analysis, 12 primers produced good amplification products both in quality, reproducibility, and variability (Table 2).
Amplification reactions were performed in 0.6 ml tubes containing 2.5 µl of the reaction buffer, 10 mM Tris-HCl (pH 8.8), 1.25 mM each of dATP, dCTP, dGTP, dTTP, 5.0 pM primer, 2.5 units Taq DNA polymerase, and 25 ng of ge- nomic DNA. A 100 bp ladder DNA marker (Pharmacia) was used in the end of for the estimation of fragment size. The amplification products were separated by electrophoresis on 1.5% agarose gels, stained with ethidium bromide, and pho- tographed under UV light using Alpha Image TM (Alpha Innotech Co., USA).
Statistical analyses
All RAPD bands were scored by eye and only un- ambiguously scored bands were used in the analyses.
Because RAPDs are dominant markers, they were assumed that each band corresponded to a single character with 2 alleles, presence (1) and absence (0) of the band, respectively.
The following genetic parameters were calculated using a POPGENE computer program (ver. 1.31) developed by Yeh et al. [20]: the percentage of polymorphic loci (P
p), mean numbers of alleles per locus (A), effective number of alleles per locus (A
E) and gene diversity (H) [11].
The phenotypic frequency of each band was calculated and used in estimating total genetic diversity (H
T), genetic diversity within populations (H
S) proportion of total genetic diversity partitioned among populations (G
ST), and gene flow (N
m) [10,19].
The degree of polymorphism was quantified using Shannon’s index of phenotypic diversity [2]:
H
O= -S p
ilogp
iwhere p
iis the frequency of a particular phenotype i. H
Ocan be calculated and compared for different populations [12]. Let
H
POP= 1/n S H
Obe the average diversity over the different species and let H
SP= -S plogp
be the diversity calculated from the phenotypic frequencies p in all species considered together. Then the proportion of diversity present within species, H
POP/H
SP, can compared with that of between species (G
ST), (H
SP-H
POP)/H
SP.
The estimation of genetic similarity (GS) between geno- types was based on the probability that an amplified frag- ment from one individual will also be present in another [11]. GS was converted to genetic distance (1-GS).
Homogeneity of variance among populations was tested by Bartlett’s statistics [1].
A phenetic relationship was constructed by the neighbor- joining (NJ) method [15] using the NEIGHBOR program in PHYLIP version 3.57 [5]. Relative support for clades was as- sessed using phylogenetic bootstrapping with 1000 replicates [5].
Results
From the 40 decamer primers used for a preliminary RAPD analysis, 12 primers produced good amplification products both in quality and variability. Overall, 93 frag- ments were generated among the tested Spiraea array (Table 2). The fragments ranged from 4~12 per primer.
In a simple measure of intraspecies variability by the per-
Table 2. List of decamer oligonucleotide utilized as RAPD primers, their sequences, and associated poly- morphic fragments amplified in the
Spiraea
taxa Primer Sequence (5’~3’) No. of fragments detected OPC-04OPC-05 OPC-09 OPC-15 OPC-20 OPD-02 OPD-05 OPD-07 OPD-08 OPD-14 OPD-16 OPD-18
CCGCATCTAC GATGACCGCC CTCACCGTCC GACGGATCAG ACTTCGCCAC GGACCCAACC TGAGCGGACA TTGGCACGGG GTGTGCCCCA CTTCCCCAAG AGGGCGTAAG GAGAGCCAAC
97 85 4 76 108
89 12
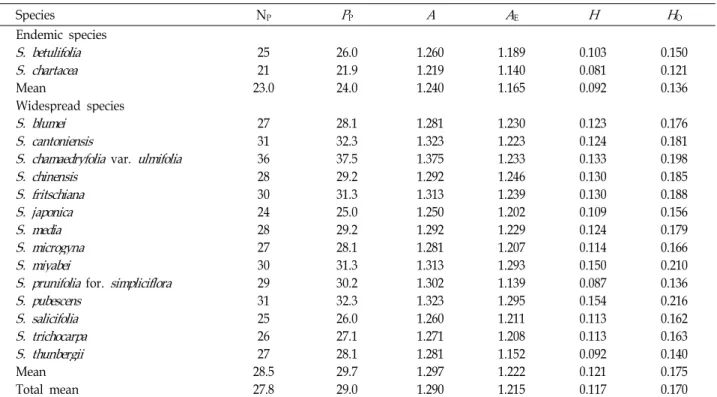
Table 3. Measures of genetic variability for RAPDs generated among
Spiraea
taxaSpecies NP
P
PA A
EH H
OEndemic species
S. betulifolia
25 26.0 1.260 1.189 0.103 0.150S. chartacea
21 21.9 1.219 1.140 0.081 0.121Mean 23.0 24.0 1.240 1.165 0.092 0.136
Widespread species
S. blumei
27 28.1 1.281 1.230 0.123 0.176S. cantoniensis
31 32.3 1.323 1.223 0.124 0.181S. chamaedryfolia
var.ulmifolia
36 37.5 1.375 1.233 0.133 0.198S. chinensis
28 29.2 1.292 1.246 0.130 0.185S. fritschiana
30 31.3 1.313 1.239 0.130 0.188S. japonica
24 25.0 1.250 1.202 0.109 0.156S. media
28 29.2 1.292 1.229 0.124 0.179S. microgyna
27 28.1 1.281 1.207 0.114 0.166S. miyabei
30 31.3 1.313 1.293 0.150 0.210S. prunifolia
for.simpliciflora
29 30.2 1.302 1.139 0.087 0.136S. pubescens
31 32.3 1.323 1.295 0.154 0.216S. salicifolia
25 26.0 1.260 1.211 0.113 0.162S. trichocarpa
26 27.1 1.271 1.208 0.113 0.163S. thunbergii
27 28.1 1.281 1.152 0.092 0.140Mean 28.5 29.7 1.297 1.222 0.121 0.175
Total mean 27.8 29.0 1.290 1.215 0.117 0.170
NP: The number of polymorphic loci,
P
P: The percentage of polymorphic loci,A
: Mean numbers of alleles per locus,A
E: Effective number of alleles per locus,H
: Gene diversity,H
O: Shannon’s index of phenotypic diversity.centage of polymorphic bands, the S. chartacea exhibited the lowest variation (21.9%) (Table 3). The S. chamaedryfolia var.
ulmifolia showed the highest (37.5%). Mean number of alleles per locus (A) ranged from 1.219~1.375 with a mean of 1.290.
The effective number of alleles per locus (A
E) ranged from 1.139~1.295.
The phenotypic frequency of each band was calculated and used in estimating genetic diversity (H) within populations. As the typical populations of Spiraea were small, isolated, and patchily distributed for natural pop- ulations, they maintained a low level of genetic diversity for polymorphic primers. The mean H was 0.117 across species. In particular, S. pubescens had the highest expected diversity (0.154); S. chartacea, the lowest (0.081).
Shannon’s index of phenotypic diversity (H
O) of S. pu- bescens (0.216) was highest of all species and S. miyabei was the second (0.210).
As one Korean endemic species (S. chartacea) was isolated at only two small islands (the Daeheuksan Island and the Hong Island) and narrow restricted species (S. betulifolia) was patchily distributed at only one small region (the mid- dle parts of Korea), they were found to have fewer alleles per locus (mean 1.240 vs. 1.297), lower percent polymorphic locus (24.0 vs. 29.7), and lower diversity (0.092 vs. 0.121) than
relatively widespread species (Table 3). The both groups showed significant difference for measures of genetic varia- bility except A
E(paired t test).
On a per locus basis, total genetic diversity (H
T) varied between 0.080 for S. chartacea and 0.372 for S. cantoniensis and S. fritschiana (Table 4). The interlocus variation of pop- ulation genetic diversity (H
S) was low (0.113). The average number of individuals exchanged between populations per generation (N
m) was estimated to be 0.458. Korean endemic species (S. chartacea) was found to have lower H
T(0.080 vs.
0.329), lower H
S(0.058 vs. 0.117), and lower G
ST(0.285 vs.
0.638) than relatively widespread species.
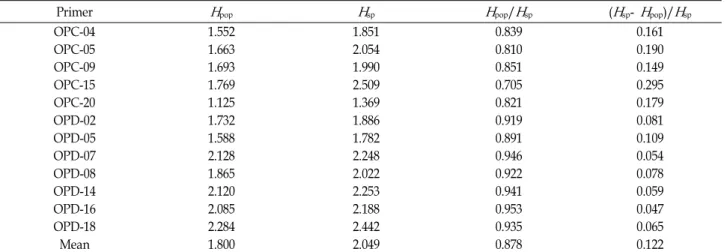
An assessment of the proportion of diversity present within species, H
POP/H
SP, indicated that about 87.8% the to- tal genetic diversity was among species. Thus, the majority of genetic variation (87.8%) resided within species (Table 5).
A similarity matrix based on the proportion of shared frag- ments (GS) was used to evaluate relatedness among species.
The estimate of GS ranged from 0.535~0.999 (Table 6).
Clustering of species, using the NJ algorithm, was per- formed based on the matrix of calculated distances (Fig. 1).
The phylogenic tree showed three distinct groups. One clade
includes S. prunifolia for. simpliciflora, S. thunbergii, S. chamae-
dryfolia var. ulmifolia, S. media, and S. cantoniensis. Another
Table 5. Partitioning of the genetic diversity into within and among
Spiraea
taxa using RAPD markersPrimer
H
popH
spH
pop/H
sp (H
sp-H
pop)/H
spOPC-04 1.552 1.851 0.839 0.161
OPC-05 1.663 2.054 0.810 0.190
OPC-09 1.693 1.990 0.851 0.149
OPC-15 1.769 2.509 0.705 0.295
OPC-20 1.125 1.369 0.821 0.179
OPD-02 1.732 1.886 0.919 0.081
OPD-05 1.588 1.782 0.891 0.109
OPD-07 2.128 2.248 0.946 0.054
OPD-08 1.865 2.022 0.922 0.078
OPD-14 2.120 2.253 0.941 0.059
OPD-16 2.085 2.188 0.953 0.047
OPD-18 2.284 2.442 0.935 0.065
Mean 1.800 2.049 0.878 0.122
H
POP: Phenotypic diversity for different populations,H
SP: The average diversity over the different species,H
POP/H
SP: The proportion of diversity within species, (H
SP-H
POP)/H
SP: The proportion of diversity between species.Table 4. Measures of genetic variability for RAPDs generated among
Spiraea
taxaSpecies
H
TH
SG
STN
mEndemic species
S. chartacea
0.080 0.058 0.285 1.255 Widespread speciesS. blumei
0.364 0.158 0.586 0.454S. chamaedryfolia
var.ulmifolia
0.365 0.113 0.683 0.428S. cantoniensis
0.372 0.118 0.668 0.303S. chinensis
0.312 0.111 0.589 0.474S. fritschiana
0.372 0.166 0.552 0.476S. japonica
0.303 0.121 0.641 0.453S. miyabei
0.309 0.126 0.602 0.398S. prunifolia
for.simpliciflora
0.368 0.110 0.661 0.311S. pubescens
0.255 0.069 0.711 0.311S. salicifolia
0.301 0.115 0.594 0.441S. trichocarpa
0.313 0.112 0.640 0.380S. thunbergii
0.312 0.090 0.724 0.272Mean 0.329 0.117 0.638 0.392
Total 0.310 0.113 0.610 0.458
S. betulifolia, S. media
, andS. microgyna
are not listed because one population is not obtained Wright’sF-
statistics.clade includes S. blumei, S. pubescens, S. chartacea, and S.
chinensis. The other clade is the remainder seven species.
Discussion Genetic diversity and population structure
In RAPD analysis, eleven species, two varieties, and one form belonging to genus Spiraea maintain a lower than aver- age level of genetic diversity compared with other plant spe- cies, although there is the difference in methodology (e.g., dominant marker and co-dominant marker) that may pre-
clude meaningful comparisons. For example, its genetic di- versity of 0.117 is lower than that for temperate-zone species (0.146), dicots (0.136), species with a sexual reproduction mode (0.151), and those with a long-lived woody habit (0.177) [6]. The percentage of polymorphic loci at the species level for Spiraea is 29.0%, which is also lower than that for species with temperature-zone distributions (48.5%), dicots (44.8%), species with a sexual reproduction mode (51.6%), and long-lived and woody (64.7%).
Geographic range has been shown to be strongly asso- ciated with the level of variation maintained both within populations and at the species level [7]. Widely distributed species tend to maintain more variation than more narrowly distributed species level [6]. For all Korean Spiraea taxa where number of alleles per polymorphic loci was calcu- lated, relatively widespread species had more alleles than restricted species (S. chartacea and S. betulifolia). In addition, effective population sizes are also important roles maintain- ing genetic diversity. Korean Spiraea has been saved from artificial distribution. Periodical cutting of branches and stems have often been moved from hillside to nearby farm- house for the purpose of firewood or medicine during the past several decades of years. Small populations tend to have fewer multilocus genotypes and genetic diversity than large populations. Smaller populations probably exhibit more selfing than larger populations by virtue of the limited opportunities for outcrossing during any flowering season.
Two introduced species, S. chinensis and S. cantoniensis were
not maintained high level of genetic diversity (Table 3). It
is likely that some of the secondary growth of virgin trees
I sampled were from a restricted parent pool and thus are
Table 6. Genetic identity (upper diagonal) among 16 taxa of genus
Spiraea
and genetic distances (low diagonal) based on RAPD analysisTaxa 1 2 3 4 5 6 7 8 9 10 11 12 13 14 15 16
1 - 0.700 0.934 0.614 0.956 0.667 0.556 0.683 0.673 0.616 0.616 0.631 0.656 0.648 0.647 0.642 2 0.357 - 0.664 0.651 0.708 0.755 0.639 0.667 0.642 0.592 0.588 0.594 0.618 0.624 0.624 0.616 3 0.069 0.409 - 0.635 0.947 0.674 0.535 0.666 0.652 0.586 0.585 0.602 0.619 0.631 0.634 0.620 4 0.489 0.430 0.454 - 0.660 0.801 0.748 0.959 0.773 0.778 0.799 0.771 0.770 0.803 0.801 0.810 5 0.045 0.345 0.055 0.416 - 0.694 0.577 0.702 0.693 0.641 0.631 0.642 0.661 0.660 0.658 0.656 6 0.405 0.281 0.395 0.221 0.365 - 0.907 0.752 0.736 0.706 0.733 0.717 0.745 0.757 0.759 0.754 7 0.588 0.448 0.625 0.290 0.551 0.098 - 0.832 0.815 0.837 0.834 0.808 0.810 0.821 0.820 0.827 8 0.381 0.405 0.406 0.042 0.354 0.285 0.184 - 0.798 0.916 0.897 0.813 0.893 0.897 0.894 0.897 9 0.396 0.443 0.428 0.257 0.367 0.307 0.205 0.226 - 0.945 0.803 0.808 0.898 0.890 0.888 0.896 10 0.486 0.525 0.535 0.251 0.444 0.348 0.178 0.088 0.057 - 0.889 0.893 0.917 0.898 0.895 0.910 11 0.485 0.532 0.536 0.224 0.460 0.310 0.182 0.109 0.219 0.118 - 0.953 0.915 0.903 0.900 0.915 12 0.460 0.520 0.508 0.260 0.443 0.332 0.213 0.207 0.213 0.113 0.048 - 0.914 0.905 0.902 0.917 13 0.422 0.482 0.480 0.261 0.414 0.295 0.211 0.113 0.108 0.087 0.089 0.090 - 0.942 0.911 0.910 14 0.433 0.472 0.460 0.220 0.416 0.278 0.197 0.109 0.117 0.107 0.102 0.099 0.060 - 0.999 0.989 15 0.436 0.471 0.456 0.222 0.418 0.275 0.199 0.112 0.119 0.111 0.105 0.104 0.099 0.001 - 0.989 16 0.443 0.484 0.479 0.211 0.422 0.282 0.190 0.109 0.110 0.094 0.089 0.087 0.095 0.011 0.011 - Numbers of taxa are same as the order from the upside to below of Table 1.
S. prunifolia
for.simpliciflora S. thunbergii
S. chamaedryfolia
var.ulmifolia S. media
S. cantoniensis S. blumei S. pubescens S. chartacea S. chinensis S. fritschiana S. betulifolia S. microgyna S. japonica S. salicifolia S. miyabei S. trichocarpa Physocarpus amurensis
Fig. 1. A phenetic tree for 16
Spiraea
taxa and one outgroup based on RAPD analysis.more similar in genetic constitution than those stands found on less distributed populations or sites.
The correlation coefficient between genetic distance and geographic distance using Mantel‘s test for all populations in Korea were 0.54 (r
2=0.29). Most of the variation (46.0%) in genetic distance seemed to be caused by unknown factors such as genetic drift, natural selection, and limited gene flow other than geographic distance. Thus the hypothesis of the isolation speciation from wild populations of widespread species needs to be tested by future work.
Phenetic relationship within Spiraea
At present, the phenetic positions of these species shown in Fig. 1 seem to be agreed partly with results of morpho- logical and molecular data [9]. Although S. chartacea has many hairs in leaves and S. pubescens is hairless, they are same clade and show little intra-specific variation. It is dif- ferent to distinguish among Spiraea complex because of the minglement of variety specific characteristics. The distinct taxonomic treatment among Spiraea is not also evidenced by nuclear ribosomal DNA internal transcribed spacer se- quences (ITS) data.
S. betulifolia can be classified as a narrow distribution as it grows only at middle parts of Korea such as Seoul. S.
chartacea was also endemic to the populations from the southern parts of islands of the Korean Peninsula. Although I did not analyze further subdivision of a local population, it may be inferred that RAPD variation that resided mainly within S. chartacea populations is maintained in patchily dis- tributed subpopulations or demes, either by random drift of neutral alleles or micro-environmental selection for adap- tive alleles according to geographic isolation. Zhang et al.
[22] also reported that the specific phylogeny of Spiraea is closely linked to the general floristic evolution and historical environmental changes in East Asia.
In a phenetic tree based on RAPD variability, the position of the taxa in the NJ tree and their morphological data did not almost completely matched in the Korean Spiraea.
However, it is relevant to stress that RAPD markers which
used allowed us to discriminate among all populations, even those that could not be distinguished on the basis of ITS analysis. Thus, RAPD markers are very effective in classify- ing wild populations of genus Spiraea in Korea.
References
1. Barrett, S. C. H., C. G. Eckert, and B. C. Husband. 1993.
Evolutionary processes in aquatic plant populations.
Aquatic Botany
44, 105-145.2. Bowman, K. D., K. Hutcheson, E. P. Odum, and L. R.
Shenton. 1971. Comments on the distribution of indices of diversity.
Stat. Ecol.
3, 315-359.3. Bussell, L. D. 1999. The distribution of random amplified polymorphic DNA (RAPD) diversity among populations of
Isotomapetraea
(Lobeliaceae).Mol. Ecol.
8, 775-789.4. Collard, B. C. Y. and D. J. Mackill. 2009. Start codon targeted (SCoT) polymorphism: a simple, novel DNA marker techni- que for generating gene-targeted markers in plants.
Plant Mol. Biol. Rep.
27, 86-93.5. Felsenstein, J. 1989. PHYLIP (Phylogeny Inference Package) version 3.2.
Cladistics
5, 164-166.6. Hamrick, J. L. and M. J. W. Godt. 1989. Allozyme diversity in plant species, pp. 43-63, In Brown, A. H. D., M. T. Clegg, A. L. Kahler, and B. S. Weir (eds.),
Plant population genetics, breeding and genetic resources
. Sinauer Associates, Sunderland, MA.7. Hamrick, J. L. and M. J. W. Godt. 1996. Effects of life history traits on genetic diversity in plant species, Philoso.
Trans.
Royal Soc. London Series B
351, 1291-1298.8. Kim, T. J. and B. Y. Sun. 1996. Taxonomy of the genus
Spiraea
in Korea.Kor. J. Plant Tax.
26, 191-212.9. Lee, Y. N. 2007.
New Flora of Korea
. pp. 522-527, Kyo-Hak Publishing Co., Seoul, Korea.10. Nei, M. 1973. Analysis of gene diversity in subdivided populations.
Proc. Natl. Acad. Sci. USA
70, 3321-3.11. Nei, M. and W. H. Li. 1979. Mathematical model for study- ing genetical variation in terms of restriction endonucleases.
Proc. Natl. Acad. Sci. USA
74, 5267-5273.12. Paul, S. P., F. N. Wachira, W. Powell, and R. Waugh. 1997.
Diversity and genetic differentiation among populations of
Indian and Kenyan tea (
Camelliasinensis
(L.) O. Kuntze) re- vealed by AFLP markers.Theor. Appl. Genet.
94, 255-263.13. Potter, D., S. M. Still, T. Grebenc, D. Ballian, G. Bozic, J.
Franjiae, and H. Kraigher. 2007. Phylogenetic relationships in tribe
Spiraceae
(Rosaceae) inferred from nucleotide se- quence data.Pl. Syst. Evol.
266, 105-118.14. Rashed, M. A., M. H. Abou-Deif, M. A. A. Sallam, and W.
A. Ramadan. 2008. Estimation of genetic diversity among thirty bread wheat varieties by RAPD analysis.
J. Appl. Sci.
Res.
4, 1898-1905.15. Saitou, N. and M. Nei. 1987. The neighbor-joining method:
A new method for reconstructing phylogenetic trees.
Mol.
Biol. Evol.
4, 406-425.16. Sawalha, K., H. Eideh, S. Laham, H. Hasasneh, and B.
Mezeid. 2008. Genetic diversity studies on wheat landraces in Palestine using RAPD markers in comparison to pheno- typic classification.
J. Appl. Biol. Sci.
2, 29-34.17. Thawaro, S. and S. Te-chato. 2008. RAPD (random amplified polymorphic DNA) marker as a tool for hybrid oil palm verification from half mature zygotic embryo culture.
J.
Agricult. Techno.
l4, 165-176.18. Woo, M.H., E. H. Lee, O. Chung, and C. W. Kim. 1996.
Constituents of
Spiraea prunifolia
var.simpliciflora
.Nat. Prod.
Sci.
27, 389-396.19. Wright, S. 1965. The interpretation of population structure by
F
-statistics with special regard to systems of mating.Evolution
19, 395-420.20. Yeh, F. C., R. C. Yang, T. J. Botle, Z. H. Ye, and J. X. Mao.
1997. POPGENE, the user friendly shareware for population genetic analysis. Molecular Biology and Biotechnology Centre, University of Alberta, Edmonton, Canada.
21. Yu, T. T. and L. T. Yu. 1974. Spiraea, pp. 1-36, In Yu, T.
T. (ed.),
Flora reipublic popularis sinicae. Angiospermae dicotyledonae.
Science Press, Beijing.22. Zhang, Z. Y., L. M. Fan, J. B. Yang, X. J. Hao, and Z. J.
Gu. 2006. Alkaloid polymorphism and ITS sequence varia- tion in the
Spiraea japonica
complex (Rosaceae) in China:tracts of the biological effects of the Himalaya-Tibet Plateau uplift.
Am. J. Bot.
93, 762-769.23. Zhang, Z.Y., H. Sun, and Z. J. Gu. 2002. Karyomorphological study of the
Spiraea japonica
complex (Rosaceae).Brittonia
54, 168-174.초록:조팝나무속 분류군의 RAPD에 의한 유전적 다양성과 관련성 허 만 규*
(동의대학교 분자생물학과)