Research Articles Open Access
57
Analysis of Genetic Diversity in Thirteen Turfgrass Cultivars Cultivated at Golf Courses Using RAPD Markers
Min-Jeong Kim
1, Tae-Soo Kim
2, Chang-Ki Shim
1*, Yong-Ki Kim
1and Hyeong-Jin Jee
11
Organic Agriculture Division, National Academy of Agricultural Science, Rural Development Administration, Suwon, Gyeonggi-do 441-707, Korea
2
Division of Applied Life Science Graduate School, Gyeongsang National University, Jinju, Gyeongsangnam-do 660-701, Korea
ABSTRACT. This study was carried our to examine the genetic relationship of 13 commercial turfgrass cultivars using Random Amplified Polymorphic DNA to provide genetic informations more efficient golf course management.
Analysis of 56 random hexamer primers generated 13 to 54 polymorphic bands among the 13 cultivars with an average of 30.7 bands per primer. The results of cluster analysis based on RAPDs revealed that three major variety groups:
Group I - ‘Shadow II’, ‘Aurora Gold’, ‘Little Bighorn Blue’, ‘PennA-1’, and ‘PennA-4’; Group II - ‘Midnight II’,
‘Prosperity’, ‘Moon light SLT’, ‘Bright star SLT’, and ‘Silver dollar’; and Group III - ‘Olympic Gold’, ‘Silver Star’, and ‘Tar Heel II’. The genetic similarity coefficients among 13 turfgrass cultivars ranged from 0.039 to 1.0 with highest coefficient in Group III. Studies on morphological characters and the effective molecular markers such as sequence characterized amplified regions are further needed to identify relationships and genetic diversities within species and among species.
Key words: Cultivar, Genetic similarity, Random Amplified Polymorphic DNA, Turfgrass
Introduction
Turfgrasses have low growing habit, prostrating tendency, high shoot density, and coarse-to-fine leaf texture (Beard, 1973; Alderson and Sharp, 1994). Most turfgrasses have been established, adapted, and persisted in areas distant from their initial origin (Beard, 1973). All cultivated turfgrass have been improved by selection and breeding from collected germpla and distributed mainly during the first half of 20th century (Hitchcock, 1950).
Warm-season turfgrasses have been used extensively as lawn grass or on athletic fields in subtropical and transitional zones because of their high stress tolerance such as drought and shade and excellent disease resistance (Beard, 1973;
Cockerham et al., 1994; Kim et al., 1987). Morphological classification of turfgrass cultivars has mostly been conduct- ed with multi-genic and quantitative traits, leaf blade color, texture, shape, length, blade angle, and growth habit (Rafalski and Tingery, 1993). The application of DNA technology in agricultural research has progressed rapidly over the last twenty years, especially in cultivar identification (Nyborm, 1990).
Among the turfgrass genera, common bermudagrass (Cynodon dactylon L. Pers.), tall fescue (Festuca arundinacea Schreb.), and perennial ryegrass (Lolium perenne L.) are perennial species wildly used in landscaping (Thorogood, 2003). Common bermudagrass is a member of the Poaceae family, Eragrostoideae sub-family, and Chlorideae tribe. It is a native of eastern Africa (Beard, 1973).
Recently, a wide range of molecular markers have been available. The techniques applied to turfgrass study include those that are based in nucleic acid hybridization, such as RFLP analysis (Botstein et al., 1980), those that selectively amplify highly informative genomic regions, such as SSR analysis (Litt and Luty, 1989; Weber and May, 1989), and those that scan nucleic acids by amplification, such as RAPD (Williams et al., 1990), DAF (Caetano-Anolles et al., 1991), and derived methods such as ASAP (Caetano-Anolles and Gresshoff, 1996), and RAFLP analysis (Sweeney and Danneberger, 1996).
PCR based methods require lower amounts of genomic DNA, are relatively low cost, and can be developed rapidly.
RAPD marker can be used in the systematic study of wild plants and new crops. A major advantage of RAPD markers over some other DNA based markers is that they require no prior sequence information, and no prior knowledge about any particular gene in a target taxon (Golembiewski et al., 1997; Palumbi, 1996; Al-Humaid and Motawei, 2004)
Continuous expansion will be hampered by turfgrass
*Corresponding author; Chang-Ki Shim Tel: +82-31-290-0545, Fax: +82-31-290-0507 E-mail: [email protected]
Received : July 31, 2012, Revised : August 14, 2012, Accepted :
September 04, 2012
susceptibility to disease and pest and its ability to adapt to the environment because of low genetic diversity of turfgrass species in Korea (Warnke et al., 1997; Choi and Yang, 2006;
Kubik et al., 2009). Golf course managers are now searching for alternative control of the disease (Im and Kim, 1999;
Chang et al., 2009; Chang et al., 2010).
This study analyzed the genetic diversity of the commercial turfgrass cultivars used as mono and hybridization components on golf courses in Korea to provide basic information on developing turfgrass cultivars.
Materials and Methods
Plant materials
A total of 13 commercial turfgrass cultivars from six species were used in the study: one chewing’s fescue (Festuca rubra L. spp. commutata Gaud., ‘Shadow II’); two creeping bentgrass (Agrostis palustris Huds., ‘PennA-1’ and
‘PennA-4’); two hard fescue (F. longifolia Thuill., ‘Aurora Gold’ and ‘Little Big Horn Blue’); three Kentucky bluegrass (Poa pratensis L., F. longifolia Thuill., ‘Midnight II’,
‘Moonlight SLT’, and ‘Prosperity’); two perennial ryegrass (Lolium perenne L., ‘Bright Star SLT’ and ‘Silver Dollar’);
and three tall fescue (F. arundinacea Schreb., ‘Olympic Gold’, ‘Silver Star’, and ‘Tar Heel II’) (Table 1). These cultivars were planted and maintained in the greenhouses for two months.
DNA extraction
DNA was extracted using modified Cetyltrimethyl ammonium bromide (CTAB) method (Doyle and Doyle, 1990). Genomic DNA was extracted from about 0.2 g of
individual leaf tissue sample of each of the 13 cultivars.
Each leaf sample was powdered finely with liquid nitrogen.
Genomic DNA was extracted in 750 µL of pre-warmed (65
oC) 1% CTAB buffer consisting of 1.5M NaCl, 100 mM Tris-HCl (pH 8.0), 20 mM EDTA, and 1% CTAB. The homogenate was incubated for 30min at 60
oC and saturated with equal volume of chloroform/isoamyl alcohol (24:1).
After being vortexed gently for three minutes the mixtures were centrifuged at 12,000 rpm for 10min at 4
oC. The supernatant was transferred to new tubes and cold isopropanol was added to 2/3 volume of supernatant. After 30 min on ice, genomic DNA was precipitated by centrifugation at 12,000 rpm for 10min at 4
oC. The pellets were washed with 70% ethanol and dissolved in TE buffer (pH 7.5). The quality of DNA was examined on a 1% agarose gel stained with ethidium bromide. The DNA concentration was quantified by Nano Drop system (Thermo, Wilmington, U.S.A.), diluted to working concentration of 10 ng/ µL, and stored at 4 o C.
PCR conditions and genotyping of the RAPD markers The PCR analysis followed the procedures by Bioneer PCR premix kit (Bioneer Co. Ltd., Korea). A total of 56 random hexamer primers were selected for assessing RAPD analysis of 13 turfgrass cultivars (Table 2). Polymorphic DNA bands were amplified with Bioneer premix kit (Bioneer Co. Ltd., Korea) in a reaction volume of 20 uL containing 16 uL of deionized distilled water, 2.0 uL of random primer, and 2 uL of template DNA (20 ng).
Amplifications were carried out in a MyGenie96 Thermal cycler (Bioneer Co. Ltd., Korea). The programmed DNA template was initially denatured at 94
oC for 5min, followed by 30 cycles of PCR amplifications with a 30-sec denatura- tion at 94
oC, 30-sec primer annealing from 42 to 60
oC, and a Table 1. List of turfgrass used in the study.
Cultivar Common name Scientific name
Shadow II Chewing’s fescue Festuca rubra L. spp. Commutata Gaud.
PennA-1 Creeping bentgrass Agrostis palustris Huds.
PennA-4 Creeping bentgrass A. palustris Huds.
Aurora Gold Hard fescue F. longifolia Thuill.
Little Big Horn Blue Hard fescue F. longifolia Thuill.
Midnight II Kentucky bluegrass Poa pratensis L.
Moonlight SLT Kentucky bluegrass P. pratensis L.
Prosperity Kentucky bluegrass P. pratensis L.
Bright Star SLT Perennial ryegrass Lolium perenne L.
Silver Dollar Perennial ryegrass L. perenne L.
Olympic Gold Turf-Type Tall fescue F. arundinacea Schrub.(syn. F. elatior, L. arundinaceum)
Silver Star Turf-Type Tall fescue F. arundinacea Schrub.(syn. F. elatior, L. arundinaceum)
Tar Heel II Turf-Type Tall fescue F. arundinacea Schrub.(syn. F. elatior, L. arundinaceum)
1-min primer extension at 72
oC allowing for completion of primer extension, with final extension at 72
oC for 10 min.
Initially, 5 µL of the amplified product was electrophoretically resolved in a 1.5% agarose gel in 0.5X Tris-acetate-EDTA (TAE) buffer (pH 8.0) and visualized under UV light after staining with 0.1 ug/ml of ethidium bromide (Et-Br). The polymorphic bands were scored “1” if present and “0” if absent. A similarity coefficient matrix was also formed. This matrix was analyzed by the “Power Marker” (http://statgen.
ncsu.edu/powermarker/) software to construct a dendrogram and principal coordinate analysis. Using this similarity coefficient matrix, genetic distance was analyzed by a UPGMA method.
Data analysis
The clear bands from the gel images were scored manually, either as present, “1” or absent, “0” and a similarity coefficient matrix was formed. The results were confirmed with NTSYS-pc (Version 2.0, Numerical Taxonomy and Multivariate Analysis System) software. Similarity matrix was calculated using SIMQUAL. Sequential, agglomerative, hierarchical, and nested clustering was carried out with unweighted pair- group method and arithmetic average (UPGMA) method. A simple matching coefficient was used to calculate the similarity coefficient matrix in NTSYS-pc.
Results and Discussion
Using RAPD analysis, 13 - 54 polymorphic bands were amplified and an average of 30.7 bands per primer generated.
Only two primers, P128 and P130 which exhibited 100%
polymorphic alleles, amplified the genetically varied bands,
while 16 primers formed a single band (Fig. 1 and Table 3).
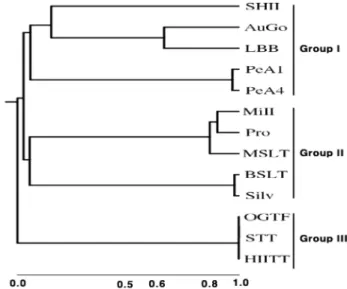
A dendrogram analysis showed that 13 turfgrass cultivars were divided into three major groups, Group I, Group II, and Group III; Group I included five cultivars, Shadow II,
‘Aurora Gold’, ‘Little Bighorn Blue’, ‘Penn A-1’, and ‘Penn A-4’. Also, Group II included five cultivars, ‘Midnight II’, Fig. 1. Polymorphism patterns with random primers P127 (A), P128 (B), P129 (C), P130 (D), P131 (E), and P133 (F) to identify genetic differences for 13 turfgrass cultivars. M lane: Molecular marker (100 bp of ladder DNA plus); lane 1: Shadow II; lane 2:
‘PennA-1’; lane 3: ‘PennA-4’; lane 4: ‘Aurora Gold’; lane 5:
‘Little Big Horn Blue’; lane 6: ‘Midnight II’; lane 7: ‘Moonlight SLT’; lane 8: ‘Prosperity’; lane 9: ‘Bright Star SLT’; lane 10:
‘Silver Dollar’; lane 11: ‘Olympic Gold’; lane 12: ‘Silver Star’
and lane 13: ‘Tar Heel II’.
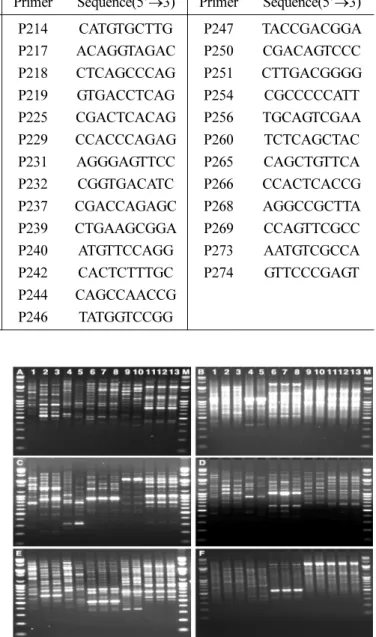
Table 2. List and information of random primers in this study.
Primer Sequence(5’→3) Primer Sequence(5’→3) Primer Sequence(5’→3) Primer Sequence(5’→3)
P127 ATCTGGCAGC P153 GAGTCACGAG P214 CATGTGCTTG P247 TACCGACGGA
P128 GCATATTCCG P154 TCCATGCCGT P217 ACAGGTAGAC P250 CGACAGTCCC
P129 GCGGTATAGT P156 GCCTGGTTGC P218 CTCAGCCCAG P251 CTTGACGGGG
P130 GGTTATCCTC P159 GAGCCCGTAG P219 GTGACCTCAG P254 CGCCCCCATT
P131 GAAACAGCGT P160 CGATTCAGAG P225 CGACTCACAG P256 TGCAGTCGAA
P133 GGAAACCTCT P167 CCAATTCACG P229 CCACCCAGAG P260 TCTCAGCTAC
P135 AAGCTGCGAG P171 TGACCCCTCC P231 AGGGAGTTCC P265 CAGCTGTTCA
P139 CCCAATCTTC P179 TCACTGTACG P232 CGGTGACATC P266 CCACTCACCG
P141 ATCCTGTTCG P182 GTTCTCGTGT P237 CGACCAGAGC P268 AGGCCGCTTA
P144 AGAGGGTTCT P183 CGTGATTGCT P239 CTGAAGCGGA P269 CCAGTTCGCC
P146 ATGTGTTGCG P185 GTGTCTTCAC P240 ATGTTCCAGG P273 AATGTCGCCA
P147 GTGCGTCCTC P189 TGCTAGCCTC P242 CACTCTTTGC P274 GTTCCCGAGT
P150 GAAGGCTCTG P197 TCCCCGTTCC P244 CAGCCAACCG
P151 GCTGTAGTGT P211 GAAGCGCGAT P246 TATGGTCCGG
‘Prosperity’, ‘Moon light SLT’, ‘Bright star SLT’, and
‘Silver dollar’. Group III included three cultivars, ‘Olympic Gold’, ‘Silver Star’, and ‘Tar Heel II’. This is confirmed by their genetic distance (Fig. 2).
The turfgrass cultivar classification is difficult because it has mostly relied on morphological characteristics that are multigenic, quantitative, and easily modified by environmen- tal factors. Individual performance of cultivars and varieties within each classification may be vary widely and require comparative observation (Rafalski and Tingery, 1993).
The genetic similarity of Group I, Group II, and Group III were 0.039~0.966, 0.827~0.977, and 1.0, respectively. Group III had the highest genetic similarity (Fig. 3 and Table 4).
Most of the cultivated pasture and turfgrasses originated from Eurasia (Hartley and Williams 1956). They were key elements in the migration of livestock agriculture throughout
Eurasia. Numerous perennial grasses have developed tolerance to saline soils in coastal salt marshes and beaches to rocky, alpine environments (Wu, 1981; Acharya et al., 1992).
Characterization of each accession of these species is critically important to be able to use turfgrass genetic breeding materials. Molecular markers are a powerful, reliable, and cost-effective tool for evaluating genetic diversity and can provide important insights for breeding. It is also necessary to identify the relationships and the differences of genetic diversity within species. Morphological studies need to be carried and the effective markers such as SCARs need further study.
This study revealed the genetic diversity of 13 turfgrass cultivars commercially used on the golf courses in Korea.
Turfgrass cultivars most widely used on the golf courses in Korea were effectively classified through morphological Table 3. Number of polymorphic bands amplified from 13 turfgrass cultivars with each random primer.
Primer No.
GC content (%)
No. of total bands
No. of single bands
Primer No.
GC content (%)
No. of total bands
No. of single bands
P127 60 34 2 P211 60 32 3
P128 50 26 0 P214 60 19 1
P129 50 44 5 P217 50 42 9
P130 50 36 2 P218 70 24 4
P131 50 52 8 P219 60 35 3
P133 50 20 0 P225 60 51 14
P135 60 23 2 P229 70 28 8
P139 50 32 4 P231 70 25 3
P141 50 44 6 P232 60 15 1
P144 50 26 4 P237 70 19 4
P146 50 25 4 P239 60 20 3
P147 70 26 1 P240 50 30 2
P150 60 26 6 P242 50 36 9
P151 50 43 10 P244 70 25 5
P153 60 13 2 P246 60 39 6
P154 60 18 1 P247 60 43 9
P156 70 20 2 P250 70 26 4
P159 70 54 13 P251 70 22 3
P160 50 23 5 P254 70 48 7
P167 50 44 7 P256 50 29 4
P171 70 32 6 P260 50 37 7
P179 50 40 9 P265 50 36 6
P182 50 45 5 P266 70 32 5
P183 50 41 8 P268 60 40 8
P185 50 24 5 P269 70 29 4
P189 60 32 4 P273 50 27 5
P197 70 30 3 P274 60 37 10
characterization. Their genetic similarity was analyzed based on RAPD data. These results can be providing basic information on identifying exported t turfgrass cultivars in the markets.
Acknowledgments
This research was supported by a grant program (PJ907129 022012) funded by Rural Development Administration Fig. 2. PCR band patterns generated by random primers P135
(A), P139 (B), P141 (C),P144 (D), P146 (E), and P 147 (F) to identify genetic differences for 13 turfgrass cultivars. M lane:
Molecular marker (100 bp of ladder DNA plus); lane 1: Shadow II; lane 2: ‘PennA-1’; lane 3: ‘PennA-4’; lane 4: ‘Aurora Gold’;
lane 5: ‘Little Big Horn Blue’; lane 6: ‘Midnight II’; lane 7:
‘Moonlight SLT’; lane 8: ‘Prosperity’; lane 9: ‘Bright Star SLT’;
lane 10: ‘Silver Dollar’; lane 11: ‘Olympic Gold’; lane 12:
‘Silver Star’and lane 13: ‘Tar Heel II.
Fig. 3. The genetic dendrogram of 13 turfgrass cultivars was constructed from similarity coefficients and showing the cluster- ing of the unweighted pair group average linkage of Pearson coefficients. SHII: ‘Shadow II’; PeA1: ‘PennA-1’; PeA4:
‘PennA-4’; AuGo: ‘Aurora Gold’; LBB: ‘Little Big Horn Blue;
MiII: ‘Midnight II’; MSLT: ‘Moonlight SLT’; Pro: ‘Prosperity’;
BSLT: ‘Bright Star SLT’; Silv: ‘Silver Dollar’; OGTF: ‘Olympic Gold’ ; STT: ‘Silver Star’ and HIITT: ‘Tar Heel II’.
Table 4. The genetic similarity matrix among 13 turfgrass cultivars used on golf courses in Korea based on Pearson coefficient (r).
SHII
x)PeA1 PeA4 AuGo LBB MiII MSLT Pro BSLT Silv OGTF STT HIITT
SHII 1 -0.087 -0.087 0.039 -0.011 -0.048 -0.071 -0.077 -0.107 -0.102 -0.021 -0.021 -0.021 PeA1 1 0.966 -0.076 -0.134 -0.126 -0.126 -0.098 -0.188 -0.181 -0.236 -0.236 -0.236 PeA4 1 -0.076 -0.134 -0.126 -0.108 -0.098 -0.188 -0.181 -0.253 -0.253 -0.253
AuGo 1 0.606 -0.157 -0.157 -0.183 -0.154 -0.148 -0.195 -0.195 -0.195
LBB 1 -0.134 -0.113 -0.160 -0.14 -0.134 -0.151 -0.151 -0.151
MiII 1 0.827 0.886 -0.089 -0.102 -0.173 -0.173 -0.173
MSLT 1 0.867 -0.110 -0.124 -0.173 -0.173 -0.173
Pro 1 -0.054 -0.087 -0.161 -0.161 -0.161
BSLT 1 0.977 -0.147 -0.147 -0.147
Silv 1 -0.140 -0.140 -0.140
OGTF 1 1 1
STT 1 1
HIITT 1
x
SHII: ‘Shadow II’; PeA1: ‘PennA-1’; PeA4: ‘PennA-4’; AuGo: ‘Aurora Gold’; LBB: ‘Little Big Horn Blue; MiII: ‘Midnight II’; MSLT: ‘Moon-
light SLT’; Pro: Prosperity’; BSLT: ‘Bright Star SLT’; Silv: ‘Silver Dollar’; OGTF: ‘Olympic Gold’ ; STT: ‘Silver Star’ and HIITT: ‘Tar Heel II’.
(RDA), Republic of Korea in 2012.
References
Alderson, J. and Sharp, W.C. 1994. Grass varieties in United States.
USDA-SCS Agriculture Handbook. 170. U.S. Gov. Print.
Office, Washington, DC.
Al-Humaid, A. and Motawei, M.I. 2004. Molecular characteriza- tion of some turfgrass cultivars using randomly amplified poly- morphic DNA (RAPD) markers. J. Food Agri. & Envi. 2:376- 380.
Acharya, S.N., Darroch, B.A., Hermesh, R. and Woosaree, J. 1992.
Salt stress tolerance in native alberta populations of slender wheatgrass and alpine bluegrass. Can. J. Plant Sci. 72:785-792.
Beard, J.B. 1973. Turfgrass: Science and Culture. Prentice-Hall, Engle-wood Cliffs, NJ. U.S.A.
Bostein, D., White, R.L., Skolnick, M. and Davis, R.W. 1980. Con- struction of a genetic linkage map in man using restriction frag- ment length polymorphisms. Am. J. Hum. Genet. 32:314-331.
Caetano-Anollés, G. and Gresshoff, P.M. 1996. Generation of sequence signatures from DNA amplification fingerprints with mini-hairpin and microsatellite primers. Biotechniques 20:
1044-1056.
Caetano-Anollés, G., Bassam, B.J. and Gresshoff, P.M. 1991.
DNA amplification fingerprinting using very shot arbitrary primers. Nature Biotech. 9:553-557.
Chang, S.W., Chang, T.H., Yang, G.M., Choi, J.S. and Rho, Y.T.
2010. Resistance evaluation of several turfgrass species and graminious crop species against Rhizoctonia cerealis and Typhula incarnate under controlled conditions. Korean Turf- grass Sci. 24:9-15. (In Korean)
Chang, S.W., Chang, T.H., Choi, B.J., Song, J.H., Park, K.S. and Rho, Y.T. 2009. Antagonistic effects of Pseudomonas spp. Against turfgrass pathogenic soil fungi. Korean Turfgrass Sci. 23:209- 218.
Choi, J.S. and Yang, G.M. 2006. Development of new cultivar
‘Millock’ in Zoysiagrass. Korean Turfgrass Sci. 20:1-10. (In Korean)
Cockerham, S.T., Gibeault, V.A. and Borgonovo, M. 1994. Traffic effects on turfgrasses under restricted light. California Turf- grass Culture 44:1-3.
Doyle, J.J. and Doyle, J.L. 1990. Isolation of plant DNA from fresh tissue. Focus 12:13-15.
Golembiewski, R.C., Danneberger, T.K. and Sweeney, P.M. 1997.
Potential of RAPD markers for use in the identification of creeping bentagrass cultivars. Crop Sci. 37:212-214.
Hartley, W. and Williams, R.J. 1956. Centres of distribution of cul- tivated pasture grasses and their significance for plant introduc- tion. pp. 190-199. In: Proc. 7
thInt. Grassland Conf., Palmerston
North, N.Z.
Hitchcock, A.S. 1950. Manual of the grasses of the United States.
USDA Misc. Publ. No. 200. U.S. Govt. Print., Washington, D.C.
Im, S.H. and Kim, D.H. 1999. Selection of resistant lines against large patch disease in Zoysiagrass. Pp. 9-10. In: Proceeding of Korean Turfgrass Soc. 12.
Kim, K.S., Sifers, S.I. and Beard, J.B. 1987. Comparative drought resistances among major warm-season turfgrass species and cultivars. Texas Turfgr. Res. Consolidated Prog. Rep. PR- 4521:28-30. Texas Agric. Exp. Stn., Texas A&M Univ., Col- lege Station, TX.
Kubik, C., Honig, J., William, A.M. and Stacy, A.B. 2009. Genetic diversity of creeping bentagrass cultivars using SSR markers.
Int. Turfgrass Soc. Res. J. 11:533-547.
Litt, M. and Luty, J.A. 1989. A hypervariable microsatellite revealed by in vitro amplification of a dinucleotide repeat within the cardiac muscle actin gene. Am. J. Hum. Genet.
44:397-401.
Nyborm, H. 1990. Application of DNA fingerprinting in plant breeding. Proc. Intern. DNA Fingerprinting Symposium. Bern, Switzerland. pp. 32-45.
Palumbi, S.R. 1996. Nucleic acid II: The polymerase chain reac- tion, pp. 205-247. In: D. M. Hillis, C. Mortiz, and B. K. Mable (Eds). Molecular systematic. Sinauer Assoc., Sunderlnd, Mass.
Rafalski, J.A. and Tingery, S.V. 1993. Genetic diagnostics in plant breeding: RAPDs, microsatellites and machines. Trends Gen.
9:275-280.
Sweeney, P.M. and Danneberger, T.K. 1996. Restriction digestion of arbitrary amplification fragments of annual bluegrass. Crop Sci. 36:1301-1303.
Thorogood, D. 2003. Chapter 7. Perennial Rygrass (Lolium perenne L.). In: Turfgrass Biology, Genetics, and Breeding. M.
D. Casler and R. D. Duncan (Eds). John Wiley & Sons, Inc.
Hoboken, N.J. pp 75-105.
Warnke, S.E., Douches, D.S. and Branham, B.E. 1997. Relation- ships among creeping bentagrass cultivars based on isozyme polymorphism. Crop Sci. 37:203-207.
Weber, J.L. and May, P.E. 1989. Abundant class of human DNA polymorphisms which can be typed using the polymerase chain reaction. Am. J. Hum. Genet. 44:388-396.
Williams, J.G.K., Kubelik, A.R., Livak, K.J., Rafalski, J.A. and Tingery, S.V. 1990. DNA polymorphisms amplified by arbi- trary primers are useful as genetic markers. Nucleic Acids Res.
18:6531-6535.
Wu, L. 1981. The potential for evolution of salinity tolerance in Agrostis stolonifera L. and Agrostis tenuis Sibth. New Phytol.
89:471-486.
RAPD 마커를 이용한 국내골프장의 잔디 13 품종의 유전적 다양성 분석
김민정
1·김태수
2·심창기
1*·김용기1·지형진
11