Studying the Genetic Diversity and Phenetic Relationships of Porphyra yezoensis Populations in Korea Using Random Amplified Polymorphic DNA (RAPD)
Young-Mog Kim
1, Sung-Hwan Eom
2and Man Kyu Huh
2*
1Department of Food Science & Technology, Pukyong University, Busan 48513, Korea
2Department of Food Science & Technology, Dong-eui University, Busan 47340, Korea Received August 22, 2018 /Revised November 8, 2018 /Accepted November 12, 2018
Porphyra yezoensis is a red algal species in the genus Porphyra. The phenetics and genetic diversity of four populations of
P. yezoensis in Korea were reconstructed using random amplified polymorphicDNA (RAPD) markers. Overall, 55 fragments were generated among the tested
P. yezoensis array with20 OPERON primers. A total of 30(54.5%) of these bands were polymorphic. The OPA-18-02 band was amplified in the samples of Nakdong population and absent in them of other three populations. The OPA-20-02 band was only amplified in the Seocheon population. Both bands exhibited distinctive pat- terns in specific populations. The effective number of alleles per locus (Ae) ranged from 1.161 to 1.293 with a mean of 1.366. The Seocheon population had a high expected diversity (0.163). The Nakdong population was an isolated endemic and intertidal zone. Thus the narrow distributed Nakdong pop- ulation had a low expected diversity (0.092). Shannon’s index of phenotypic diversity (I) of the Seocheon population (0.238) was the highest among all populations. Total genetic diversity (H
T) varied between 0.132 for OPA-02 and 0.420 for OPA-19. The interlocus variation of genetic diversity (H
S) was 0.059 for OPA-18 and 0.339 for OPA-19. On a per locus basis, the proportion of total genetic variation due to differences among populations (G
ST) ranged from 0.012 for OPA-11 to 0.762 for OPA-18 with a mean of 0.415, indicating that 42% of the total variation was found among these populations. In an assessment of the proportion of diversity present within this species, 58.5% (100%-41.5%) of genetic variation resided within the populations studied. The Nm was estimated to be low (0.705).
Key words : Genetic variation, OPERON primers, Porphyra yezoensis, RAPD
*Corresponding author
*Tel : +82-0505-182-6864, Fax : +82-51-890-1529
*E-mail : [email protected]
This is an Open-Access article distributed under the terms of the Creative Commons Attribution Non-Commercial License (http://creativecommons.org/licenses/by-nc/3.0) which permits unrestricted non-commercial use, distribution, and reproduction in any medium, provided the original work is properly cited.
Journal of Life Science 2019 Vol. 29. No. 2. 152~157 DOI : https://doi.org/10.5352/JLS.2019.29.2.152
Introduction
Due to the increase of the international trade in seafood and seafood products, there is a need for suitable methods for the identification of seaweed species or part of it to en- sure compliance with the labeling regulations, quality and pricing policies imposed by various countries and, thereby, to prevent the substitution of marine plant species.
For many years, seaweeds have also been cultivated and utilized directly as food for humans or as feed to produce food for human consumption. Since seaweeds grow in many climatic conditions globally, their cultivation has minimal impact on the environment. Porphyra is a cold-water sea- weed that grows in shallow seawater. More specifically, it
belongs to red algae phylum of laver species, comprising approximately 70 species [1]. It grows in the intertidal zone, typically between the upper intertidal zone and the splash zone in cold waters of temperate oceans. In East Asia, it is used to produce the sea vegetable products nori (in Japan) and gim (in Korea).
Random amplified polymorphic DNA (RAPD) markers represent amplification products from a polymerase chain reaction (PCR) utilizing arbitrary primers and genomic DNA [22]. The polymerase chain reaction (PCR) method has been used successfully to identify fish species and to avoid frau- dulent label. RAPD analysis is quick, robust, requires mini- mal preliminary work [10]. Based on the comparative analy- sis of RAPD patterns, it is impossible to determine whether fragments of the same size are homologous and are ampli- fied from the same region [15].
Although a large number of germplasm collections have
been established worldwide, many of them face major diffi-
culties due to large size and a lack of adequate information
about population structure and genetic diversity. There is
an increasing information that the quantity and quality of
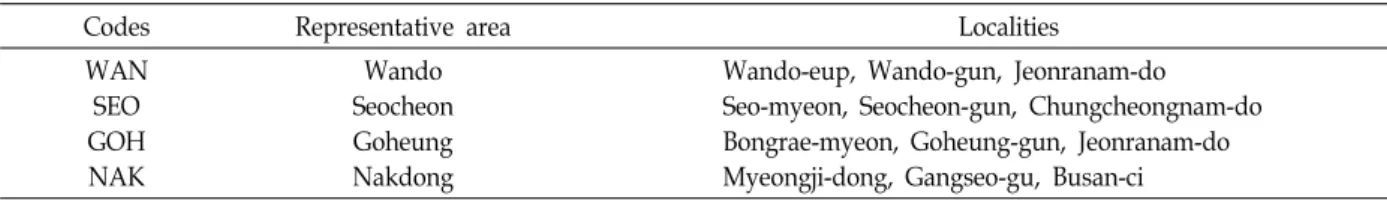
Table 1. Codes and geographic locations of four Porphyra yezoensis populations
Codes Representative area Localities
WAN SEO GOH NAK
Wando Seocheon Goheung Nakdong
Wando-eup, Wando-gun, Jeonranam-do Seo-myeon, Seocheon-gun, Chungcheongnam-do Bongrae-myeon, Goheung-gun, Jeonranam-do Myeongji-dong, Gangseo-gu, Busan-ci
genetic diversity and population structure possessed by pop-
ulations might influence their sustainability [6, 18].
Though RAPDs have the problem of limited repeatability, with the confounding factor that repeated DNA sequences are often amplified [3, 17]. These difficulties may be over- come if care is taken to ensure consistent reaction conditions during amplification [2].
The marine red alga, Porphyra yezoensis has been proposed as a model marine plant for physiological and genetic stud- ies of seaweed due to its biological and economic importance [19]. Important knowledge genetic variation for conservation purposes, detailed the levels and distribution of variation as well as population structure are not available for most algae taxa in Korea [5, 8, 20]. The objectives of this study were 1) to estimate how much genetic diversity is main- tained in P. yezoensis and to describe how genetic variation is distributed within and among populations and 2) to figure out how domestication process eroded levels of genetic var- iation cultivated as has been many species.
Materials and Methods
Sampling Procedure and DNA Extraction
All of the four populations of Porphyra yezoensis were col- lected from natural populations in Korea. The species sam- pled for this study are listed Table 1. To analyze the pro- portion of genetic diversity among and within populations, all samples were taken from two remote wild populations for each other. Twenty plants were randomly collected from each population.
The genomic DNA of the 80 samples including outgroup (Ulva prolifera) was extracted from fresh leaves. Total DNA was extracted using the plant DNA Zol Kit (Life Technolo- gies Inc., Grand Island, New York, U.S.A.) according to the manufacturer’s protocol. The DNA concentration of each sample was determined spectrometrically and was electro- phoresed on a 1.5% agarose gel to confirm quality.
RAPD analysis
Ten decamer oligonucleotides for PCR (polymerase chain
reaction) were purchased from BIONICS Inc. (Seoul, Korea).
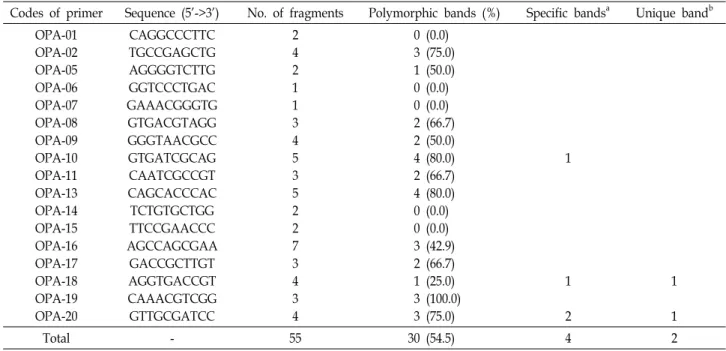
All the reactions were repeated twice and only reproducible bands were scored for analyses. From 20 decamer primers (OPA-01~OPAC-20) used for a preliminary RAPD analysis, the seventeen primers of them produced good amplification products both in quality and variability (Table 2).
The template for PCR amplification consisted of 20 ng ge- nomic DNA. The PCR amplifications were performed in a reaction volume of 12.5 μl containing 20 ng of genomic DNA, 5.0 pM primer, 10.5 μl of Prefect Shot Ex Taq PCR premix (TaKaRa Co, Japan); containing 0.4 mM dNTP, 4 mM Mg
2+, 1.25 units Taq DNA polymerase, and Orange G/Bromophe- nol Blue for electrophoresis. A 100 bp ladder DNA marker (Pharmacia) was used in the end of for the estimation of fragment size. PCRs were performed twice for reproduci- bility in an TaKaRa PCR Thermal Cycler (Model: TP-600, Japan). In addition, replicate accessions were assayed in sep- arate experiments to verify repeatability of results. The am- plification products were separated by electrophoresis on 1.5% agarose gels, stained with ethidium bromide, and pho- tographed under UV light using Alpha Image TM (Alpha Innotech Co., U.S.A.).
Data analysis
All RAPD bands were scored by eye and only unambigu- ously scored bands were used in the analyses. Because RAPDs are dominant markers, they were assumed that each band corresponded to a single character with two alleles, presence (1) and absence (0) of the band, respectively. For the RAPD resolved in more than one zone of activity, the most anodal migrating band was designated as '1', and other subsequent fragments were sequentially numbered.
The percentage of polymorphic loci (P
pfor population lev- el and P
sfor species level); mean numbers of alleles per locus (A); effective number of alleles per locus (A
e); gene diversity (H) [11], Shannon’s phonetic diversity (I) were computed with POPGENE 1.31 [23].
The phenotype frequency of each band was calculated
and used in estimating total diversity(H
T), genetic diversity
within populations (H
S) proportion of total genetic diversity
Table 2. List of decamer oligonucleotides utilized as primers, their sequences, and associated polymorphic fragments amplified in Porphyra yezoensis
Codes of primer Sequence (5’->3’) No. of fragments Polymorphic bands (%) Specific bandsa Unique bandb OPA-01
OPA-02 OPA-05 OPA-06 OPA-07 OPA-08 OPA-09 OPA-10 OPA-11 OPA-13 OPA-14 OPA-15 OPA-16 OPA-17 OPA-18 OPA-19 OPA-20
CAGGCCCTTC TGCCGAGCTG AGGGGTCTTG GGTCCCTGAC GAAACGGGTG GTGACGTAGG GGGTAACGCC GTGATCGCAG CAATCGCCGT CAGCACCCAC TCTGTGCTGG TTCCGAACCC AGCCAGCGAA
GACCGCTTGT AGGTGACCGT CAAACGTCGG GTTGCGATCC
2 4 2 1 1 3 4 5 3 5 2 2 7 3 4 3 4
0 (0.0) 3 (75.0) 1 (50.0) 0 (0.0) 0 (0.0) 2 (66.7) 2 (50.0) 4 (80.0) 2 (66.7) 4 (80.0) 0 (0.0) 0 (0.0) 3 (42.9) 2 (66.7) 1 (25.0) 3 (100.0) 3 (75.0)
1
1
2
1
1
Total - 55 30 (54.5) 4 2
a: Specific bands are found in all individuals of the species within same clade and absent from other clades.
b: Unique band is found in all individuals of the population and absent from other populations.
Table 3. Measures of genetic variation for Porphyra yezoensis. The number of polymorphic loci (Np), percentage of polymorphism (Pp), mean number of alleles per locus (A), effective number of alleles per locus (AE), gene diversity (H), and Shannon's information index (I)
Population Np Pp A AE H I
WAN SEO GOH NAK
19 22 20 15
34.6 40.0 36.4 27.3
1.345 1.400 1.364 1.273
1.175 1.293 1.222 1.161
0.108 0.163 0.132 0.092
0.167 0.238 0.198 0.141
Total 34 61.8 1.618 1.366 0.216 0.325
partitioned among populations (G
ST), and gene flow (Nm) [12].
A phenetic relationship was constructed by the neighbor- joining (NJ) method using the NEIGHBOR program in PHYLIP version 3.57 [4]. Relative support for clades was as- sessed using phylogenetic bootstrapping with 1,000 repli- cates [4].
Results
From the 20 decamer primers used for a preliminary RAPD analysis, seventeen primers of them produced good amplification products both in quality and variability (Table 2). Overall, 55 fragments were generated among the tested P. yezoensis array. A total of 30(54.5%) of these bands were polymorphic. The remaining fragments were monomorphic
in all taxa. The number of bands for each primer varied from one to seven with an average of 3.2 fragments per primer.
The size of the amplified products ranged from 250 to 1,800 bp.
The OPA-18-02 band was amplified for Nakdong pop- ulation, which was absent in the rest of three populations.
The OPA-20-02 band was only amplified for Seocheon population. Both bands were exhibited the useful patterns of distinction in specific population.
In a simple measure of intrapopulation variability by the
percentage of polymorphic bands, Seocheon population
showed the highest (40.0%)(Table 3). Nakdong population
exhibited the lowest variation (27.3%). Mean number of al-
leles per locus (A) ranged from 1.273 to 1.400 with a mean
of 1.618. The effective number of alleles per locus (Ae)
ranged from 1.161 to 1.293 with a mean of 1.366.
Table 4. Estimates of genetic diversity of Porphyra yezoensis.
Total genetic diversity (HT), genetic diversity within populations (HS) proportion of total genetic diversity partitioned among populations (GST), and gene flow (Nm)
Primer HT (SD) HS (SD) GST Nm
OPA-02 OPA-05 OPA-08 OPA-09 OPA-10 OPA-11 OPA-13 OPA-16 OPA-17 OPA-18 OPA-19 OPA-20
0.132 0.250 0.180 0.179 0.408 0.226 0.324 0.147 0.260 0.249 0.420 0.366
0.114 0.243 0.166 0.092 0.228 0.223 0.114 0.098 0.117 0.059 0.339 0.156
0.134 0.026 0.075 0.485 0.441 0.012 0.649 0.334 0.551 0.762 0.194 0.572
3.226 18.535
6.172 0.531 0.635 40.328
0.270 0.998 0.408 0.156 2.083 0.374
Total 0.221 0.129 0.415 0.705
Table 5. Genetic identity (upper diagonal) among four pop- ulations of Porphyra yezoensis and genetic distances (low diagonal) based on RAPD analysis
Population WAN SEO GOH NAK
WAN SEO GOH NAK
- 0.123 0.082 0.216
0.885 - 0.144 0.194
0.921 0.866 - 0.135
0.806 0.824 0.874 -
Fig. 1. A phenogram showing the relationships among four populations of Porphyra yezoensis and one outgroup (Ulva prolifera) based on data of genetic distance ob- tained by RAPD.
The phenotypic frequency of each band was calculated and used in estimating genetic diversity (H) within species.
As the typical cultivated populations were isolated, and patchily distributed for aquaculture sea, they maintained a low level of genetic diversity for seventeen primers. The mean of H was 0.216 across species, varying from 0.092 to 0.163. In particular, Seocheon population had high expected diversity (0.163). Isolated endemic and intertidal zone, Nakdong population had the lowest (0.092). Shannon’s index of phenotypic diversity (I) of Seocheon population (0.238) was the highest among all populations and Goheung pop- ulation was the second (0.198).
Total genetic diversity (H
T) varied between 0.132 for OPA-02 and 0.420 for OPA-19 (Table 4). The interlocus varia- tion of genetic diversity (H
S) varied between 0.059 for OPA-18 and 0.339 for OPA-19 (Table 4). On a per locus basis, the proportion of total genetic variation due to differences among populations (G
ST) ranged from 0.012 for OPA-11 to 0.762 for OPA-18 with a mean of 0.415, indicating that 42%
of the total variation was found among populations. An as- sessment of the proportion of diversity present within spe- cies, 58.5% of genetic variation resided within populations.
The Nm was estimated to be low (0.705).
Genetic identity (I) based on the proportion of shared fragments was used to evaluate relatedness among pop- ulations. The estimate of I ranged from 0.082 to 0.216(Table 5).
Clustering of populations, using the NJ algorithm, was performed based on the matrix of calculated distances (Fig.
1). The tree showed genetic differentiation among Korean Porphyra yezoensis. The phylogenic tree showed two or three distinct clades. One includes Wando population and Go- heung population. The other includes Seocheon population.
The last was Nakdong population.
Discussion
Among 55 bands, 30(54.5%) bands for four P. yezoensis populations were polymorphic. The levels of genetic varia- tion found within Korean populations of P. yezoensis were low in relation to the mean value of results of same species.
Interspecies diversity of this species accounted for 33% of
the total genetic diversity [6]. The proportion of polymorphic
loci was 0.333 and heterozygosity (H) over 12 loci varied
from 0.100 to 0.141 with a mean of 0.127 using allozyme
analyses [5]. In this study, the mean of H was 0.216 across
species, varying from 0.092 to 0.163. Although there is not
a significant difference, diversity indices of RAPD analysis
were higher those of isozyme. diversity indices of RAPD
analysis were higher those of isozyme. Whereas, processes
such as transposition, gene rearrangement, gene amplifica-
tion and deletion can change a genome rapidly, even within
the lifetime of an organism [21].
Natural populations of P. yezoensis showed remarkably higher genetic variations than found in strains that are cur- rently used for cultivation [14]. The low genetic diversity and shallow genetic differentiation found within cultivated populations are likely caused by continuous selection and the clonal propagation methods used during domestication.
Today, nori (Porphyra spp., eg, Porphyra tenera, Porphyra pseudolinearis, and Porphyra yezoensis) is one of the most ubiq- uitous of the seaweeds used for human consumption in East Asia [10, 19].
Porphyra yezoensis and P. tenera are extremely similar to each other in morphology, their breedeers have tentatively classified many strains of cultivated into the two species without strict species identification [13]. Pure lines were iso- lated from young gametophytic blades of pigmentation and morphological traits by Hwang et al. [8]. Crossing between Porphyra yezoensis and P. tenera was performed using their color mutant types as genetic markers [20]. These results show that incomplete mechanism of reproductive isolation exists between P. yezoensis and P.tenera; this suggests the re- ality of biological species in the genus Porphyra. Kong et al.
[9] report the complete mitochondrial DNA sequences of P.
yezoensis. The comparison analyses showed that obvious var- iation occurred on the gene content and gene structure among P. yezoensis. P. haitanensis and P. purpurea. The cleaved amplified polymorphic sequence analyses provide a good basis for initiating linkage analysis after cross-fertil- ization among the strains of P. yezoensis and related species [16]. Cox sequence analysis divided the 27 Korean P. ye- zoensis strains into four types; the presence / absence of in- trons in rnl and cox1 genes divided the 27 Korean P. ye- zoensis strains into 12 types [7].
Out of the 55 bands, only two fragments are specific for one cultivar. The efficiency to find a RAPD marker useful for purity determination was 3.6%. Both bands were effec- tive marker system for specific P. yezoensis populations. It is proposed that similar lineages from parents and bulks are used to our experiments.
These results imply the importance of collecting and es- tablishing more strains of cultivated Porphyra species and related wild species from natural populations as genetic re- sources for further improvement of cultivated Porphyra strains [14].
Acknowledgement
This research was a part of the project titled 'Yeongnam Sea Grant', funded by the Ministry of Oceans and Fisheries, Korea. (D11710618H480000110, 20170346).
References
1. Brodie, J. A. and Irvine, L. M. 2003. Seaweeds of the British Isles. Volume 1 Part 3b. The Natural History Museum, London.
2. Bustos, A. D., Casanova, C., Soler, C. and Jouve, N. 1998.
RAPD variation in wild populations of four species of the genus Hordeum (Poaceae). Theor. Appl. Genet. 96, 101-111.
3. Devos, K. M. and Gale, M. D. 1992. The use of random am- plified polymorphic DNA markers in wheat. Theor. Appl.
Genet. 84, 567-572.
4. Felsenstein, J. 1985. Confidence limits on phylogenies: An approach using the bootstrap. Evolution 39, 783-791.
5. Fusio, Y., Kodaka, G. and Hara, M. 1985. Genetic differ- entiation and amount of genetic variability in natural pop- ulations of the haploid laver Porphyra yezoensis. Jpn. J. Genet.
60, 347-354.
6. Huh, M. K., Lee, B. K. and Lee, H. Y. 2006. Genetic diversity and phylogenetic relationships in five Porphyra species re- vealed by RAPD analysis. Protistology 4, 245-250.
7. Hwang, I. K., Kim, S. O., Hwang, M. S., Park, E. J., Ha, D. S. and Lee, S. R. 2018. Intraspecific variation of gene structure in the mitochondrial large subunit ribosomal RNA and cytochrome c oxidase subunit 1 of Porphyra yezoensis (Bangiales, Rhodophyta). Algae 33, 49-54.
8. Hwang, M. S., Kim, S. O., Lee, Y. S., Park, E. J., Kim, S.
C., Ha, D. S., Gong, Y. G. and Baek, J. M. 2018. Isolation and characterization of pure lines of pigmentation and mor- phological mutants in Porphyra tenera Kjellman (Bangiales, Rhodophyta). Kor. J. Fish Aquat. Sci. 43, 495-502.
9. Kong, F., Sun, P., Cao, M., Wang, L. and Mao, Y. 2014.
Complete mitochondrial genome of Porphyra yezoensis: re- asserting the revision of genus Porphyra. Mitochondrial DNA 25, 335-336.
10. Mahadevan, K. 2015. Seaweeds: a sustainable food source, pp. 347-364. In Tiwari, B. K. and Declan, J. T. (eds.), Seaweed Sustainability. Food and Non-Food Applications. Academic Press, Ireland.
11. Molnar, S. J., James, L. E. and Kasha, K. J. 2000. Inheritance and RAPD tagging of multiple genes for resistance to net blotch in barley. Genome 43, 224-231.
12. Nei, M. 1973. Analysis of gene diversity in subdivided populations. Proc. Natl. Acad. Sci. USA. 701, 3321-3323.
13. Niwa, K. and Aruga, Y. 2006. Identification of currently cul- tivated Porphyra species by PCR-RFLP analysis. Fish. Sci.
72, 143-148.
14. Niwa, K., Iida, S., Kato, A., Kawai, H., Kikuchi, N., Kobiya- ma, A. and Aruga, Y. 2007. Genetic diversity and introg- ression in two cultivated species (Porphyra yezoensis and
초록:RAPD를 이용한 한국 김 집단의 유전적 다양성과 표현형 관계
김영목
1․엄성환
2․허만규
2*
(1부경대학교 식품공학과, 2동의대학교 식품공학과)
김(Porphyra yezoensis)은 김속의 홍조류이다. RAPD (random amplified polymorphic DNA) 마커를 이용하여 한국 내 네 집단의 표현형과 유전적 다양성을 조사하였다. 전체적으로 20 시발체로 김에서 55분절이 관찰되었다.
이들 밴드 중 30개(54.5%)는 다형성을 나타내었다. OPA-18-02 밴드는 낙동 김 집단에서만 증폭되었다. OPA-20-02 밴드는 서천 김 집단에서만 증폭되었다. 이 두 밴드는 특별한 집단을 구별해주는 특이밴드로 판정되었다. 대립유 전자좌위의 수(Ae)는 1.161에서 1.293로 평균은 1.366였다. 서천 김 집단이 가장 높은 다형성을 나타내었다(0.163).
다른 집단과 격리되고 조간대에 위치한 낙동 김 집단은 가장 낮은 다형성을 나타내었다(0.092). 샤논의 표현형 다 양성(I)은 서천 김 집단이 가장 높았다(0.238). 전체 유전적 다양도(H
T)는 0.132(OPA-02)에서 0.420(OPA-19)로 나타
났다. 대립유전자좌위에서 유전적 다양성(H
S)은 0.059(OPA-18)에서 0.339(OPA-19)였다. 대립유전자좌위에 근거에
서 전체 유전적 다양도에서 집단 간 차이(G
ST)는 0.012(OPA-11)에서 0.762(OPA-18)이였으며 평균은 0.415였다. 이 는 전체 변이의 약 42%는 집단 간에서 발견된다는 것을 의미한다. 종 내 다양도의 58.5%는 집단 내에 있었다.
유전자 흐름(Nm)은 0.705로 낮았다.
Porphyra tenera) and closely related wild species of Porphyra (Bangiales, Rhodophyta)(1). J. Phycol. 45, 493-502.
15. Nkongolo, K. K., Deverno, L. and Michael, P. 2003. Genetic validation and characterization of RAPD markers differ- entiating black and red spruces: molecular certification of spruce trees and hybrids. Plant Syst. Evol. 236, 151-163.
16. Park, E. J., Fukuda, S., Endo, H., Kitade, Y. and Saga, N.
2007. Genetic polymorphism within Porphyra yezoensis (Ban- giales, Rhodophyta) and related species from Japan and Korea detected by cleaved amplified polymorphic sequence analysis. Eur. J. Phycol. 42, 29-40.
17. Penner, G. A., Chong, J., Levesque-Lemay, M., Molnar, S.
I. and Fedak, K. G. 1993. Identification of a RAPD marker linked to the oat stem rust gene Pg3. Theor. Appl. Genet. 85, 702-705.
18. Reed, D. H. and Frankham, R. 2003. Correlation between fitness and genetic diversity. Conserv. Biol. 17, 230-237.
19. Saga, N. and Kitade, Y. 2002. Porphyra: a model plant in marine sciences. Fish. Sci. 68, 1075-1078.
20. Shin, J. A. 2009. Crossing between Porphyra yezoensis and P. Tenera. Algae 14, 73-77.
21. Walbot, V. and Cullis, C. A. 1985. Rapid genomic change in higher plants. Annu. Rev. Plant Physiol. 36, 367-396.
22. Williams, J. G. K., Kubelik, A. R. Livak, K. J., Rafalski, J.
A. and Tingey, S. V. 1990. DNA polymorphism amplified by arbitrary primers are useful as genetic markers. Nucleic Acid Res. 18, 6531-6535.
23. Yeh, F. C., Yang, R. C. and Boyle, T. 1999. POPGENE Version 1.31, Microsoft Windows-based Freeware for Popu- lation Genetic Analysis. University of Alberta, Alberta.