저작자표시-비영리-변경금지 2.0 대한민국 이용자는 아래의 조건을 따르는 경우에 한하여 자유롭게
l 이 저작물을 복제, 배포, 전송, 전시, 공연 및 방송할 수 있습니다. 다음과 같은 조건을 따라야 합니다:
l 귀하는, 이 저작물의 재이용이나 배포의 경우, 이 저작물에 적용된 이용허락조건 을 명확하게 나타내어야 합니다.
l 저작권자로부터 별도의 허가를 받으면 이러한 조건들은 적용되지 않습니다.
저작권법에 따른 이용자의 권리는 위의 내용에 의하여 영향을 받지 않습니다. 이것은 이용허락규약(Legal Code)을 이해하기 쉽게 요약한 것입니다.
Disclaimer
저작자표시. 귀하는 원저작자를 표시하여야 합니다.
비영리. 귀하는 이 저작물을 영리 목적으로 이용할 수 없습니다.
변경금지. 귀하는 이 저작물을 개작, 변형 또는 가공할 수 없습니다.
수의학박사학위논문
포도당 결핍에 따른 종양조직
구성세포들의 표현형 및 분자생물학적 특성 변화
Glucose deficiency-induced changes in tumor tissues: Phenotypic and molecular aspects
2021 년 8 월
서울대학교 대학원
수의학과 수의병인생물학 및 예방수의학 전공
황 성 현
Glucose deficiency-induced changes in tumor tissues: Phenotypic and molecular aspects
By
Sung-Hyun Hwang
A dissertation submitted to the faculty of the Graduate School of Seoul National University in partial fulfillment of the requirements for the degree of Doctor of Philosophy in
Veterinary Pathobiology and Preventative Medicine
Supervised by
Professor Yongbaek Kim, D.V.M., Ph.D.
August 2021
Department of Veterinary Medicine The Graduate School
Seoul National University
i
ABSTRACT
Glucose deficiency-induced changes in tumor tissues: Phenotypic and molecular aspects
(Supervisor: Yongbaek Kim, D.V.M., Ph.D.)
Sung-Hyun Hwang
Department of Veterinary Medicine Graduate School of Veterinary Medicine
Seoul National University
Within a hostile tumor microenvironment, irregular vasculature and aerobic glycolysis induce a glucose deficiency. Tumor mass is constituted with cancerous and non-cancerous cells such as cancer- associated fibroblasts (CAFs) and tumor-infiltrating lymphocytes (TILs). Compared to normal counterparts, those cells are acquired different phenotypes and metabolism, and their crosstalk enforces the tumor progression. However, the comprehensive impact of glucose deficiency in cancer cells, CAFs and TILs have not been elucidated. In this study, we investigated that glucose deficiency renders metabolic reprogramming in cancer cells, CAFs and TILs compared to complete condition and promote tumor progression.
ii
The effect of glucose deficiency on phenotype of human malignant mesothelioma (HMM) cells remains unclear. Our data demonstrated that survived HMM cells by glucose deficiency enhanced the resistance to metformin treatment with upregulation of multidrug resistance protein 1 (MDR1) expression in mitochondria. Adapted HMM cells to glucose deficiency showed an irregular mitochondrial metabolic status with elongated morphology and dysfunction including mitochondrial membrane potential (MMP) hyperpolarization.
Intriguingly, increased MDR1 expression in the cells was suppressed by treatment of carbonyl cyanide m-chlorophenyl hydrazine (CCCP), an inducer for MMP depolarization. In MDR1-knockout (KO) cells, sensitivity to metformin was dramatically augmented compared to parental cells with upregulation of apoptosis and autophagy.
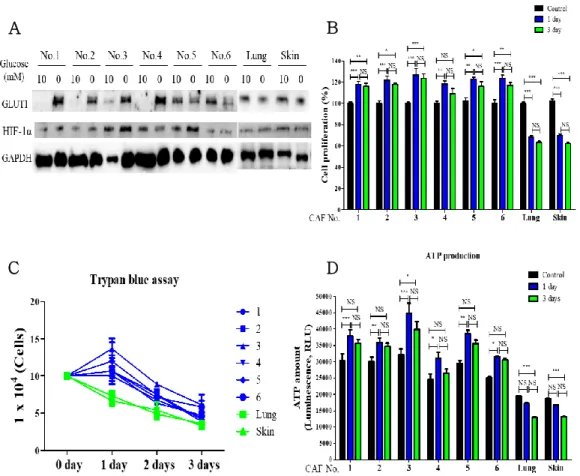
CAFs are major components in non-cancerous stromal cells in tumor microenvironment and protecting cancer cells. However, compared to normal fibroblasts (NFs), distinctive characteristics of CAFs under glucose-deficient conditions are rarely studied. Irregular vasculature induces the heterogeneous response in tumor mass. To determine the heterogeneous response in CAFs, we dissected a tumor mass as 6 pieces and isolated CAFs from each piece. The ATP production and proliferation were enhanced in CAFs under glucose-deficient condition, but not in NFs. Moreover, their patterns were consistent in whole CAFs, but the degree was heterogeneous. In contrast to NFs, transforming growth factor-β (TGF-β) signaling and mitochondrial
calcium uniporter (MCU) expression was higher in CAFs and more enhanced under glucose-deficient condition, but these phenotypes were suppressed by inhibition of TGF-β signaling. Intriguingly, treatment of Ru360, a selective MCU inhibitor also mitigated the TGF- β signaling in CAFs. The influx of calcium into mitochondria enhanced the ATP production in CAFs by activation of ATP synthase. However, treatment of ATP synthase inhibitor enhanced the apoptosis by excessive calcium influx into mitochondria via inactivation of mitochondrial permeability transition pore.
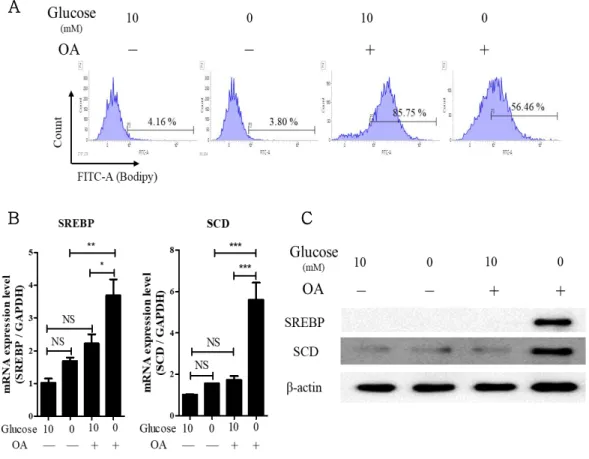
CAFs reinforces the cancer cell malignancy via direct- and soluble- factor mediated communication. Here, we demonstrated that CAFs- derived lipids especially oleic acid (OA) were transition into H460 cells via lipid transporter and enhanced stearoyl-CoA desaturase (SCD) expression under glucose-deficient conditions. Expression of SCD augmented autophagic response in CAF-supernatant treated H460 cells under glucose-deficient condition and promoted stemness, but their phenotypes were suppressed by treatment of CAY10566, a selective SCD inhibitor. SCD-overexpressing cells exhibited enhancement of stemness with nuclear localization of YAP through actin-polymerization compared to parental and SCD-KO cells.
Furthermore, a larger size of tumor was observed in SCD- overexpressing cells injected mice than parental cells, whereas SCD- KO cells resulted in smaller tumors. Additionally, SCD was correlated with poor prognosis in patients with lung adenocarcinoma.
iv
CAFs-derived OA was also transferred in CD4+ tumor-infiltrating lymphocytes (TILs) and augmented SCD expression under glucose- deficient condition. In CD4+ TILs, SCD enhanced the phenotype of Th1 cell including IL-2, tumor necrosis factor-α, T-bet and interferon-γ expression, whereas regulatory T cell (Treg) phenotype including CD25, Foxp3 and TGF-β were suppressed. However, it was reversed by treatment of CAY10566. SCD biosynthesized unsaturated fatty acid from saturated fatty acids. Amounts of OA, unsaturated fatty acids, was increased in SCD overexpressed T cells and upregulated the phenotype of Th1 cell. However, enrichment of palmitic acid (PA) among saturated fatty acids in SCD-KO cells enhanced Treg cell phenotype. Moreover, a robust secretion of C-X-C motif chemokine 11 (CXCL11) from SCD-upregulated CD4+ T cells activated CXC- chemokine receptor 3 (CXCR3) signaling in CD8+ T cells, improving cancer-killing effect in 4T1 mouse model.
Collectively, the present study demonstrated that glucose deficiency is impacted on the cancer cell malignancy and induces metabolic reprogramming in CAFs and TIL. For a better understanding of the effects of glucose deficiency, our data provide a detailed mechanism and phenotypes in cancer cells, CAFs and TIL. These features aimed approach could enhance anticancer therapeutics.
Keywords: Tumor microenvironment, Glucose-deficient condition, Cancer cell, Cancer-associated fibroblasts, Tumor-infiltrating lymphocyte, Lipid metabolism, Anticancer.
Student Number: 2016-21772
CONTENTS
ABSTRACT ... i
CONTENTS ... v
ABBREVIATIONS ... viii
LITERATURE REVIEW ... 1
Glucose deficiency in tumor microenvironment ... 1
The role of CAFs in tumor microenvironment ... 8
Lipid metabolism in tumor malignancy ... 13
Escape of immunosurveillance in tumor immune microenvironment ... 17
Summary ... 22
CHAPTER I. Glucose deficiency enhanced the drug resistance by upregulation of mitochondrial MDR1 Abstract ... 24
Introduction ... 25
vi
Materials and Methods ... 28
Results ... 36
Discussion ... 54
CHAPTER II. Cancer-associated fibroblasts survived under glucose-deficient conditions with excessive calcium influx into mitochondria Abstract ... 60
Introduction ... 61
Materials and Methods ... 63
Results ... 69
Discussion ... 91
CHAPTER III. Oleic acid from CAF promoted stemness in H460 cells through YAP nuclear translocation under glucose-deficient condition Abstract ... 96
Introduction ... 97
Materials and Methods ... 100
Results ... 107
Discussion ... 139
CHAPTER IV. Crosstalk between CAF-derived oleic acid and CD4+ T cells enhanced the phenotype of Th1 cells under glucose-deficient condition Abstract ... 144
Introduction ... 145
Materials and Methods ... 148
Results ... 157
Discussion ... 201
GENERAL CONCLUSION ... 206
REFERENCES ... 207
국문초록 ... 239
viii ABBREVIATIONS
HMM: Human malignant mesothelioma H460: NCI-H460
ROS: Reactive oxygen species
EMT: Epithelial to mesenchymal transition MDR1: Multi drug resistance protein 1
ABCG2: ATP-binding cassette super-family G member 2 CSCs: Cancer stem cells
TGF-β: Transforming growth factor beta OCT4: Octamer-binding transcription factor 4 YAP: Yes-associated protein
CAF: Cancer-associated fibroblast MCU: Mitochondrial-calcium uniporter SCD: Stearoyl-CoA desaturase
SREBP: Sterol regulatory element binding protein TIL: Tumor-infiltrating lymphocyte
CXCL11: C-X-C chemokine ligand 11 CXCR3: C-X-C chemokine receptor 3 IFN-γ: Interferon-γ
TNF-α: Tumor necrosis factor-α
RT-PCR: Reverse transcription polymerase chain reaction qPCR: Quantitative polymerase chain reaction
Glut-1: Glucose transporter 1
HIF-1α: Hypoxia-inducible factor-1α
GAPDH: Glyceraldehyde 3-phosphate dehydrogenase MMP: Mitochondrial membrane potential
mPTP: Mitochondrial permeability transition pore mtROS: mitochondrial reactive oxygen species OXPHOS: Oxidative phosphorylation
MTT: 3-(4,5-dimethylthiazol-2-yl)-2,5-diphenyl tetrazolium bromide JC-1: 5,5',6,6'-tetrachloro-1,1',3,3' -tetraethyl- benzimidazolylcarbocyanine chloride
CCCP: Carbonyl cyanide m-chlorophenyl hydrazone
1 LITERATURE REVIEW
Glucose deficiency in tumor microenvironment
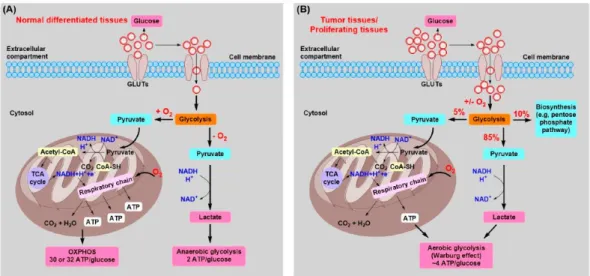
Compared to normal cells, the glycolysis pathway is different in cancer cells. In normal cells, glucose is metabolized to produce pyruvate for activation of TCA cycle and lactate is occasionally biosynthesized from pyruvate upon environmental stress conditions such as hypoxia (Hu et al.
2017). On the other hand, cancer cells generally produce lactate from glucose and activate aerobic glycolysis to generate ATP more than glycolysis. To meet the energy demand of cancer cells for rapid proliferation, generated ATP by aerobic glycolysis is quickly wasted and leads to glucose-deficient condition in tumor hostile microenvironment (Liberti 2016) (Fig. 1). Indeed, the concentration of glucose is lower in tumor interstitial fluid than normal plasma in the mice model (Sullivan et al. 2019).
The concentration of glucose is lower in colon and stomach tumor (123
± 43, 424 ± 131 nmol/g) than in normal counter parts (1220 ± 150, 1290
± 168 nmol/g) (Hirayama et al. 2009). Moreover, angiogenesis is advanced in tumor mass to supply the energy and oxygen for growth. As closer to the vasculature, tumor cells acquire more glucose and nutrient more than the distal region, resulting in a glucose-deficient condition in the region (Jeong and Deasy 2014) (Fig. 2). Thus, glucose deficiency encounters not only cancer cells but also non-cancerous cells including cancer-associated fibroblasts (CAFs), endothelial and immune cells (Lin et al. 2020).
Glucose deficiency induces the metabolic reprogramming rather than glycolytic pathway, leading to physiological and pathological change in cancer cells (Lin et al. 2019). In cancer cells, alternative metabolisms using glutamine and lipid are activated to compensate for the energy in the absence of glucose. Glutamine-mediated TCA cycle is activated in cancer cells by the loss of protein kinase C to produce energy under glucose- deficient condition (Ma et al. 2013). The aerobic glycolysis induces lipid metabolic reprogramming rather than canonical glycolysis such as pentose phosphate and hexosamine pathway (Vander Heiden et al. 2009, Hay 2016).
Indeed, glucose level and glycolysis are significantly mitigated in fasted mice compared to fed mice, but lipid and cholesterol metabolisms are substantially activated dependent on sirtuin1 expression (Rodgers and Puigserver 2007). Under glucose-deficient conditions, lipid metabolism is reprogrammed to provide the energy (Snaebjornsson et al. 2020).
Mechanically, increased 3-oxoacid CoA-transferase 1 (OXCT1) by phosphorylation of Akt activates the lipid metabolism under glucose- deficient condition and induces the acetyl-CoA synthesis for activation of TCA cycle (Huang et al. 2016). Additionally, under glucose-deficient condition, stored lipids are digested by autophagic response and generate fatty acids to provide lipid metabolism and energy source (Singh et al. 2009, Roa-Mansergas et al. 2018). However, impairment of autophagy by deletion of Atg 5 and 7 genes suppresses the lipid metabolism through impairment of PPARα expression (Saito et al. 2019).
3
Additionally, glucose deficiency augments autophagic response through upregulation of AMP-activated protein kinase (AMPK) (Liu et al. 2020).
Mechanistically, AMPK induces the phosphorylation of tuberous sclerosis complex 2 and suppresses the mammalian target of rapamycin (mTOR) signaling, leading to activation of autophagy (Inoki et al. 2003). The mTOR is constituted with mTORC1 and mTORC2 and plays a sensor for nutrient and growth factors. Insulin, glucose, and amino acids activate the Akt/PI3K and MAP4K3 signaling to generate energy for cell survival by mTOR activity.
Moreover, activated mTOR by nutrients and growth factor phosphorylates the ULK1, 2, and Atg family, but inhibition of mTOR induces the dephosphorylation of ULK1, 2 and Atg 13 and activates the autophagy in cancer cells (Jung et al. 2010). Autophagy, a double-edged sword could kill the xenobiotics and infected cells and protect cells from oxidative stress (Shintani and Klionsky 2004). In the process of autophagy, the lysosome is fused with autophagosome which surrounding the harmful damaged and genetically unstable residues, preventing the tumor progression (Mizushima 2007). Loss of Beclin-1, an essential regulator for autophagy enhances the necrosis with inflammation rather than apoptosis, resulting in poor prognosis (Degenhardt et al. 2006). On the other hand, under glucose- deficient conditions, activated autophagy produces energy by recycling the degraded cellular organelles and provides energy for survival of cancer cells (Mathew et al. 2007). Autophagy provides the energy in cancer cells to restoration of nutrients that gradually induces tumorigenesis with
upregulation of the cancer stem cell population (Nazio et al. 2019). And autophagy protects the cancer cells from significant DNA damage and genomic instability and leads to dramatical tumor growth (Karantza- Wadsworth et al. 2007).
Glucose deficiency enhances the apoptosis of cancer cells with reduction of ATP and increased reactive oxygen species (Liu et al. 2003). However, adapted cancer cells to media with low glucose enhance the resistance against anticancer drugs including 5-FU and carboplatin dependent on PI3K pathway compared to those cells cultured in complete media (Bhattacharya et al. 2014). Moreover, glucose deficiency augments the tumor malignancy by enhancement of oxidative stress and oncogenic transcription factors including c-Myc, c-Fos, and c-Jun (Spitz et al. 2000). Increased nuclear factor E2-related factor 2 in cancer cells under glucose-deficient condition binds to the promoter region of matrix metalloproteinase (MMP-9) and enhances the invasiveness and metastasis (Endo et al. 2018). Glycolysis is frequently activated in mitochondria to produce energy in normal cells.
However, adapted cancer cells to glucose-deficient conditions show enhancement of resistance to anticancer drug with mitochondrial dysfunction including morphological elongation, mitochondrial-membrane potential (MMP) hyperpolarization and aberrant ATP production (Hwang et al. 2019). Under glucose-deficient conditions, resistance to temozolomide and carboplatin is enhanced in glioblastoma cells with activation of autophagy, but chemoresistance and quiescence are attenuated by
5
treatment of bafilomycin A1, a selective autophagy inhibitor (Wang et al.
2018). Analogously, glucose deficiency also protects the colorectal cancer cells from oxaliplatin and 5-fluorouracil by elevated ATF4-signaling.
However, knockdown of ATF4 expression alleviates the resistance (Hu et al. 2016). Additionally, metabolic reprogramming by glucose deficiency upregulates the epithelial-mesenchymal transition (EMT) with expressions of N-cadherin and snail, whereas proliferation-related protein (PCNA) is suppressed (Jo et al. 2020).
Figure 1. The schematic diagram for massive glycolysis in tumor microenvironment by aerobic glycolysis (Fan et al. 2019).
7
Figure 2. Glucose is restricted in the distal region from vasculature in tumor microenvironment (Jeong and Deasy 2014).
The role of CAFs in tumor microenvironment
Tumor mass is constituted of cancerous cells and non-cancerous cells.
Non-cancerous cells are important to assist cancer cell growth by cell-cell communication and indirect way. Cancer-associated fibroblasts (CAFs) are the main components of the non-cancerous stromal cells and similar to myofibroblasts which mediate the wound-healing and inflammation (Östman 2009). It is noteworthy that CAFs promote cancer cell malignancy by interaction with the physical structure and soluble factors such as cytokines and metabolites (Santi et al. 2018). CAFs disrupt the basement membrane of surrounding normal tissue by degradation of the extracellular matrix via protease- and force- remodeling (Gaggioli et al. 2007). In parallel, epithelial-mesenchymal transition by CAF promotes the migration of cancer cells toward near-normal tissues for invasiveness and metastasis (Labernadie et al. 2017).
Within the tumor microenvironment, cancer cells produce various cytokines to stimulate themselves and neighboring stromal cells, leading to malignant transformation from inactive-quiescence state of normal fibroblast. Malignant transformation of the fibroblasts induces wound- healing in tumor mass for significant growth and invasiveness (Eyden et al.
2009). Particularly, transforming growth factor-β (TGF-β) that is secreted from colorectal cancer cells transforms normal fibroblasts toward CAFs with activation of STAT3 signaling and interacts with cancer cells for metastasis (Calon et al. 2012). Additionally, secretion of platelet-derived
9
growth factor (PDGF) from cancer cells is conjugated with PDGF-receptor on fibroblasts and differentiates to malignant form. To conjugate with PDGF from cancer cells, fibroblasts are migrated to cancer cells and reinforces the angiogenesis and tumor growth by osteopontin (Anderberg et al. 2009).
Malignant transformation of normal fibroblasts by bladder cancer cells- derived insulin growth factor 1 (IGF-1) activates estrogen receptor β (ERβ)-signaling in the fibroblasts and protects the cancer cells by reduction of sensitivity to cisplatin in in vitro and in vivo model (Long et al. 2019).
Furthermore, CAFs also produce numerous cytokines and stimulate not only themselves but also cancer cells to acquire aggressiveness (Fig. 3). In contrast to control, higher levels of TGF-β and stromal cell-derived factor-1 (SDF-1) are secreted from well-differentiated CAFs and stimulate the C-X-C chemokine receptor 4 (CXCR4)-pathway in cancer cells, leading to significant tumor growth (Kojima et al. 2010). Moreover, CAFs-derived IL-6 activates the CXCR7-mediated STAT3 signaling in cancer cells and enhances the resistance to cisplatin and 5-fluorouracil in a mouse model (Qiao et al. 2018). As a shelter for cancer cells, CAFs protect the cancer cells from anticancer therapy. Docetaxel treatment enhances the WNT16B expression in CAFs and is transferred to neighboring prostate cancer cells.
It activates the canonical-Wnt and NF-kB signaling in cancer cells, leading to the enhancement of chemoresistance (Sun et al. 2012). Additionally, the expression of versican is augmented in ovarian cancer cells by CAFs- derived TGF-β and promotes the invasion and motility of cancer cells
through activation of NF-kB signaling pathway and cancer stemness (Yeung et al. 2013).
Additionally, cancer cell-induced aerobic glycolysis changes the metabolism in CAFs. Enrichment of metabolites from cancer cells are stored in CAFs and they are utilized in nutrient-deficient conditions (Lin et al.
2020). Catabolism in CAFs by aerobic glycolysis substantially produces metabolites and molecules including pyruvate, lactate, and acetyl-CoA.
They transfer to neighboring cells in the tumor microenvironment and lead the metabolic reprogramming which is called as ‘Reverse Warburg effect’
(Pavlides et al. 2009, Fu et al. 2017). Notably, CAFs provide lactate and fatty acids to feed the neighboring cancer cells and enhance mitochondrial biogenesis (Whitaker-Menezes et al. 2011). Lactates and fatty acids secreted from CAFs by upregulation of MCT4 are transferred to cancer cells and used as fuel to activate oxidative phosphorylation and fatty acid metabolism. Thus, MCT4 expression in CAFs is negatively correlated with the survival rate in breast cancer patients (Witkiewicz et al. 2012).
Furthermore, crosstalk of CAFs-induced metabolites and cytokines with immune cells also play a central role in the tumor immune microenvironment.
CAFs-derived cytokines and metabolites also affect the activation of immune cells (Liu et al. 2019). Indeed, CXCL12 from CAFs promotes tumorigenesis and inhibits the infiltration of effector T cells in xenografted tumors. However, depletion of CAFs by diphtheria toxin injection elevates the effector T cell infiltration and suppresses the tumor growth compared
11
to non-injected ones (Feig et al. 2013). CAFs produce the IL-8 and CCL2 and activates the pro-inflammatory response of neutrophils through activation of STAT3-pathway in hepatocellular carcinoma. Dominant pro- inflammation by neutrophils mitigates the activity of effector T cells with downregulation of interferon-γ (IFN-γ) (Cheng et al. 2018). Moreover, IL- 8 and SDF-1 that are secreted from CAFs recruit the tumor-associated macrophages and promote M2 polarization, resulting in poor prognosis (Zhang et al. 2019). However, various metabolites from CAFs indirectly increase the cytotoxic effect of CD8+ T cells with upregulation of IL-21 and suppress the tumor growth in mouse model (Fu et al. 2017, Hermans et al.
2020).
Figure 3. The effect of cytokines and metabolites from CAFs on cancerous and noncancerous cells (Sahai et al. 2020).
13 Lipid metabolism in tumor malignancy
Cancer cell-induced aerobic glycolysis and glucose restriction by irregular vasculature induce the glucose-deficient condition in tumor hostile microenvironment. Cancerous and non-cancerous cells are adapted to glucose-deficient condition and activate the lipid metabolism to compensate energy demand for proliferation and generate the pro-inflammatory cytokines including IL-1 and TNF-α (Van Cutsem and Arends 2005).
Glucose deficiency activates the de novo lipid synthesis to rewire the lipid metabolism for the survival and growth of cancer cells. Among lipid components, the synthesis of cholesterol by long-chain acyl-CoA synthase 3 induces irregular mitochondrial function and is associated with poor prognosis in patients with prostate cancer (Migita et al. 2017). Additionally, hostile tumor microenvironment such as nutrient deficiency and hypoxia enhances the expression of CD36, lipid transporter. Its expression permits the entrance of lipids from extracellular into the cancer cells, and aggravates the tumor growth in patients with melanoma or breast cancer (Mwaikambo et al. 2009, Pascual et al. 2017). The main enzymes in lipid metabolism including fatty acid synthase (FASN), stearoyl-CoA desaturase (SCD), and sterol regulatory element-binding protein (SREBP) are activated in cancer cells by glucose deficiency, but not in complete medium (Munir et al. 2019). Under glucose-deficient conditions, SCD expression is significantly upregulated and induces the biosynthesis of fatty acids to
produce the energy, but not in complete medium (Holder et al. 2013, Peck et al. 2016).
These enzymes not only activate the lipid metabolism but also augment the tumor progression. By glucose deficiency and hypoxia, expressions of ATP-citrate lyase (ACLY), FASN, SCD, SREBP and fatty acid-binding proteins (FABPs) are dramatically increased in cancer cells and induce the lipogenesis and chemoresistance (Lewis et al. 2015). SREBP is a transcription factor regulating synthesis of fatty acid and cholesterol and is highly stained in malignant tumor tissues than normal ones (Furuta et al.
2008). However, loss of SREBP suppresses the size of spheroids and resistance to doxorubicin treatment (Lewis et al. 2015). SCD is an enzyme to convert unsaturated fatty acid to saturated fatty acid and augments the tumor progression (Li et al. 2017). Especially, biosynthesized unsaturated fatty acid by SCD promotes the proliferation, chemoresistance, and stemness of cancer cells through enhancement of Wnt, Hippo signaling (Flowers and Ntambi 2008, Noto et al. 2017). SCD expression activates the canonical Wnt/β-catenin pathway and is correlated with the stage of lung cancer patients (Noto et al. 2017). In bladder cancer, SCD expression is higher in CSC with stemness markers including Nanog, CD133, Oct4, and ALDH1 than parental one. Its expression enhances the resistance to pirarubicin and proliferation, but it is reversed by inhibition of the expression (Piao et al. 2019). However, inhibition of SCD suppresses the tumor growth and improves the sensitivity to anticancer therapies (Roongta
15
et al. 2011, Von Roemeling et al. 2013). Additionally, FASN, an oncogenic factor enhances the phosphorylation of Akt-signaling and cell cycles, leading to invasiveness in breast cancer (Menendez et al. 2004).
Lipid metabolism also promotes cancer stemness by activation of oncogenic factors (Yi et al. 2018). The number of cancer stem cells (CSC) is very small, but the cells are self-renewal, tumor initiation and resistance to anticancer therapies by advanced ATP-binding cassette (ABC) transporters (Begicevic and Falasca 2017). In contrast to non- stem cancer cells, higher expression of Nanog which the main regulator for cancer stem cell (CSC) initiates tumorigenesis by metabolic reprogramming from oxidative phosphorylation (OXPHOS) to fatty acid metabolism.
Mechanistically, Nanog is conjugated with the promoter of PPAR and ACADVL and activates the lipid metabolism rather than OXPHOS in the mice model (Chen et al. 2016). Activation of lipid metabolism is beneficial in CSC by enhancement of fluidity and self-renewal growth compared to glycolysis (Corominas-Faja et al. 2014). However, inhibition of fatty acid oxidation suppresses the tumorigenesis in CSC (Wang et al. 2018). Compared to non- CSC, higher lipid amounts in CSC directly augment the Wnt pathway and population of CD133 positive cells and suppress the harmful lipid peroxidation (Bailey et al. 2015, Tirinato et al. 2015). Lipid desaturation is also essential in CSC to enhance the cell membrane and fluidity by NF-kB signaling and ALDH1, leading to division, metastasis, and signal transduction (Taraboletti et al. 1989, Li et al. 2017). Additionally, fatty acid oxidation is
strongly activated in CSC and enhances the pluripotency maintenance and PPAR activity by mitophagy, whereas the production of ROS is suppressed (Yi et al. 2018). However, inhibition of lipid metabolism in CSC by treatment of inhibitor for FASN, SCD, CD36 is promising anticancer therapy through suppression of CSC proliferation.
Furthermore, reprogrammed lipid metabolism critically affects the phenotype of immune cells in the tumor microenvironment. Activated lipid metabolism in M2 macrophages increases the secretion of IL-1β and encourages the enhancement of invasion and migration of cancer cells, but it is reversed by treatment of inhibitor for fatty acid oxidation (Zhang et al.
2018). Compared to normal macrophages, amounts of lipid are higher in tumor-associated macrophages (TAMs) by significant lipids transition through CD36, leading to activation of fatty acid oxidation. Treatment of Etomoxir, an inhibitor for fatty acid oxidation suppresses the phenotype of M2 TAM and tumor growth in the mice model (Su et al. 2020). Additionally, upregulation of AMPK by activation of lipid metabolism enhances the proliferation of Treg cells and Foxp3 expression (Michalek et al. 2011).
Lipid metabolism enhances the population of IFN-γ+ CD4+T cells by c-Maf expression (Perucha et al. 2019). Differentiation from naïve T cells to IFN- γ+CD4+ T cells is augmented according to activation of lipid metabolism (Haghikia et al. 2015). In B-cell lymphoma, activation of lipid metabolism partially enhances the function of natural killer (NK) cells such as IFN-γ production and mitochondrial membrane potential (Kobayashi et al. 2020).
17
Escape of immunosurveillance in tumor immune microenvironment
Within the tumor microenvironment, cancer cells escape the immunosurveillance by binding with inhibitory receptors in CD8+ T cells such as programmed death-1 (PD-1) (Facciabene et al. 2012). Especially, regulatory T (Treg) cells inhibit the activity of antigen-presenting cells (APCs) and effector T cells including Th1 and CD8+ T cells by cytotoxic T lymphocyte-associated antigen 4 (CTLA-4) and TGF-β (Li et al. 2020).
Abundant IL-35, TGF-β in tumor microenvironment enhances the differentiation of Treg cells from naïve CD4+ T cells, rather than other conventional ones (Turnis et al. 2016, Togashi et al. 2019). In general, CD4+CD25+ Treg cell prevents the autoimmune disease by attenuation of excessive immune self-tolerance (Sakaguchi et al. 2010). However, in tumor microenvironment, Treg cells assist the escape of cancer cells from immunosurveillance, resulting in enhancement of chemoresistance and tumor growth. On the surface of Treg cells, developed CD25, an IL-2 receptor is high affinity with IL-2 and impedes the availability of IL-2- mediated stimulation in conventional CD4+ T cells, CD8+ T cells and antigen-presenting cells (APCs) (Takahashi et al. 1998). Moreover, compared to control, deletion of TGF-β in Treg cells substantially augments the expression of IFN-γ, T-bet, GATA3, and IL-17 that are an indicator for effector T cells including Th1, Th2, and Th17 cells (Konkel et al. 2017). Additionally, cytotoxic T lymphocyte antigen 4 (CTLA-4) is highly expressed on the surface of Treg cells and mitigates the priming and
activation of effector T cells and APC function by conjugated with CD86 and CD80 (Perez et al. 1997). However, CTLA4-KO mice exhibit that populations of IFN-γ, IL-4 and IL-17 positive cells are higher than wild- type mice. Moreover, tumor growth is halted in CTLA4-KO mice within 3 weeks, but wild-type mice show significant growth (Wing et al. 2008).
In tumor mass, Th1 cells are positive to IFN-γ and produce cytokines including IL-2, IL-10, IFN-γ, and TNF-α for stimulation of CD8+ T cells and M1 polarization (Cavalcanti et al. 2012). The secretion of IFN-γ from Th1 cells promotes C-X-C motif chemokine 9 (CXCL9), -10, and -11 in macrophage, leading to recruitment of CD8+ T cells for cancer eradication.
Additionally, the macrophages release the IL-6 and IL-1β that activate the function of Th1 cells (Haabeth et al. 2011). Th1 cells augment the anticancer immunity, thus, stimulation of the cells could improve the cancer-killing effect of CD8+ T cells and NK cells. Notably, treatment of lenalidomide enhances the population of Th1 cells with upregulation of IFN-γ and T-bet expression that recruits the CD8+ T cells in leukemia patients compared to non-treated ones (Aue et al. 2018).
In contrast to Th1 cells, pro-inflammation by Th2 cells increases the tumor growth. Thymic stromal lymphopoietin that is secreted from CAFs and DCs induces the differentiation from naïve T cells to Th2 cells. Subsequently, GATA-3+ Th2 cells secret the IL-5 and IL-13 that activate the M2 polarization of TAM, resulting in tumor growth (Protti and De Monte 2012).
Indeed, a poor prognosis is observed in patients with pancreatic cancer
19
according to a decrease of GATA-3/T-bet expression (De Monte et al.
2011). Moreover, enrichment of Th17 cells in tumor mass by immature myeloid cell-induced CCL17, CCL20, CCL22, and RANTES upregulates the tumor growth (Chen et al. 2012). Similar to Treg cells, TGF-β is also necessary to differentiate Th17 cells, but IL-6 and IL-21 are additionally required, unlike Treg cells. Naïve T cells are differentiated to RAR-related orphan receptor-γ+ (Rorγ) Th17 cells by IL-17, IL-21, and IL-23, and that increases the pro-inflammatory response (Najafi and Mirshafiey 2019).
Bacteroides fragilis (ETBF) initiates the colon carcinogenesis in mouse model with upregulation of Th17 cells (Wu et al. 2009). In patients with hepatocellular carcinoma, the population of tumor-infiltrating Th17 cells is positively correlated with poor survival rate. CCR4 and CCR6 are highly expressed from Th17 cells and mediate the migration of those cells toward cancer cells for tumor progression (Zhang et al. 2009). However, published studies suggest that the high plasticity of Th17 cells could transdifferentiate to Th1 cells and assist in good prognosis in ovarian, prostate, lung cancer patients, but it is controversial (Wilke et al. 2011). In general, CD8+ T cells is killing the xenobiotic and mutated one by specific recognition of peptide (Jiang et al. 2015). However, cancer cells selectively express the inhibitory receptors including programmed death 1 (PD-1), TIM-3, and LAG3 that are binding with CD8+ T cells, leading to exhaustion and self-tolerance (Anderson et al. 2016). Thus, their targeted therapies such as neutralization antibodies and vaccination enhance the survival rate in cancer patients
(Maimela et al. 2019). Although anti-inhibitory receptors are good therapeutics, optimization of the appropriate dose and injection time in all age warrants further study. Additionally, the efficiency of anti-inhibitory receptor-aimed therapy is compelling in lymphoma and myeloid leukemia, but it is limited in solid tumors (Park 2017).
In addition, the polarization of M0 macrophages to M1 or M2 is determined according to the tumor microenvironment. The characterization of M1 and M2 is different. They are differentiated from M0 to M1 and M2 by treatment of granulocyte-macrophage colony-stimulating factor and macrophage colony-stimulating factor, respectively (Jaguin et al. 2013). M1 polarization inhibits the pro-inflammatory response and tumor growth with the secretion of cytokines including IL-12, TNF-α, CXCL-10, and IFN-γ, whereas M2 polarization produces the cytokines such as IL-10, IL-13, and IL-4 for immunosuppression, resulting in tumor progression (Lin et al. 2019). In contrast to M1 polarization, secretion of CCL2 is higher in M2 polarization and conjugates with CCR2 itself for production of IGF1, FOLR2, HTR2B, and SLC40A1, but a loss of CCR2 enhances the M1-related cytokines (Sierra- Filardi et al. 2014). Crosstalk between M2 macrophages and cancer cells augments the tumor invasion, survival, and extracellular matrix degradation by increased vascular endothelial growth factor (VEGF), matrix metalloproteinases (MMP), and epithelial-mesenchymal transition (EMT) (Lin et al. 2019). Cytokines from M2 polarization increase the expressions of snail and NF-kB signaling in breast cancer cells, leading to tumor growth
21
and metastasis (Wu et al. 2009). Thus, the agents to suppress the M2 polarization could be a good approach for anticancer therapy. For example, zoledronic acid (ZA) treatment induces the repolarization from M2 to M1 with downregulation of VEGF, CD31, and CD11b in TAM (Coscia et al. 2010).
In 1803 breast and colorectal cancer patients, administration of ZA enhances the therapeutics of anastrozole and tamoxifen that substantially increases the survival rate and disease-free survival (Gnant et al. 2011).
Summary
Within a hostile tumor microenvironment, glucose deficiency induces the lipid metabolic reprogramming and promotion of tumor malignancy. Under the glucose-deficient conditions, cancer cells augment the stemness and resistance to anticancer therapies. Moreover, compared to counterparts, the activity of lipid metabolism is higher in CAFs and TILs. However, the effect of glucose deficiency on metabolic reprogramming in cancer cells, CAFs, and TILs have not been delineated. We investigated that how glucose deficiency-induced metabolic alteration affects the phenotypes of cancer cells, CAFs, and TILs. Particularly, we focused on lipid metabolic reprogramming which was activated by glucose-deficient condition.
23
CHAPTER I.
Glucose deficiency enhanced the drug resistance
by upregulation of mitochondrial MDR1
Abstract
Chapter I elucidated the enhancement of resistance for metformin in cancer cells under glucose-deficient conditions with underlying mechanisms.
Within a hostile tumor microenvironment, cancer cells are hijacking the glucose amounts, resulting in glucose-deficient conditions. It augments the malignancy such as stemness, drug resistance and epithelial-mesenchymal transition (EMT). However, the effect of glucose deficiency in human malignant mesothelioma (HMM) cells had not been investigated. Moreover, Metformin is a type 2 diabetes drug and is treated in patients with numerous types of cancer, but it is not affected on HMM patients.
In this chapter, we demonstrated that glucose starvation-induced drug resistance in cancer cells with upregulation of multi-drug resistance protein 1 (MDR1). Compared to normal cells, cancer cells were survived and adapted in glucose-deficient conditions. In both cancer cells, glucose- deficient condition induces the resistance to metformin with upregulation of mitochondrial multidrug resistance protein 1 (MDR1) in cancer cells. These cells showed aberrant mitochondrial function including ATP synthesis, morphological elongation, and hyperpolarization of mitochondrial membrane potential (MMP). Increased MDR1 was abolished by treatment with carbonyl cyanide m-chlorophenyl hydrazine (CCCP) which is MMP depolarization inducer. Under glucose-deficient conditions, apoptosis and autophagy were significantly enhanced in MDR1 knockout (KO) cells by treatment with metformin. Collectively, our study demonstrated MDR1-targeting could improve the therapeutic efficacy of metformin.
25 Introduction.
The tumor microenvironment, which includes glucose starvation, hypoxia, and acidic conditions, is a distinctive feature of tumor masses and is generated by the abnormal tumor vasculature causing malignancy (Tredan et al. 2007, Wang and Youle 2009, Yeom et al. 2012, Hu et al. 2016). Adapted cancer cells to the tumor microenvironment show metabolism alteration that leads to their survival and enhances chemoresistance, which is the main obstacle to cancer therapy (Liu et al. 2003, Sun et al. 2012, Lee 2014, Nishimoto et al. 2014, Visioli et al. 2014, De Palma et al. 2017). Several mechanisms have been suggested for chemoresistance, such as protection against DNA damage, anti-apoptosis, the overexpression of drug transporters, and the existence of cancer stem cells (van Dijk et al. 2012, Lee 2014). Particularly, multidrug resistance protein 1 (MDR1), an ATP- binding cassette (ABC) transporter, effluxes xenobiotics from cells and is highly expressed in cancer cells that are resistant to chemotherapy (Abolhoda et al. 1999, Vasiliou et al. 2009). The regulation of MDR1 expression level is an important strategy for decreasing the cancer cells’
resistance to anticancer drugs. The effects and mechanism of glucose starvation in the context of chemoresistance of cancer cells are largely unknown.
Glucose is metabolized mainly in mitochondria, which is essential for generating energy for cell proliferation. Glucose starvation disturbs mitochondria function and changes the cellular phenotype (Liu et al. 2003,
Mammucari and Rizzuto 2010, Masgras et al. 2012, Wappler et al. 2013).
Under glucose deficient conditions, autophagy provides energy to sustain cellular metabolism and is considered a hindrance to cancer therapy that disturbs cellular physiology (Degenhardt et al. 2006, Yang et al. 2011). In contrast that excessive autophagy contributes to cell death, which is considered to be a target for effective cancer therapy (Kroemer and Levine 2008).
Human malignant mesothelioma (HMM) is an aggressive tumor that is closely associated with exposure to asbestos fibers approximately 20-40 years prior to tumorigenesis. HMM patients present poor therapeutic due to traditional anticancer drug resistance such as cisplatin and pemetrexed (Robinson et al. 2005). Metformin, which is commonly used for the management of type II diabetes mellitus, has been suggested as an alternative anticancer drug(Eikawa et al. 2015, Shimazu et al. 2017). Recent studies have shown a potential therapeutic value of metformin in HMM cells, which is exerted through the inhibition of mTOR and cell cycle arrest (Shimazu et al. 2017). However, metformin treatment causes resistance in human breast cancer cells, although the precise mechanism was not elucidated (Qu et al. 2014). Expanding our understanding of the mechanism of drug resistance is urgently needed to improve poor prognosis in cancer patients and to develop effective therapeutic strategies.
The present study was performed to determine the impact of glucose deficiency on the development of resistance to metformin and the
27
underlying mechanism in HMM cells. The results of the present study suggest that glucose starvation enhances drug resistance in HMM cells via mitochondrial MDR1 elevation. The identification of the mechanism associated with enhanced resistance to metformin will be valuable for improving therapeutic efficacy in cancer patients.
Materials and Methods
Cell lines and culture conditions
The HMM cell lines MS1 and NIH‐513 (H513) were kindly provided by Dr.
Jablons (University of California San Francisco, San Francisco, CA, USA) and Dr. R. Kratzke (University of Minnesota, Minnesota, MN, USA), respectively. Met‐5A benign transformed mesothelial cells were purchased from the ATCC (Manassas, VA, USA). These mesothelial cell lines were cultured as described previously (Kim et al. 2018), and various concentrations of glucose (0, 1, 5, and 10 mmol/L) were added to the medium.
Cell proliferation and viability assay
Cell viability was evaluated by using an MTT assay (Sigma‐Aldrich, St.
Louis, MO, USA). Briefly, MTT solution (MTT dissolved in PBS, 5 mg/mL) was added to each well and incubated for 1 hour at 37°C. Subsequently, each well was treated with 100 mL of a solution that contained DMSO (Sigma‐Aldrich) and 2‐propanol (Millipore, Billerica, MA, USA) at a 9:1 ratio and absorbance was measured at a wavelength of 570 nm using a microplate reader (BioTek Epoch, Izasa, Barcelona, Spain). For the cell proliferation assay, 5 × 10⁴ cells were seeded in 6‐well plates and incubated in conditioned medium with glucose concentrations ranging from 0 to 10 mmol/L for 3 days. The surviving cells on each day were counted manually
29 under a light microscope.
Apoptosis assay
The apoptosis assay was performed using an EzWay Annexin V‐FITC Apoptosis Detection Kit (Koma Biotech, Seoul, Korea). Annexin V reagent was added to harvested cells and incubated for 15 minutes in the dark. After washing, the cells were incubated in 1× binding buffer containing propidium iodide (PI). The stained cells were immediately analyzed by flow cytometry (Becton Dickinson, Mountain View, CA, USA). Total apoptosis included late (positive for Annexin and PI) and early (positive for Annexin and negative for PI) apoptotic cells.
Western blotting assay
The cells were lysed using EzRIPA buffer (ATTO, Tokyo, Japan). The lysate protein concentration was quantified by a Bradford assay (BioRad, Hercules, CA, USA) and measured using a BioTek Epoch Microplate Reader.
Twenty micrograms of protein were subjected to 10%‐15% sodium dodecyl sulfate-polyacrylamide gel electrophoresis and transferred to a nitrocellulose membrane (Amersham, GE Healthcare, Barcelona, Spain) using the electrophoretic method. The membrane was blocked by a PBS‐T solution which contained 5% skim milk for 60 minutes at room temperature.
The primary antibodies, PINK1 (Novus Biologicals, Littleton, CO USA), phosphorylated AMPK (Cell-Signaling Technology, Boston, MA, USA), MDR1 (Santa Cruz Biotechnology, CA, USA), and β‐actin (Cell-Signaling Technology) were diluted 1:1000 in blocking solution (PBS‐T with 4% BSA)
and incubated overnight at 4°C. The secondary HRP‐conjugated anti–rabbit (Santa Cruz Biotechnology) and anti–mouse (Santa Cruz Biotechnology) antibodies were used at a dilution of 1:1000 in blocking solution for 2 hours.
Protein expression was detected by a chemiluminescence imaging system (ATTO) after spreading the Luminata Forte Western HRP Substrate (Millipore).
Subcellular fractionation assay
Subcellular fractionation of the cytoplasm, mitochondria and nucleus was achieved using a fractionation kit (Abcam, Burlingame, CA, USA) according to the manufacturer's recommendations. Alpha‐tubulin (Santa Cruz Biotechnology), COX IV (Abcam) and Lamin A/C (Santa Cruz Biotechnology) were used as endogenous control markers for the cytoplasm, mitochondria and nucleus, respectively.
Quantitative real‐time PCR
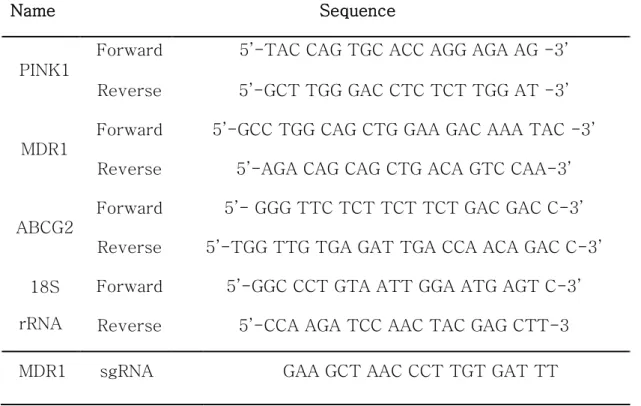
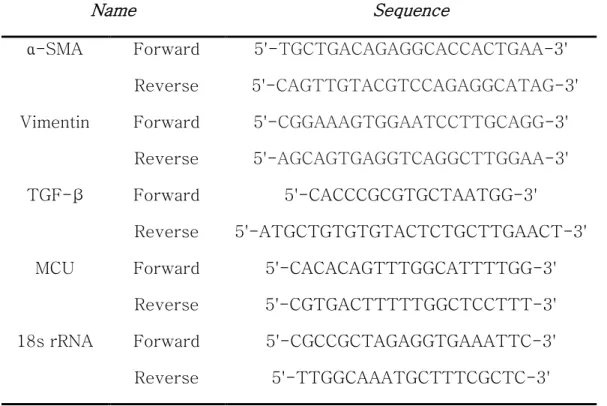
Total RNA was extracted using TRIzol LS Reagent (Ambion, Austin, TX, USA) and quantitation was performed using a BioTek Epoch Microplate Spectrophotometer (Izasa, Barcelona, Spain). A total of 1000 ng of RNA was subjected to cDNA synthesis using a QuantiTect Reverse Transcription Kit (Enzynomics, Seoul, South Korea). An SYBR Green RT‐PCR Kit (Enzynomics) was used for gene expression analysis. The primer sequences are presented in Table 1. The relative changes in gene expression levels were normalized to 18S rRNA and calculated using the ΔΔC t method (Rao et al.
31 2013).
Autophagy detection
The autophagy activity was assessed using a Cyto‐ID Autophagy detection kit (Enzo Life Sciences, Farmingdale, NY, USA). Briefly, the Cyto‐ID Autophagy Detection Reagent was added to the cell pellet, and incubated for 30 minutes at 37°C protected from light and analyzed using flow cytometry (Becton Dickinson).
Immunofluorescence assay
Human malignant mesothelioma cells were seeded in 8‐well chamber slides (SPL Life Sciences, Pocheon, Korea) and incubated with MitoTracker Deep Red (Molecular Probes, Eugene, OR, USA) for 30 minutes in the dark.
Fixation, permeabilization and blocking were carried out using 4%
paraformaldehyde (Millipore), 0.1% Triton X‐100 (Amresco, Solon, OH, USA) and blocking solution (BSA 3% in PBS with 0.1% Tween‐20 [PBST]) for 15, 10 and 30 minutes, respectively. After washing with PBS, Mdr1 antibody was added in blocking solution and incubated overnight at 4°C. Subsequently, the Alexa Fluor 488‐conjugated anti–mouse secondary antibody (Molecular Probes) was added in blocking solution and incubated for 2 hours in the dark.
In addition, nuclear was stained using DAPI (Molecular Probes).
Fluorescence images were captured using an LSM710 confocal laser scanning microscope (CLSM; Carl Zeiss, Göttingen, Germany) and analyzed
using LAS AF Lite software (Leica, Wetzlar, Germany).
Transmission electron microscopy
Cell pellets were immersed in Karnovsky's solution (2% glutaraldehyde, 0.05 mol/L cacodylate, 2% paraformaldehyde and distilled water) and incubated overnight (Morris 1965). After washing with 0.05 mol/L sodium cacodylate buffer, the cells were subjected to post–fixation using 2%
osmium tetroxide for 2 hours, followed by washing in distilled water. For fixation, 0.5% uranyl acetate was added, and the cells were then washed with ethanol. Propylene oxide was added to the pellet for transition. For infiltration, the cells were incubated in propylene oxide and Spurr's resin mixed at a 1:1 ratio for 2 hours at room temperature. For solidification, the solution was replaced with fresh Spurr's resin and incubated at 70°C overnight. After thin sectioning using an ultramicrotome (MT‐X; RMC, Tucson, AZ, USA), the intracellular organelles morphology was examined using a JEM 1010 transmission electron microscope (JEOL, Tokyo, Japan).
Assessment of mitochondrial function
The cellular level of ATP was measured using the ATP Colorimetric/Fluorometric Assay Kit (BioVision, Milpitas, CA, USA), according to the manufacturer's recommendations. Briefly, a mixture of ATP assay buffer, probe, converter and developer was added to the cell lysate obtained from 1 × 10⁶ cells. In addition, the resulting absorbance was measured at a wavelength of 570 nm using a microplate reader (BioTek
33
Epoch) and calculated using a standard curve.
Mitochondrial membrane potential was evaluated using 5,5′,6,6′‐
tetrachloro‐1,1′, 3,3′‐tetraethylbenzimidazolylcarbocyanine iodide; JC‐1, Molecular Probes). HMM cells were treated with 2.5 μmol/L JC‐1 solution and incubated at 37°C for 30 minutes in the dark. Subsequently, MMP was analyzed by flow cytometry (Becton Dickinson), and compartmentalized as green and red in a dot plot. As depolarization control, 50 μmol/L carbonyl cyanide m‐chlorophenyl hydrazone (CCCP) was added to the cells prior to JC‐1 treatment. Using the depolarization baseline with red/green ratio decreased by CCCP treatment, the MMP data were normalized.
Production of knockout cells using the clustered regulated interspaced short palindromic repeats/Cas9 technique
Human malignant mesothelioma cells were transfected with 2 μg of MDR1 CRISPR/Cas9 KO plasmids containing a GFP‐coding region and either control or MDR1 (Table 1; Santa Cruz Biotechnology) using the HiPerFect Transfection Reagent (Qiagen, Hilden, Germany) following the manufacturer's recommendations. GFP‐positive cells were selectively collected by using a BD Aria III cell sorter (BD Biosciences Clontech, Palo Alto, CA, USA) 3 days post–transfection. The knockout efficiency for the target gene was verified by real‐time RT‐PCR for MDR1.
Statistical analysis
The experiments described above were performed independently at least 3 times. Data were expressed as the mean ± SD. GraphPad Prism Software
(GraphPad Software) was used for all graphs and statistical analysis.
Tukey's pairwise comparison and one‐way ANOVA were applied for comparisons between groups. Statistical significance was accepted at P <
0.05.
35
Table 1. Primer sequence, PINK1, MDR1, ABCG2 and GAPDH for quantitative of Real time RT-PCR. CRISPR/Cas9 MDR1 sgRNA sequence
Name Sequence
PINK1
Forward 5’-TAC CAG TGC ACC AGG AGA AG -3’
Reverse 5’-GCT TGG GAC CTC TCT TGG AT -3’
MDR1
Forward 5’-GCC TGG CAG CTG GAA GAC AAA TAC -3’
Reverse 5’-AGA CAG CAG CTG ACA GTC CAA-3’
ABCG2
Forward 5’- GGG TTC TCT TCT TCT GAC GAC C-3’
Reverse 5’-TGG TTG TGA GAT TGA CCA ACA GAC C-3’
18S rRNA
Forward 5’-GGC CCT GTA ATT GGA ATG AGT C-3’
Reverse 5’-CCA AGA TCC AAC TAC GAG CTT-3 MDR1 sgRNA GAA GCT AAC CCT TGT GAT TT
Results
Survived human malignant mesothelioma cells under glucose‐starved conditions desensitized against to metformin treatment
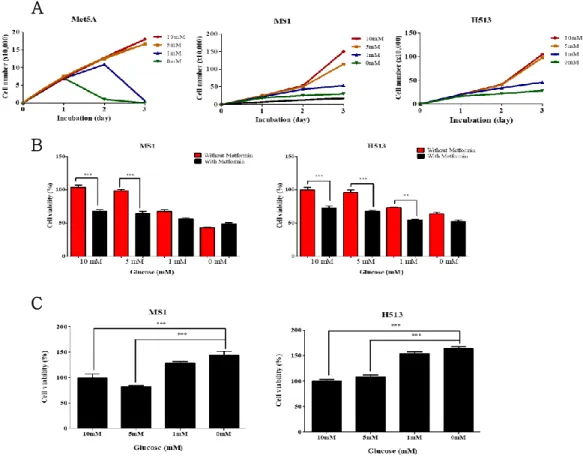
To assess the impact of glucose concentration on cell proliferation, the MS1, H513 and Met‐5A cell lines were cultured in conditioned medium containing 0, 1, 5 and 10 mmol/L glucose. The proliferation of human malignant mesothelioma (HMM) cells was decreased in medium with 0 and 1 mmol/L glucose (Fig. 1 A), while the number of cells increased in medium with 5 and 10 mmol/L glucose. Met‐5A cells cultured under glucose‐deficient conditions did not survive after 3 days. In contrast, the HMM cell lines, MS1 and H513, survived under glucose‐deficient conditions. These results demonstrated that glucose is essential for cell proliferation and that HMM cells have a distinct capacity for survival under glucose starved conditions compared to benign mesothelial cells. Human malignant mesothelioma cells were precultured in medium with 0, 1, 5 and 10 mmol/L glucose for 2 days, followed by treatment with 5 mmol/L metformin for 1 day. The viability of HMM cells cultured with 5 and 10 mmol/L glucose was significantly decreased by metformin treatment, but this feature was minimally affected in HMM cells precultured under glucose‐deficient conditions (Fig. 1 B, C).
To determine glucose starvation‐enhanced metformin resistance, HMM cells were precultured in medium containing different concentrations of glucose for 2 days, replated with identical numbers of cells and treated with metformin for 1 day. HMM cells precultured in medium with 5 or 10 mmol/L
37
glucose exhibited a significant reduction of cell viability compared to 0 or 1 mmol/L glucose (Fig. 1 D, E). These data revealed that adapted HMM cells to glucose‐deficient conditions acquired greater resistance to metformin than did cells cultured under glucose abundant conditions.
Figure 1. Assessment of glucose concentration effect in cell proliferation and metformin resistance
(A) Proliferation of human malignant mesothelioma cells under each glucose concentration contained medium was measured for 3 d by macroscopic analysis. (B, C) MS1 and H513 cells were cultured in medium containing the various concentrations of glucose for 2 d and subsequently treated with 5 mmol/L of metformin for 1 d. Red column: metformin nontreatment. Black column: 5 mmol/L metformin treatment. (D, E) MS1 and H513 cells incubated in the various concentrations of glucose for 2 d were replated same number and treated 5 mmol/L metformin for 1 d. All error bars indicate the SEM with n = 8. Significant differences are indicated by
**P < 0.01, and ***P < 0.001.
A .
B .
C .
39
Treatment of human malignant mesothelioma cells cultured under glucose starvation with metformin suppressed apoptosis and autophagy
Total apoptosis was suppressed by metformin treatment in HMM cells cultured under glucose‐deficient conditions. In contrast, glucose starvation or metformin treatment increased the total apoptosis ratio (Fig. 2 A).
Furthermore, either metformin treatment or glucose starvation increased the expression of cleaved Parp‐1 (Fig. 2 B). However, the treatment of glucose‐starved HMM cells with metformin significantly reduced the expression of cleaved Parp‐1 compared to those cells cultured in complete medium. In line with that, autophagic activity was increased by glucose starvation or metformin treatment (Fig. 2 C). In contrast, the treatment of glucose‐starved HMM cells with metformin significantly suppressed autophagic activity compared to those cells cultured in complete medium.
The expression of LC3B, p‐AMPK and AMPK was increased by either glucose starvation or metformin treatment in HMM cells (Fig. 2 D). However, that was decreased in the treatment of glucose‐starved HMM cells with metformin. In addition, mTOR expression was decreased by either glucose starvation or metformin treatment in MS1.
A
B
C
D
41
Figure 2. Glucose starvation and/or metformin treatment regulated apoptosis and autophagy
(A) Total apoptosis in human malignant mesothelioma cells cultured under each glucose concentration containing medium and/or 5 mmol/L metformin treatment are presented. All error bars represent SEM with n = 3.
Significant differences are indicated by *P < 0.05, **P < 0.01, and ***P < 0.001.
(B) Western blot analyses of the expression of cleaved Parp‐1 and β-actin.
(C) Autophagy activity was assessed by flow cytometry. Blue: 10 mmol/L glucose. Orange: each glucose concentration and/or 5 mmol/L metformin treatment. (D) Autophagy indicated molecules, LC3B, AMPK, p‐AMPK, mTOR and β‐actin; expression was confirmed by western blot assay
MDR1 is significantly elevated in mitochondria of glucose‐starved HMM cells by treatment with metformin
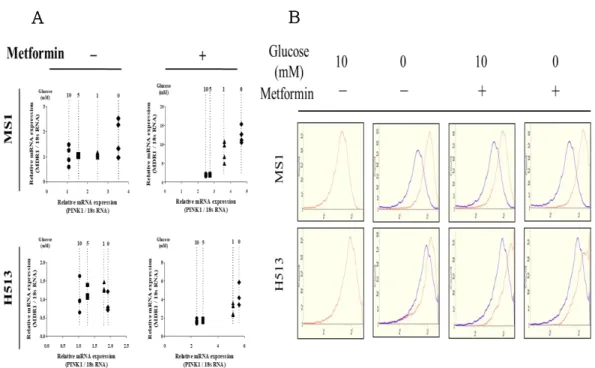
The treatment of glucose‐starved HMM cells with metformin increased the mRNA expression of MDR1 and ABCG2 (Fig. 3 A, B). In particular, MDR1 mRNA expression in glucose‐starved cells with metformin treatment was approximately 10‐fold higher than those cells cultured in complete medium.
To determine Mdr1 expression in subcellular fractions, the cytoplasm, nucleus and mitochondria were isolated. The expression level of membrane Mdr1 was not significantly altered by glucose content or metformin treatment (Fig. 4 A). In MS1 cells, the majority of Mdr1 expression was found in the mitochondria and minimal expression was found in the nuclear and cytoplasmic fractions. In addition, mitochondrial Mdr1 expression was significantly increased in the treatment of glucose‐starved conditions with metformin (Fig. 3 C, D). These results suggested that the treatment of glucose‐starved HMM cells with metformin elevated Mdr1 expression exclusively in fractionated mitochondria. In H513 cells, however, Mdr1 was found in all subcellular fractions, although substantial enrichment in the mitochondrial and nuclear fractions was observed under glucose‐starved conditions. Previous research reported that MDR1 is increased in hepatocellular carcinoma cells with mitochondrial defects (Ling et al. 2010).
Moreover, dependent on glucose content decreasing and metformin treatment, the mRNA expression of MDR1 and PINK1 showed positive correlation (Fig. 4 B). The Mdr1 fluorescence in glucose‐starved MS1 cells
43
with metformin treatment was significantly increased and exhibited co‐
localization with MitoTracker (Fig. 3 E). However, the Mdr1 expression in HMM cells cultured in complete medium was unchanged by metformin treatment. In addition, mitotracker expression increasing which was a mitochondria damage indicator was detected in HMM cells cultured under glucose starvation and metformin treatment compared to those HMM cells cultured in complete medium (Fig. 4 C).
A .
B .
C .
D .
E .
45
Figure 3. Regulation of drug‐related molecule expression by glucose concentration and/or metformin treatment
(A, B) The mRNA expression of multidrug resistance protein 1 (MDR1) and ATP‐binding cassette sub‐family G member 2 expression was measured in MS1 and H513 cells. Significance: *P < 0.05, **P < 0.01, and ***P < 0.001.
Each data represents the mean ± SEM (n = 4). (C, D) Western blot analysis of Mdr1 expression from mitochondria, cytoplasmic and nuclear fractions.
The α‐tubulin, COXIV and Lamin A/C were used for normalization of cytoplasmic, mitochondria and nuclear fractions. (E) Immunofluorescence of MDR1 and mitotracker in MS1 was exhibited by confocal laser scanning microscope. The Mdr1 and mitotracker expressed green and red fluorescence.
Figure 4. Identification of the relationship between mitochondrial damage and MDR1 expression
(A) The fold changes in mRNA expression of MDR1 and PINK1 in HMM cells cultured under each glucose concentration and/or metformin treatment was presented. The X-axis indicates PINK1 expression normalized to 18S rRNA, and the Y-axis shows MDR1 expression normalized to 18S rRNA. (B) The MitoTracker intensity was measured in HMM cells by glucose concentration and/or 5 mM metformin treatment. Blue: 10 mM glucose- containing medium, Orange: each glucose concentration and/or metformin treatment.
A .
B .
47
Dysfunctional mitochondria induced by glucose starvation and/or metformin treatment
To further examine the mitochondria integrity, the expression of Pink1, a mitochondrial damage marker, was measured. The expression of Pink1 was increased by glucose starvation and/or metformin treatment (Fig. 5 A).
Moreover, ATP synthesis was assessed in HMM cells cultured under glucose starvation and/or metformin treatment. The ATP level was decreased by either glucose starvation or metformin treatment in HMM cells (Fig. 5 B). The ATP level in the treatment of glucose‐starved HMM cells with metformin was lower than 4‐fold compared to those HMM cells cultured in complete medium. To evaluate the mitochondrial ultrastructure, TEM was performed. Intriguingly, elongated mitochondria with condensed cristae were observed in glucose‐starved HMM cells with metformin treatment (Fig 5 C). In the mPTP assay, the FITC intensity was significantly increased in HMM cells cultured under glucose‐starved conditions or metformin treatment, but not in glucose‐starved HMM cells with metformin treatment (Fig. 5 D). Metformin treatment induced the depolarization of the MMP, but glucose starvation alone did not affect the MMP. In contrast, the treatment of glucose‐starved HMM cells with metformin induced MMP hyperpolarization, especially in MS1 cells (Fig. 5 E, F). Mitochondrial membrane potential regulated protein import in mitochondria (Jin et al.
2010). Therefore, to determine the MMP hyperpolarization in the treatment of glucose‐starved HMM cells with metformin‐regulated mitochondrial Mdr1
expression, 5 μmol/L CCCP was treated for 3 days. CCCP treatment suppressed the increased MMP and Mdr1 expression in mitochondria of HMM cells cultured under glucose starvation with metformin (Fig. 5 G).
49 C
.
E .
F .
G .
B .
D . A
.
Figure 5. Mitochondrial dysfunction and morphological alteration in glucose‐starved HMM cells in cases treated or not treated with metformin (A) The expression of Pink1 and β‐actin expression was assessed by western blot assay. (B) Adenosine triphosphate (ATP) generation was measured in MS1 and H513 cells. (C) Cellular morphological alteration was detected by transmission electron microscopy assay which is usually performed to classify the intracellular organelle morphology. L, lysosome;
M, mitochondria; N, nuclear; P, phagophore. (D) The mitochondrial permeability transition pore assay was performed in HMM cells cultured under glucose‐starved condition and/or 5 mmol/L metformin treatment by flow cytometry. Red: 10 mmol/L glucose. Green: each glucose concentration contained medium and/or 5 mmol/L metformin treatment. (E) Analysis of the mitochondrial membrane potential (MMP) by flow cytometry in HMM cells cultured under glucose starvation and/or 5 mmol/L metformin treatment.
Data were normalized with the red/green ratio result of MMP depolarization induced by 50‐μm carbonyl cyanide m‐chlorophenyl hydrazine (CCCP) treatment used as positive control. The green part increasing compared to the red portion indicates hyperpolarization. (F) The ratio of red to green is presented. The red and black columns show incubation with or without 5 mmol/L CCCP for 3 d. All error bars represent SEM with (n = 3). (G) The expression of Mdr1 in mitochondria with or without 5 mmol/L CCCP was measured by a western blotting assay in HMM cells cultured with glucose starvation and/or 5 mmol/L metformin treatment.