저작자표시-비영리-변경금지 2.0 대한민국 이용자는 아래의 조건을 따르는 경우에 한하여 자유롭게
l 이 저작물을 복제, 배포, 전송, 전시, 공연 및 방송할 수 있습니다. 다음과 같은 조건을 따라야 합니다:
l 귀하는, 이 저작물의 재이용이나 배포의 경우, 이 저작물에 적용된 이용허락조건 을 명확하게 나타내어야 합니다.
l 저작권자로부터 별도의 허가를 받으면 이러한 조건들은 적용되지 않습니다.
저작권법에 따른 이용자의 권리는 위의 내용에 의하여 영향을 받지 않습니다. 이것은 이용허락규약(Legal Code)을 이해하기 쉽게 요약한 것입니다.
Disclaimer
저작자표시. 귀하는 원저작자를 표시하여야 합니다.
비영리. 귀하는 이 저작물을 영리 목적으로 이용할 수 없습니다.
변경금지. 귀하는 이 저작물을 개작, 변형 또는 가공할 수 없습니다.
A THESIS FOR THE DEGREE OF MASTER OF SCIENCE
Two-step enzymatic synthesis of mixed lauric acid esters with
antibacterial and antioxidant activities
항균 및 항산화 활성을 가지는
mixed lauric acid esters 의 2 단계 효소적 합성
February 2020
Department of Agricultural Biotechnology Seoul National University
Yerim Byun
석사학위논문
Two-step enzymatic synthesis of mixed lauric acid esters with antibacterial and antioxidant activities
지도교수 장 판 식
이 논문을 석사학위 논문으로 제출함
2020년 2월
서울대학교 대학원 농 생 명 공 학 부
변 예 림
변예림의 석사 학위논문을 인준함 2020년 2월
위원장 최 상 호 (인)
부위원장 장 판 식 (인)
위원 이 기 원 (인)
I
Abstract
In this study, two-step enzymatic synthesis of multifunctional mixed lauric acid esters (MLE) was conducted in a gas-solid-liquid multiphase system (GSL-MPS) as an alternative to the conventional purification process.
Erythorbyl laurate was synthesized in the first reaction, and the second acyl acceptor was added in the second reaction for the conversion of the residual lauric acid into the new products. Glycerol was selected as the second acyl acceptor for the second reaction as it showed the highest esterification reaction efficiency among four candidates including PEG 600 (Polyethylene glycol 600), propylene glycol, glycerol, and lactic acid. The molar ratio of lauric acid to glycerol for the second reaction of the two-step MLE synthesis was determined as 1.0, considering the monolaurin content, which affects the emulsion stability. As a result, MLE composed of 1.33% erythorbyl laurate, 39.39% monolaurin, 44.19% dilaurin, 2.27% trilaurin, 2.84% erythorbic acid, 2.93% lauric acid, and 7.06%(w/w) glycerol was produced from the two-step enzymatic synthesis. The effects of MLE on emulsion properties were evaluated by the measurements of the droplet size and zeta potential of 5.0%(w/w) oil-in-water emulsions prepared with various concentrations of
II
MLE. Emulsions containing MLE with the concentration below 2.0%(w/w) were stable over 15 days of storage at 25oC, and this might be attributed to the negatively charged and monodispersed oil droplets. Antibacterial activity of MLE against two Gram-positive and two Gram-negative bacteria was investigated in the oil-in-water emulsion. The time-kill curves of MLE showed the concentration-dependent bactericidal effect against Gram-positive bacteria at the concentration ranging from 0.5 to 2.0%(w/w). Lipid oxidation inhibition effect of MLE was evaluated in the oil-in-water emulsion by ferric thiocyanate method. The amounts of lipid hydroperoxide produced during thermally accelerated oxidation decreased with the increasing MLE concentration, indicating that lipid oxidation inhibition effect was dependent on MLE concentration. In conclusion, MLE produced via the two-step synthesis could be used as a multifunctional food additive with antibacterial and antioxidant activities for the oil-in-water emulsion-type food products.
Keywords: two-step enzymatic synthesis, lipase-catalyzed esterification, oil- in-water emulsion, antibacterial activity, antioxidant activity
Student number: 2018-21443
III
Contents
Abstract···I Contents···III List of tables···V List of figures···VI
1. Introduction ···1
2. Materials and methods··· 5
2.1. Materials··· 5
2.2. Lipase catalyzed synthesis in GSL-MPS··· 6
2.3. Quantitative analysis using HPLC ··· 8
2.4. Emulsion preparation···9
2.5. Measurements of droplet size and zeta potential···9
2.6. Time-kill assay in the oil-in-water emulsion···10
2.7. Measurements of lipid oxidation in the oil-in-water emulsion···11
2.8. Statistical analysis···12
3. Results and discussion···13
3.1. Selection of second acyl acceptor··· 13
IV
3.2. Effect of the molar ratio of lauric acid to glycerol···18
3.3. Two-step synthesis of MLE···25
3.4. Emulsion properties··· 29
3.5. Antibacterial properties ··· 37
3.6. Antioxidative properties ··· 42
4. Conclusions···46
5. References··· 47
국문초록···55
V
List of tables
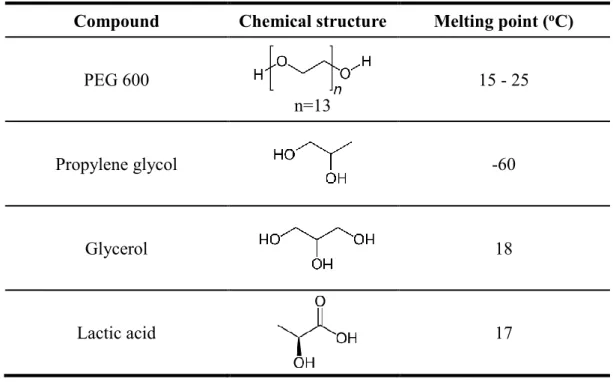
Table 1. Chemical structure and melting point of the second acyl acceptor candidates
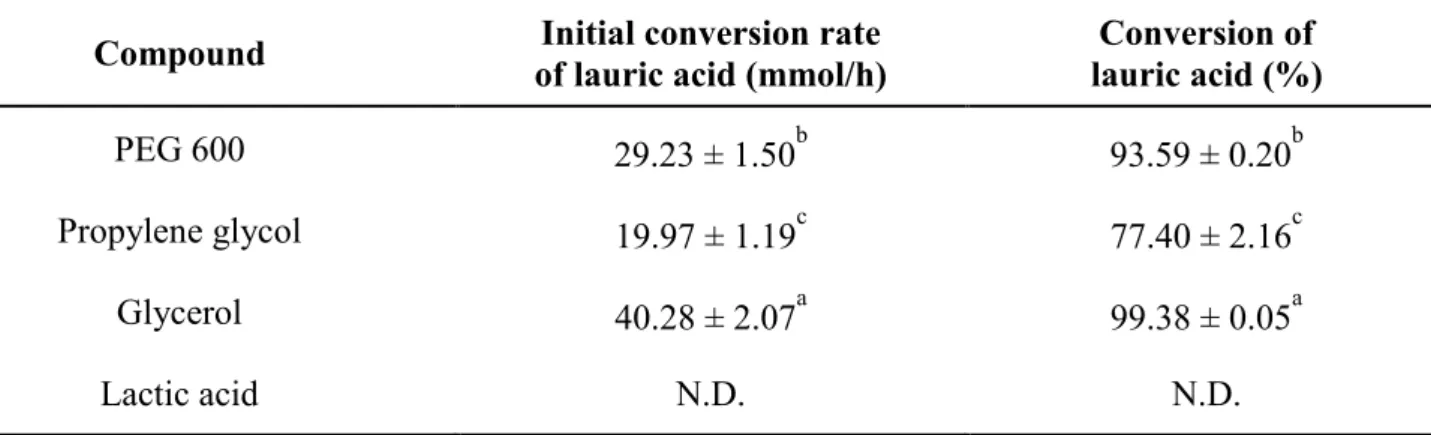
Table 2. Initial conversion rate of lauric acid and conversion of lauric acid obtained from the esterification with the second acyl acceptor candidates
Table 3. Effect of the molar ratio of lauric acid to glycerol on the conversion of lauric acid and the glyceride composition
Table 4. Composition of MLE
Table 5. Polydispersity index changes of Tween 20-stabilized 5.0%(w/w) oil- in-water emulsion containing MLE (0.0 – 2.0%, w/w) during 15 days of storage at 25oC
VI
List of figures
Fig. 1. Illustration of GSL-MPS for the lipase-catalyzed solvent-free synthesis.
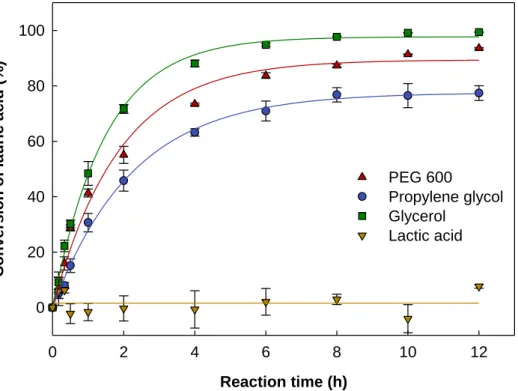
Fig. 2. Time courses of the esterification of lauric acid with the second acyl acceptor candidates (PEG 600, propylene glycol, glycerol, and lactic acid) in GSL-MPS.
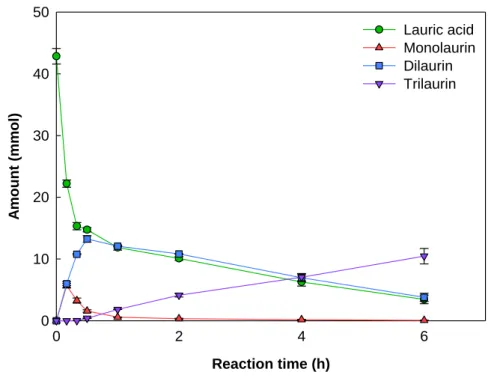
Fig. 3. Time courses of the esterification of lauric acid with glycerol at the substrate molar ratio (lauric acid to glycerol) of (A) 0.5, (B) 1.0, (C) 1.5, (D) 2.0, and (E) 3.0 in GSL-MPS.
Fig. 4. Reaction scheme for the two-step synthesis of MLE.
Fig. 5. Time courses of the two-step MLE synthesis in GSL-MPS.
Fig. 6. Photographs of Tween 20-stabilized 5.0%(w/w) oil-in-water emulsion containing 0.0 - 5.0%(w/w) MLE after storage at 25oC for 24 h.
VII
Fig. 7. Effect of MLE concentration (0.0 – 2.0%, w/w) on the droplet size and the polydispersity index of Tween 20-stabilized 5.0%(w/w) oil-in-water emulsion.
Fig. 8. Effect of MLE concentration (0.0 – 2.0%, w/w) on the zeta potential of Tween 20-stabilized 5.0%(w/w) oil-in-water emulsion.
Fig. 9. Droplet size changes of Tween 20-stabilized 5.0%(w/w) oil-in-water emulsion containing MLE (0.0 – 2.0%, w/w) during 15 days of storage at 25oC.
Fig. 10. Time-kill curves of MLE against (A) Staphylococcus aureus ATCC 12692, (B) Listeria monocytogenes ATCC 19115, (C) Escherichia coli ATCC 35150, and (D) Salmonella Typhimurium ATCC 43971.
Fig. 11. Time-kill curves of erythorbyl laurate and MLE excluding erythorbyl laurate against (A) Staphylococcus aureus ATCC 12692 and (B) Listeria monocytogenes ATCC 19115.
VIII
Fig. 12. Effect of MLE on the formation of lipid hydroperoxides during thermally accelerated oxidation.
Fig. 13. Effect of erythorbyl laurate and MLE excluding erythorbyl laurate on the formation of lipid hydroperoxides during thermally accelerated oxidation.
1
1. Introduction
Erythorbyl laurate is an amphiphilic compound produced by lipase- catalyzed esterification of erythorbic acid with lauric acid. As the amphiphilic characteristic gives it surface-active properties and high foaming stability, erythorbyl laurate can be used for the stabilization of the oil-in-water emulsion (Park, Lee, Jo, Choi, Lee, & Chang, 2017). Besides, erythorbyl laurate can act as an antioxidant since it inhibits lipid oxidation in the oil-in-water emulsion during thermally accelerated oxidation or photo-oxidation (Park, Lee, Jo, Choi, Lee, & Chang, 2017). Erythorbyl laurate also exhibits both bacteriostatic and bactericidal effects against Gram-positive foodborne pathogens by the alteration of the cell membrane permeability (Park, Jo, Yu, Park, Choi, Lee, et al., 2018). Therefore, it was expected that multifunctional erythorbyl laurate with emulsifying, antibacterial, and antioxidant activities in a single molecule could control the microbial contamination and lipid oxidation in the oil-in- water emulsion-type foods.
Production of erythorbyl laurate in an organic solvent system has limitations such as safety issues and low production yield caused by the low solubility of the substrates in the organic solvent (Park, Lee, Sung, Lee, & Chang, 2011).
2
On the other hand, a solvent-free reaction system, an environmentally friendly system, has several advantages derived from the absence of organic solvents, such as greater safety and higher volumetric productivities (Dossat, Combes,
& Marty, 2002; Freitas, Perez, Santos, & Castro, 2007). In addition, solvent- free system in the food industry is highly preferred as it is safe (Abed, Wei, Ali, Korma, Mousa, Hassan, et al., 2018). However, it was hard to synthesize erythorbyl laurate in the solvent-free system because erythorbic acid was not soluble in lauric acid and existed as solid-phase at the maximum working temperature of Novozym® 435 (110oC) (Verdasco-Martín, Villalba, dos Santos, Tobajas, Fernandez-Lafuente, & Otero, 2016), causing mass transfer limitation. Therefore, a gas-solid-liquid multiphase system (GSL-MPS), enhancing the dispersion of the solid-phase by incorporating the gaseous phase, was established in the previous study (Yu, Lee, Shin, Park, & Chang, 2019).
Even though the production of erythorbyl laurate in GSL-MPS had numerous advantages, including higher volumetric productivities in a batch reactor, the conversion yield was still at a low level due to the presence of the solid-phase.
Therefore, large amounts of the residual substrates were unavoidable after the synthesis of erythorbyl laurate in GSL-MPS.
The purification process is generally accomplished by solvent extraction, recrystallization, silica gel chromatography, molecular distillation, or the
3
combination of these methods for the removal or recovery of the residual substrates after the synthesis (Enayati, Gong, Goddard, & Abbaspourrad, 2018;
Viklund & Hult, 2004; Zhang, Wang, Xie, Zou, Jin, & Wang, 2018). However, solvent extraction, recrystallization, and silica gel chromatography require organic solvents, and molecular distillation consumes large amounts of energy due to high operating temperature. Therefore, the purification process could cause the problems of safety, environmental concerns, and costs. Purification of erythorbyl laurate, for example, is carried out by solvent extraction based on the difference in the solubility between erythorbic acid, lauric acid, and erythorbyl laurate. Lauric acid is removed with n-hexane, followed by the removal of erythorbic acid with water in the same manner. Those intricate purification process has become a hurdle that limits the application of erythorbyl laurate in the food industry.
The addition of another substrate for the conversion of the residual lauric acid into the new products was expected to be an alternative to the conventional purification process. Besides, a mixture of erythorbyl laurate and the second reaction products produced by the additional esterification reaction was expected to exhibit the same functionalities as that of erythorbyl laurate, such as antibacterial and antioxidant activities in the oil-in-water emulsion.
In the present study, glycerol, having the highest reaction efficiency for the
4
conversion of lauric acid among the candidates, was selected as the second acyl acceptor. Erythorbyl laurate was synthesized in the first reaction, and glycerol was added in the second reaction, making the process as the two-step synthesis of the multifunctional mixture. Consequently, successive two-step synthesis produced mixed lauric acid esters (MLE) composed of erythorbyl laurate and glyceryl laurates. The effects of MLE on emulsion properties were evaluated, and antibacterial and antioxidant activities of MLE in the oil-in- water emulsion were investigated.
5
2. Materials and methods
2.1. Materials
Novozym® 435, immobilized lipase from Candida antarctica, was purchased from Novozymes (Bagsvaerd, Denmark) with a catalytic activity of 10,000 PLU/g (Propyl laurate unit, 1 PLU is the amount of enzyme activity which generates 1 μmol of propyl laurate per minute). Lauric acid (≥ 99.0%) and soybean oil were purchased from Daejung Chemicals & Metals Co., LTD.
(Siheung, Korea), and Tween 20 was purchased from Ilshinwells (Cheongju, Korea). Erythorbic acid (≥ 98.0%), glycerol (≥ 99.5%), polyethylene glycol 600 (PEG 600), propylene glycol, and lactic acid were purchased from Acros Organics (Geel, Belgium), Fisher Chemical (Loughborough, Leicestershire, UK), Wako Pure Chemical Industries, LTD. (Osaka, Japan), Junsei Chemical Co., LTD. (Tokyo, Japan), and Showa Chemical (Tokyo, Japan), respectively.
All other reagents and solvents were analytical or HPLC grade.
6
2.2. Lipase-catalyzed synthesis in GSL-MPS
All lipase-catalyzed synthesis was carried out in GSL-MPS (Fig. 1). During the reaction, nitrogen gas was distributed through the glass filter (0.5 cm thickness, 27.5 μm pore size) with a flow rate of 2.0 mL/min. Reaction vessels were preheated, and the reaction temperature was kept constant at 60oC by a water circulator. Lauric acid was added into the reaction vessel and melted for 20 min, followed by the addition of an acyl acceptor. The reaction was initiated by adding Novozym® 435. After the reactions were finished, the nitrogen gas generator was replaced with the vacuum pump, and the reactants were filtrated through the glass filter.
The initial conversion rate of lauric acid was obtained from the slope of the linear part of the curve. The conversion of lauric acid was calculated according to the equation below
Conversion of lauric acid (%) = Co- C
Co × 100
where Co is the initial lauric acid concentration and C is the residual lauric acid concentration after reaction time.
7
Fig. 1. Illustration of GSL-MPS for the lipase-catalyzed solvent-free synthesis.
8
2.3. Quantitative analysis using HPLC (High-performance liquid chromatography)
The esterification reaction was monitored by HPLC (LC-2002, Jasco, Tokyo, Japan) equipped with an ultraviolet detector (UV-2075, Jasco) and a refractive index detector (RI-2031, Jasco). Separation of the compounds was carried out on a silica-based column (5.0 µm, 4.6 × 150 mm: Luna C18, Phenomenex, Torrance, CA, USA) and the column temperature was held at 30oC. The mobile phase for the analysis of the reactants of the esterification reaction of lauric acid with PEG 600, propylene glycol, and lactic acid was methanol/water/acetic acid (90:5:5, v/v/v). For the analysis of the reactants of the esterification of lauric acid with glycerol, the mobile phase consisted of acetonitrile/acetone (50:50, v/v), whereas the reactants of the esterification of lauric acid with erythorbic acid was analyzed with the mobile phase composed of acetonitrile/water/acetic acid (90:5:5, v/v/v). All mobile phases passed through the column with a flow rate of 1.0 mL/min. Erythorbic acid and erythorbyl laurate were detected on the UV detector at a wavelength of 265 nm while other compounds were detected on the RI detector. All compounds were identified by their retention time, and the concentrations were calculated from the standard curves of each compound (R2 > 0.994).
9
2.4. Emulsion preparation
The water phase consisted of Tween 20 (1.0%, w/w) and distilled water (up to 100.0%, w/w) while the oil phase consisted of the soybean oil (5.0%, w/w) and various concentrations of MLE. The concentration of the soybean oil and Tween 20 was designed to mimic a beverage emulsion (Perugini, Cinelli, Cofelice, Ceglie, Lopez, & Cuomo, 2018). Both water and the oil phase were heated up to 70oC to melt MLE, and the water phase was transferred to the oil phase. Water and the oil phase were mixed using a high-speed blender (Ultra- Turrax IKA T18 basic, IKA Works Inc., Wilmington, NC, USA) at 12,000 rpm for 3 min to form a coarse emulsion. The coarse emulsion was further homogenized for 10 min (1 s on, 4 s off) using an ultrasonicator (Sonomasher, S&T Science, Seoul, Korea) to produce a fine emulsion. The emulsion was immediately cooled down to room temperature (25oC) with tap water. The emulsions used for time-kill assay were prepared with 20 mM phosphate buffer (pH 7.4) instead of distilled water. Each emulsion was prepared in triplicate. The emulsions prepared without MLE was considered as the control emulsion.
2.5. Measurements of droplet size and zeta potential
Droplet size and zeta potential of the emulsions were analyzed at 25oC using
10
Zetasizer Nano ZS90 (Malvern Instruments Ltd., Worcestershire, UK), and each measurement was performed in triplicate. For the measurement of the droplet size, the emulsions were diluted at 1:1,000 (v/v) with distilled water to prevent multiple scattering. The average droplet size was expressed as the intensity-weighted mean droplet diameter (Z-average size), and the width parameter was presented as the polydispersity index. For the measurement of the zeta potential, the emulsions were diluted at 1:100 (v/v) with distilled water.
2.6. Time-kill assay in the oil-in-water emulsion
Two Gram-positive and two Gram-negative bacteria used in this study were Staphylococcus aureus ATCC 12692, Listeria monocytogenes ATCC 19115, Escherichia coli ATCC 35150, and Salmonella Typhimurium ATCC 43971.
All bacteria were cultured in MHB (Mueller-Hinton broth) at 37oC, 220 rpm for 12-16 h. Cultures were diluted in MHB until the turbidity was reached to 0.5 McFarland standard (1.5 × 10⁸ CFU/mL). McFarland standard suspensions were further diluted to have a cell density of 5.0 × 10⁶ CFU/mL.
Emulsions (3,600 μL) containing 0.0, 0.5, 1.0, and 2.0%(w/w) MLE were mixed with bacterial suspensions (400 μL) and incubated at 37oC, 220 rpm.
Aliquots (200 μL) were taken out at 0, 0.5, 1, 2, 4, 6, 8, 10, and 12 h, and serially diluted in 20 mM phosphate buffer (pH 7.4). Diluted samples (50 μL)
11
were spread on TSA (Tryptic soy agar), and viable cells were counted after incubation at 37oC for 24 h. All experiments were triplicated.
2.7. Measurements of lipid oxidation in the oil-in-water emulsion
Emulsions (6 mL) were placed in 10 mL screw-capped glass vial and allowed to be oxidized with thermal acceleration at 37oC. Lipid hydroperoxides were measured as primary lipid oxidation products according to the method by Shantha and Decker (Shantha & Decker, 1994). Every 24 h, emulsion (300 µL) was taken out and mixed with 1,500 µL of isooctane/2- propanol solution (3:1, v/v) and vortexed (10 s, 3 times). The mixed solution was centrifuged at 2,000 × g for 2 min (Micro-12, Hanil Scientific Inc., Gimpo, Korea). The upper organic layer (200 µL) was mixed with 2,800 µL of methanol/butanol solution (2:1, v/v), followed by the addition of 15 µL of 3.94 M ammonium thiocyanate and 15 µL of Fe2+ solution. The Fe2+ solution was prepared freshly from the supernatant of 0.132 M BaCl2 in 0.4 M HCl and 0.144 M FeSO4. The solution was vortexed and held 20 min at room temperature, and the absorbance was measured at 510 nm in a UV-vis spectrophotometer (Optizen POP-BIO, Mecasys Co., Ltd., Daejeon, Korea).
Lipid hydroperoxide concentrations were determined using a standard curve prepared from hydrogen peroxide (R2 = 0.9978).
12
2.8. Statistical analysis
All data were analyzed by analysis of variance (ANOVA) using SPSS software version 25 (SPSS, Inc., Chicago, IL, USA), and presented as means and standard deviations of triplicate experiments. The differences between mean values were compared using Duncan’s multiple range test (p < 0.05).
13
3. Results and discussion
3.1. Selection of second acyl acceptor
The first criterion for the selection of the second acyl acceptor was the presence of the hydroxyl group because the lipase catalyzes the esterification of the carboxyl group of lauric acid with the hydroxyl group of the acyl acceptor. The second criterion was the melting point lower than the optimum temperature of Novozym® 435 (40 - 60oC) (Lee, Widjaja, & Ju, 2006) because the low conversion caused by the mass transfer limitation could be obtained if the second acyl acceptor exists as a solid-state (Erbeldinger, Ni, & Halling, 1998). Therefore, PEG 600, propylene glycol, glycerol, and lactic acid were chosen as the second acyl acceptor candidates, among the compounds having hydroxyl groups, such as sugar alcohols, monosaccharides, disaccharides, phenolic compounds, hydroxylated organic acids, PEGs, glycerol, and propylene glycol (Table 1).
Lipase-catalyzed esterification of lauric acid with the second acyl acceptor candidates, except for lactic acid, reached equilibrium in 12 h (Fig. 2). On the other hand, esterification of lauric acid with lactic acid did not occur. The esterification reaction efficiency of the second acyl acceptor candidates was
14
expressed as the initial conversion rate of lauric acid and the conversion of lauric acid at the reaction time of 12 h (Table 2). Both the initial conversion rate of lauric acid and the conversion of lauric acid were the highest in the reaction with glycerol, followed by PEG 600 and propylene glycol.
In CALB (Candida antarctica lipase B)-catalyzed esterification, the number of the hydroxyl group and the types of alcohol could affect the reaction efficiency since the primary alcohol is more reactive than the secondary alcohol (Gustini, Noordover, Gehrels, Dietz, & Koning, 2015). Therefore, the reason for the lowest reaction efficiency of lactic acid can be explained by the absence of primary alcohol. Besides, a carboxyl group adjacent to the secondary alcohol might have lowered the nucleophilicity of lactic acid. The higher reaction efficiency of PEG 600 compared to propylene glycol could be attributed to the difference in the number of primary alcohols. PEG 600 has two primary alcohols, while propylene glycol has one primary alcohol and one secondary alcohol. The highest reaction efficiency of glycerol can be explained by the fact that glycerol has two primary alcohols and one secondary alcohol, which makes glycerol have more opportunity for the formation of the ester bonds. Thus, out of four candidates, glycerol showing the highest reaction efficiency was chosen as the second acyl acceptor for the second reaction of the two-step MLE synthesis.
15
Compound Chemical structure Melting point (oC)
PEG 600
n=13
15 - 25
Propylene glycol -60
Glycerol 18
Lactic acid 17
Table 1. Chemical structure and melting point of the second acyl acceptor candidates
16
3000 PLU
Reaction time (h)
0 2 4 6 8 10 12
Conversion of lauric acid (%)
0 20 40 60 80 100
PEG 600
Propylene glycol Glycerol
Lactic acid
Fig. 2. Time courses of the esterification of lauric acid with the second acyl acceptor candidates (PEG 600, propylene glycol, glycerol, and lactic acid) in GSL-MPS. Reaction conditions: lauric acid, 60.66 mmol; second acyl acceptor candidate, 30.33 mmol; enzyme, 3,000 PLU NovozymⓇ 435; reaction temperature, 60oC; reaction time, 12 h;
N2 gas flow, 2.0 L/min.
.
17
Compound Initial conversion rate
of lauric acid (mmol/h) Conversion of lauric acid (%)
PEG 600 29.23 ± 1.50b 93.59 ± 0.20b
Propylene glycol 19.97 ± 1.19c 77.40 ± 2.16c
Glycerol 40.28 ± 2.07a 99.38 ± 0.05a
Lactic acid N.D. N.D.
Table 2. Initial conversion rate of lauric acid and conversion of lauric acid obtained from the esterification with the second acyl acceptor candidates
The values with different superscripts in each column are significantly different (p < 0.05) by Duncan’s multiple range test. N.D.: Not determined.
18
3.2. Effect of the molar ratio of lauric acid to glycerol
Oil-in-water emulsions are the basis of many food products, such as beverages, salad dressings, ice creams, and mayonnaise (Cheng, Xiong, &
Chen, 2010). The emulsions consist of the oil droplets dispersed in the aqueous phase, and the emulsifiers are added to stabilize thermodynamically unstable emulsions (McClements & Jafari, 2018). Monoglycerides have been widely used for the stabilization of the oil-in-water emulsions with small-molecule co-emulsifiers (Chen, Liang, Li, He, Zeng, Gao, et al., 2019; Kantekin- Erdogan, Ketenoglu, & Tekin, 2019; Mao, Calligaris, Barba, & Miao, 2014) due to their amphiphilic characteristics. On the other hand, diglycerides and triglycerides are not suitable for the stabilization of the oil-in-water emulsion as they are highly oil-soluble. During the esterification of lauric acid with glycerol, three types of glycerides including monolaurin, dilaurin, and trilaurin can be synthesized. Among them, the content of monolaurin in MLE was considered as the critical determinant of the oil-in-water emulsion stability.
The parameters determining the glyceride composition in the lipase- catalyzed esterification reaction include the substrate molar ratio, the specificity of the lipase, the reaction time, and the water activity (Chand, Adlercreutz, & Mattiasson, 1997). The molar ratio of lauric acid to glycerol was thought to be the most critical factor with reference to the several studies
19
identified that the molar ratio of fatty acid to glycerol affects the glyceride composition (Rosu, Yasui, Iwasaki, & Yamane, 1999; Tüter, 1998). Therefore, lauric acid esters of glycerol were synthesized at the molar ratio of 0.5, 1.0, 1.5, 2.0, and 3.0 to investigate the effect of lauric acid to glycerol molar ratio on the glyceride composition.
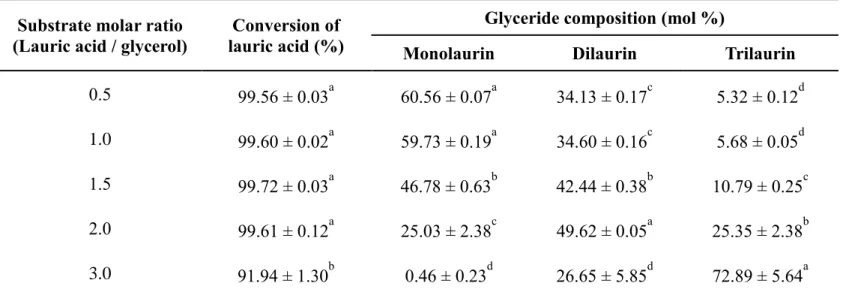
The conversion of lauric acid and the glyceride composition were highly dependent on the molar ratio of lauric acid to glycerol (Fig. 3 and Table 3).
The conversion of lauric acid was higher than 99.6% at the substrate molar ratio between 0.5 and 2.0, whereas the molar ratio of 3.0 resulted in the lowest value of 91.94%. This suggests that the decreasing glycerol led to less conversion of lauric acid. The content of monolaurin increased and of trilaurin decreased as the molar ratio decreased from 3.0 to 1.0. On the other hand, no significant difference in the glyceride composition was observed at the substrate molar ratio between 0.5 and 1.0, but the concentration of the products was lowered when the substrate molar ratio was 0.5. Diglyceride content from total glyceride was the lowest at the substrate molar ratio of 3.0, and it increased with the increasing molar ratio from 0.5 to 2.0. The results obtained in this study were in accordance with other studies which revealed that the high substrate molar ratio of fatty acid to glycerol suppresses both monoglycerides production and fatty acid conversion (Freitas, Perez, Santos,
20
& Castro, 2007; Ghamgui, Miled, Rebaï, Karra-chaâbouni, & Gargouri, 2006;
Kantekin-Erdogan, Ketenoglu, & Tekin, 2019; Watanabe, Yamauchi-Sato, Nagao, Yamamoto, Ogita, & Shimada, 2004). Therefore, considering monolaurin content from total glyceride, conversion of lauric acid, and the amount of the residual glycerol, the substrate molar ratio of lauric acid to glycerol for the second reaction of the two-step MLE synthesis was set to 1.0.
21
Glyceryl laurate (G : L = 2 : 1)
Reaction time (h)
0 2 4 6
Amount (mmol)
0 10 20 30 40 50
Lauric acid Monolaurin Dilaurin Trilaurin
Glyceryl laurate (G : L = 1 : 1)
Reaction time (h)
0 2 4 6
Amount (mmol)
0 10 20 30 40 50
Lauric acid Monolaurin Dilaurin Trilaurin
A
B
22
Glyceryl laurate (G : L = 2 : 3)
Reaction time (h)
0 2 4 6
Amount (mmol)
0 10 20 30 40 50
Lauric acid Monolaurin Dilaurin Trilaurin
Glyceryl laurate (G : L = 1 : 2)
Reaction time (h)
0 2 4 6
Amount (mmol)
0 10 20 30 40 50
Lauric acid Monolaurin Dilaurin Trilaurin
C
D
23
Glyceryl laurate (G : L = 1 : 3)
Reaction time (h)
0 2 4 6
Amount (mmol)
0 10 20 30 40 50
Lauric acid Monolaurin Dilaurin Trilaurin
E
Fig. 3. Time courses of the esterification of lauric acid with glycerol at the substrate molar ratio (lauric acid to glycerol) of (A) 0.5, (B) 1.0, (C) 1.5, (D) 2.0, and (E) 3.0 in GSL-MPS.Reaction conditions:
lauric acid, 43.33 mmol; enzyme, 12,000 PLU NovozymⓇ 435;
reaction temperature, 60oC; reaction time, 6 h; N2 gas flow, 2.0 L/min.
24
Substrate molar ratio
(Lauric acid / glycerol) Conversion of lauric acid (%)
Glyceride composition (mol %)
Monolaurin Dilaurin Trilaurin
0.5 99.56 ± 0.03a 60.56 ± 0.07a 34.13 ± 0.17c 5.32 ± 0.12d
1.0 99.60 ± 0.02a 59.73 ± 0.19a 34.60 ± 0.16c 5.68 ± 0.05d
1.5 99.72 ± 0.03a 46.78 ± 0.63b 42.44 ± 0.38b 10.79 ± 0.25c
2.0 99.61 ± 0.12a 25.03 ± 2.38c 49.62 ± 0.05a 25.35 ± 2.38b
3.0 91.94 ± 1.30b 0.46 ± 0.23d 26.65 ± 5.85d 72.89 ± 5.64a
Table 3. Effect of the molar ratio of lauric acid to glycerol on the conversion of lauric acid and the glyceride composition
The values with different superscripts in each column are significantly different (p < 0.05) by Duncan’s multiple range test.
25
3.3. Two-step synthesis of MLE
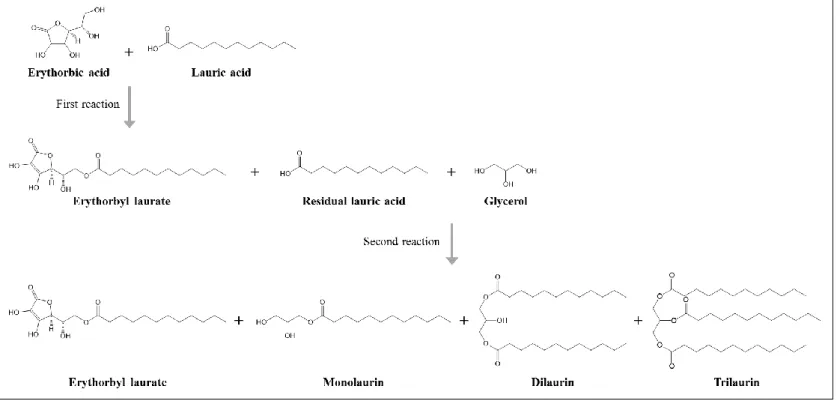
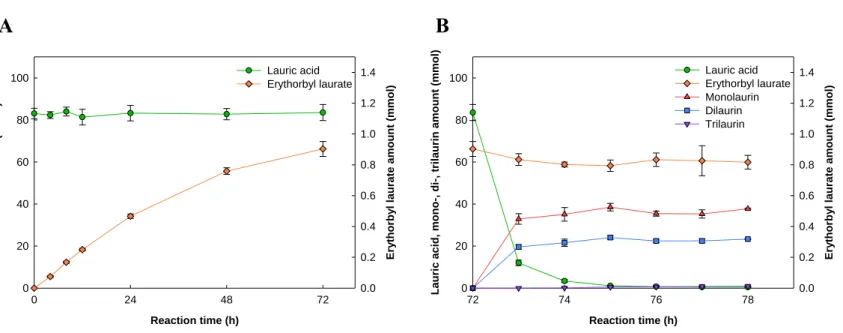
MLE was synthesized by the two-step esterification reaction (Fig. 4). In the first reaction, erythorbyl laurate was synthesized for 72 h with the production yield of 15.82 ± 0.25 mg/mL (Fig. 5A), in accordance with the previous study (Yu, Lee, Shin, Park, & Chang, 2019). In the second reaction, monolaurin, dilaurin, and trilaurin were synthesized for 6 h by the addition of glycerol (Fig.
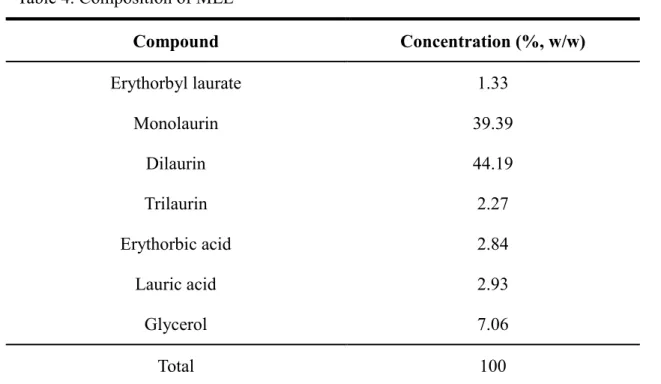
5B). The time course of the second reaction was the same regardless of whether the first reaction is performed of not. The composition of MLE obtained by the two-step synthesis was analyzed (Table 4) and used for further experiments.
Transesterification is the process of converting the alkoxy group of an ester into another alcohol (Demirbas, 2008). The hydrolysis of the products and the formation of the new products can take place depending on the reaction equilibrium in the transesterification reaction. In the two-step MLE synthesis, the transesterification reaction between erythorbyl laurate and glycerol or between glycerides and erythorbic acid is possible. However, the amount of erythorbyl laurate synthesized in the first reaction did not change during the second reaction, indicating that the transesterification did not occur after the addition of glycerol as the second acyl acceptor.
26
Fig. 4. Reaction scheme for the two-step synthesis of MLE.
27
1st reaction
Reaction time (h)
0 24 48 72
Lauric acid amount (mmol)
0 20 40 60 80 100
Erythorbyl laurate amount (mmol)
0.0 0.2 0.4 0.6 0.8 1.0 1.2 Lauric acid 1.4
Erythorbyl laurate
2nd reaction
Reaction time (h)
72 74 76 78
Lauric acid, mono-, di-, trilaurin amount (mmol)
0 20 40 60 80 100
Erythorbyl laurate amount (mmol)
0.0 0.2 0.4 0.6 0.8 1.0 1.2 Lauric acid 1.4
Erythorbyl laurate Monolaurin Dilaurin Trilaurin
A B
Fig. 5. Time courses of the two-step MLE synthesis in GSL-MPS. Reaction conditions of (A) the first reaction:
erythorbic acid, 43.33 mmol; lauric acid, 86.66 mmol; enzyme, 24,000 PLU NovozymⓇ 435; reaction temperature, 60oC; reaction time, 72 h; N2 gas flow, 2.0 L/min. After 72 h of the first reaction, 84.70 mmol glycerol was added, and the second reaction was performed for 6 h. Other reaction conditions of the second reaction were the same as the first reaction.
28
Compound Concentration (%, w/w)
Erythorbyl laurate 1.33
Monolaurin 39.39
Dilaurin 44.19
Trilaurin 2.27
Erythorbic acid 2.84
Lauric acid 2.93
Glycerol 7.06
Total 100
Table 4. Composition of MLE
Concentration is expressed in the average weight percentage of the triplicate.
29
3.4. Emulsion properties
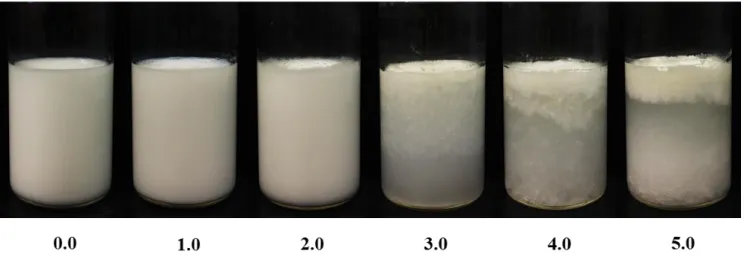
Initial emulsion stability, initial emulsion properties, and storage stability were investigated to evaluate the effects of MLE on emulsion properties. The initial emulsion stability was evaluated by visual observation of the phase separation of the emulsions containing 0.0 – 5.0%(w/w) MLE after 24 h of storage at 25oC. The emulsions containing MLE with the concentration above 2.0%(w/w) were destabilized within the first 24 h, and the separation of a distinct lipid layer at the top and a relatively transparent aqueous layer at the bottom was observed more clearly as MLE concentration increased from 3.0 to 5.0%(w/w) (Fig. 6). On the other hand, the control emulsion (0.0% MLE) and the emulsions containing MLE with the concentration between 1.0 and 2.0%(w/w) were stable over 24 h of storage at 25oC.
Droplet size and zeta potential of the emulsions containing MLE with the concentration below 2.0%(w/w) were measured to evaluate the initial emulsion properties. The droplet size decreased as MLE concentration increased from 0.0 to 1.0%(w/w), and increased as MLE concentration increased from 1.0 to 2.0%(w/w). The average polydispersity index of all emulsions containing MLE with the concentration below 2.0%(w/w) was lower than 0.2 (Fig. 7), indicating that the emulsions had a narrow size distribution (C. C. Loi, G. T. Eyres, & E. J. Birch, 2019).
30
The droplet size of the oil-in-water emulsion generally decreases with increasing surfactant to oil ratio (Kundu, Agrawal, Mateen, & Mishra, 2013) and increases with increasing oil concentration (Ni, Hu, Sun, Zhao, & Xia, 2017). The decreasing droplet size with increasing MLE concentration from 0.0 to 1.0%(w/w) might be due to the increasing erythorbyl laurate and monolaurin, which are amphiphilic compounds. They can locate at the oil- water interface, so they might have attributed to split the oil droplets into small pieces to minimize the surface tension and maximize the interfacial area (Saberi, Fang, & McClements, 2013). On the other hand, the increasing droplet size with increasing MLE concentration from 1.0 to 2.0%(w/w) might be caused by the increasing content of oil-soluble dilaurin and trilaurin rather than the effect of erythorbyl laurate and monolaurin (Chia Chun Loi, Graham T. Eyres, & E. John Birch, 2019).
Zeta potential gives information on emulsion stability based on the surface charge of the droplet (Masum, Chandrapala, Adhikari, Huppertz, & Zisu, 2019). The increase in absolute zeta potential indicates the increase in repulsive forces between the oil droplets (Jiang, Liu, Wang, Yang, Chen, Zhong, et al., 2019), and the emulsions having zeta potential more negative than -30 mV are considered stable (Li & Lu, 2016; Salvia-Trujillo, Rojas-Graü, Soliva-Fortuny, & Martín-Belloso, 2015). The zeta potential decreased with
31
the increasing MLE concentration (Fig. 8), and all emulsions containing MLE with the concentration from 0.5 to 2.0%(w/w) had zeta potential below -30 mV, indicating they were stable. The decreasing zeta potential with the increasing MLE concentration might be due to the increase of lauric acid, the free fatty acid having a negative charge on the carboxyl group (Hur, Joo, Lim, Decker, & McClements, 2011).
Storage stability was evaluated by the changes of the droplet size (Fig. 9).
At all concentrations of MLE, no significant change in the droplet size was observed during 15 days of storage at 25oC. Polydispersity index of the emulsions also did not change or slightly changed during the storage time (Table 5). These results suggest that the negatively charged and monodispersed oil droplets contributed to the storage stability of the emulsions containing MLE with the concentrations below 2.0%(w/w). In conclusion, MLE can be added to the oil-in-water emulsion-type foods up to 2.0%(w/w), and the emulsions could remain stable.
32
Fig. 6. Photographs of Tween 20-stabilized 5.0%(w/w) oil-in-water emulsion containing 0.0 - 5.0%(w/w) MLE after storage at 25oC for 24 h.
33
MLE concentration (%, w/w)
0.0 0.5 1.0 1.5 2.0
Z-average size (nm)
0 100 200 300 400 500
Polydispersity index
0.0 0.2 0.4 0.6 0.8 1.0 Z-average size
Polydispersity index
Fig. 7. Effect of MLE concentration (0.0 – 2.0%, w/w) on the droplet size and the polydispersity index of Tween 20-stabilized 5.0%(w/w) oil-in- water emulsion.
34
MLE concentration (%, w/w)
0.0 0.5 1.0 1.5 2.0
-potential (mV)
-45 -40 -35 -30 -25
Fig. 8. Effect of MLE concentration (0.0 – 2.0%, w/w) on the zeta potential of Tween 20-stabilized 5.0%(w/w) oil-in-water emulsion.
35
Storage time (day)
0 3 6 9 12 15
Z-average size (nm)
0 100 200 300 400 500
0.0% MLE 0.5% MLE 1.0% MLE 1.5% MLE 2.0% MLE
Fig. 9. Droplet size changes of Tween 20-stabilized 5.0%(w/w) oil- in-water emulsion containing MLE (0.0 – 2.0%, w/w) during 15 days of storage at 25oC.
36
MLE concentration
(%, w/w)
Polydispersity index
Day 0 Day 3 Day 6 Day 9 Day 12 Day 15
0.0 0.241 ± 0.008a 0.243 ± 0.009a 0.240 ± 0.018a 0.247 ± 0.007a 0.238 ± 0.004a 0.250 ± 0.016a 0.5 0.167 ± 0.011a 0.181 ± 0.003a 0.184 ± 0.018a 0.167 ± 0.012a 0.169 ± 0.011a 0.175 ± 0.008a 1.0 0.140 ± 0.008ab 0.147 ± 0.007ab 0.159 ± 0.008b 0.126 ± 0.013a 0.147 ± 0.000ab 0.139 ± 0.015ab 1.5 0.087 ± 0.031a 0.135 ± 0.037a 0.136 ± 0.020a 0.090 ± 0.006a 0.110 ± 0.002a 0.124 ± 0.034a 2.0 0.183 ± 0.030a 0.223 ± 0.003ab 0.269 ± 0.015c 0.241 ± 0.014bc 0.218 ± 0.015ab 0.250 ± 0.019bc Table 5. Polydispersity index changes of Tween 20-stabilized 5.0%(w/w) oil-in-water emulsion containing MLE (0.0 – 2.0%, w/w) during 15 days of storage at 25oC
The values with different superscripts in each row are significantly different (p < 0.05) by Duncan’s multiple range test.
37
3.5. Antibacterial properties
Antibacterial activity of MLE against two Gram-positive and two Gram- negative bacteria was evaluated in the oil-in-water emulsion by time-kill assay.
MLE with the concentration of 2.0%(w/w) did not result in bacteriostatic or bactericidal effect against Gram-negative bacteria, such as E. coli ATCC 35150 and S. Typhimurium ATCC 43971 (Fig. 10C and D). On the other hand, MLE at all concentrations exhibited bactericidal effect against Gram-positive bacteria, including S. aureus ATCC 12692 and L. monocytogenes ATCC 19115, and the concentration-dependent effect was observed (Fig. 10A and B).
The antibacterial activities of 0.007%(w/w) erythorbyl laurate and 0.493%(w/w) MLE excluding erythorbyl laurate against two Gram-positive bacteria were evaluated to verify the effects of erythorbyl laurate and other compounds obtained from the second reaction on the antibacterial activity of MLE (Fig. 11). The concentration of erythorbyl laurate and MLE excluding erythorbyl laurate was determined to correspond to 0.5%(w/w) MLE. The results suggest that the antibacterial activity of MLE against Gram-positive bacteria might be due to the presence of erythorbyl laurate and monolaurin because they are known to have antibacterial activity against Gram-positive bacteria (Lieberman, Enig, & Preuss, 2006; Park, et al., 2018). Consequently,
38
MLE could control the contamination of Gram-positive bacteria in the oil-in- water emulsion-type foods.
39
Staphylococcus aureus ATCC 12692
Incubation time (h)
0 2 4 6 8 10 12
Log CFU/mL
0 1 2 3 4 5 6 7 8 9 10 11
0.0% MLE 0.5% MLE 1.0% MLE 2.0% MLE
Listeria monocytogenes ATCC 19115
Incubation time (h)
0 2 4 6 8 10 12
Log CFU/mL
0 1 2 3 4 5 6 7 8 9 10 11
0.0% MLE 0.5% MLE 1.0% MLE 2.0% MLE
A
B
40
Escherichia coli ATCC 35150
Incubation time (h)
0 4 8 12 16 20 24
Log CFU/mL
0 1 2 3 4 5 6 7 8 9 10 11
0.0% MLE 2.0% MLE
Salmonella Typhimurium ATCC 43971
Incubation time (h)
0 4 8 12 16 20 24
Log CFU/mL
0 1 2 3 4 5 6 7 8 9 10 11
0.0% MLE 2.0% MLE
Fig. 10. Time-kill curves of MLE against (A) Staphylococcus aureus ATCC 12692, (B) Listeria monocytogenes ATCC 19115, (C) Escherichia coli ATCC 35150, and (D) Salmonella Typhimurium ATCC 43971. Dashed line indicates the limit of detection (20 CFU/mL).
C
D
41
Staphylococcus aureus ATCC 12692
Incubation time (h)
0 2 4 6 8 10 12
Log CFU/mL
0 1 2 3 4 5 6 7 8 9 10 11
0.0% MLE 0.5% MLE
0.007% Erythorbyl laurate
0.493% MLE excluding erythorbyl laurate
Listeria monocytogenes ATCC 19115
Incubation time (h)
0 2 4 6 8 10 12
Log CFU/mL
0 1 2 3 4 5 6 7 8 9 10 11
0.0% MLE 0.5% MLE
0.007% Erythorbyl laurate
0.493% MLE excluding erythorbyl laurate
A
B
Fig. 11. Time-kill curves of erythorbyl laurate and MLE excluding erythorbyl laurate against (A) Staphylococcus aureus ATCC 12692 and (B) Listeria monocytogenes ATCC 19115. Dashed line indicates the limit of detection (20 CFU/mL).
42
3.6. Antioxidative properties
Lipid oxidation inhibition effect of MLE in the oil-in-water emulsion was evaluated using the ferric thiocyanate method during thermally accelerated oxidation. The formation of lipid hydroperoxide in the oil-in-water emulsion was affected by the concentration of MLE (Fig. 12). For the control emulsion, lipid hydroperoxides were produced without a lag phase, whereas the emulsions prepared with 0.5, 1.0, and 2.0%(w/w) MLE had 1, 2, and 3 days of lag phases, respectively. After 9 days of storage at 37oC, lipid hydroperoxide concentrations were 50.0, 84.3, and 98.3% lower than that of the control emulsion in the presence of 0.5, 1.0, and 2.0%(w/w) MLE.
Lipid oxidation inhibition effects of 0.013%(w/w) erythorbyl laurate and 0.987%(w/w) MLE excluding erythorbyl laurate were investigated to examine the antioxidant activity of erythorbyl laurate and other compounds produced by the two-step synthesis. The emulsions containing erythorbyl laurate and MLE excluding erythorbyl laurate consisted of a composition equal to the emulsions with 1.0%(w/w) MLE. Both erythorbyl laurate and MLE excluding erythorbyl laurate inhibited the formation of lipid hydroperoxides (Fig. 13).
The amounts of lipid hydroperoxide produced by the oil-in-water emulsions containing 0.013%(w/w) erythorbyl laurate and 0.987%(w/w) MLE excluding
43
erythorbyl laurate were 75.7 and 65.8% lower than that of the control emulsion after 9 days of storage at 37oC. This result can be explained that the lipid oxidation inhibition effect of MLE derived from erythorbyl laurate and erythorbic acid in MLE excluding erythorbyl laurate. The formation of lipid hydroperoxide was more effectively inhibited by erythorbyl laurate than MLE excluding erythorbyl laurate. This can be explained by the fact that erythorbyl laurate locates at the oil-water interface, where the lipid oxidation usually occurs (Osborn & Akoh, 2004), while erythorbic acid is dispersed in the aqueous phase (Park, Lee, Jo, Choi, Lee, & Chang, 2017). In conclusion, MLE can act as antioxidant inhibiting lipid oxidation in the oil-in-water emulsion- type foods.
44
Lipid hydroperoxide
Incubation time (day)
0 1 2 3 4 5 6 7 8 9 10
Lipid hydroperoxide (mmol/kg oil)
0 10 20 30 40 50
60 0.0% MLE
0.5% MLE 1.0% MLE 2.0% MLE
Fig. 12. Effect of MLE on the formation of lipid hydroperoxides during thermally accelerated oxidation.
45
Lipid hydroperoxide
Incubation time (day)
0 1 2 3 4 5 6 7 8 9 10
Lipid hydroperoxide (mmol/kg oil)
0 10 20 30 40 50
60 0.0% MLE 1.0% MLE
0.013% Erythorbyl laurate
0.987% MLE excluding erythorbyl laurate
Fig. 13. Effect of erythorbyl laurate and MLE excluding erythorbyl laurate on the formation of lipid hydroperoxides during thermally accelerated oxidation.
46
4. Conclusions
In this study, multifunctional MLE with antibacterial and antioxidant activities was produced by the two-step enzymatic synthesis as an alternative to the conventional purification process. In the two-step MLE synthesis, erythorbyl laurate was synthesized in the first reaction, and lauric acid esters of glycerol were synthesized in the second reaction. As a result, MLE composed of erythorbyl laurate, monolaurin, dilaurin, and trilaurin was produced. The addition of MLE into the oil-in-water emulsion with the concentration below 2.0%(w/w) did not affect the emulsion stability. Besides, MLE exhibited the bactericidal effect against Gram-positive bacteria and inhibited lipid oxidation in the oil-in-water emulsion. The results obtained in this study suggest the feasibility of a practical application of MLE to the oil- in-water emulsion-type foods.
47
5. References
Abed, S. M., Wei, W., Ali, A. H., Korma, S. A., Mousa, A. H., Hassan, H. M., Jin, Q., & Wang, X. (2018). Synthesis of structured lipids enriched with medium-chain fatty acids via solvent-free acidolysis of microbial oil catalyzed by Rhizomucor miehei lipase. Lwt-Food Science and Technology, 93, 306-315.
Chand, S., Adlercreutz, P., & Mattiasson, B. (1997). Lipase-catalyzed esterification of ethylene glycol to mono-and diesters. The effect of process parameters on reaction rate and product distribution. Enzyme and Microbial Technology, 20(2), 102-106.
Chen, W., Liang, G., Li, X., He, Z., Zeng, M., Gao, D., Qin, F., Goff, H. D., &
Chen, J. (2019). Impact of soy proteins, hydrolysates and monoglycerides at the oil/water interface in emulsions on interfacial properties and emulsion stability. Colloids and Surfaces B:
Biointerfaces, 177, 550-558.
Cheng, Y., Xiong, Y. L., & Chen, J. (2010). Antioxidant and emulsifying properties of potato protein hydrolysate in soybean oil-in-water emulsions. Food Chemistry, 120(1), 101-108.
48
Demirbas, A. (2008). Comparison of transesterification methods for production of biodiesel from vegetable oils and fats. Energy Conversion and Management, 49(1), 125-130.
Dossat, V., Combes, D., & Marty, A. (2002). Lipase-catalysed transesterification of high oleic sunflower oil. Enzyme and Microbial Technology, 30(1), 90-94.
Enayati, M., Gong, Y., Goddard, J. M., & Abbaspourrad, A. (2018). Synthesis and characterization of lactose fatty acid ester biosurfactants using free and immobilized lipases in organic solvents. Food Chemistry, 266, 508-513.
Erbeldinger, M., Ni, X., & Halling, P. J. (1998). Enzymatic synthesis with mainly undissolved substrates at very high concentrations. Enzyme and Microbial Technology, 23(1-2), 141-148.
Freitas, L., Perez, V. H., Santos, J. C., & Castro, H. F. d. (2007). Enzymatic synthesis of glyceride esters in solvent-free system: Influence of the molar ratio, lipase source and functional activating agent of the support.
Journal of the Brazilian Chemical Society, 18(7), 1360-1366.
Ghamgui, H., Miled, N., Rebaï, A., Karra-chaâbouni, M., & Gargouri, Y.
(2006). Production of mono-olein by immobilized Staphylococcus simulans lipase in a solvent-free system: Optimization by response
49
surface methodology. Enzyme and Microbial Technology, 39(4), 717- 723.
Gustini, L., Noordover, B. A. J., Gehrels, C., Dietz, C., & Koning, C. E. (2015).
Enzymatic synthesis and preliminary evaluation as coating of sorbitol- based, hydroxy-functional polyesters with controlled molecular weights. European Polymer Journal, 67, 459-475.
Hur, S. J., Joo, S. T., Lim, B. O., Decker, E. A., & McClements, J. D. (2011).
Impact of salt and lipid type on in vitro digestion of emulsified lipids.
Food Chemistry, 126(4), 1559-1564.
Jiang, Y., Liu, L., Wang, B., Yang, X., Chen, Z., Zhong, Y., Zhang, L., Mao, Z., Xu, H., & Sui, X. (2019). Polysaccharide-based edible emulsion gel stabilized by regenerated cellulose. Food Hydrocolloids, 91, 232- 237.
Kantekin-Erdogan, M. N., Ketenoglu, O., & Tekin, A. (2019). Effect of monoglyceride content on emulsion stability and rheology of mayonnaise. Journal of Food Science and Technology, 56(1), 443-450.
Kundu, P., Agrawal, A., Mateen, H., & Mishra, I. M. (2013). Stability of oil- in-water macro-emulsion with anionic surfactant: Effect of electrolytes and temperature. Chemical Engineering Science, 102, 176-185.
Lee, G. S., Widjaja, A., & Ju, Y. H. (2006). Enzymatic synthesis of cinnamic
50
acid derivatives. Biotechnology Letters, 28(8), 581-585.
Li, P.-H., & Lu, W.-C. (2016). Effects of storage conditions on the physical stability of D-limonene nanoemulsion. Food Hydrocolloids, 53, 218- 224.
Lieberman, S., Enig, M. G., & Preuss, H. G. (2006). A review of monolaurin and lauric acid: natural virucidal and bactericidal agents. Alternative
& Complementary Therapies, 12(6), 310-314.
Loi, C. C., Eyres, G. T., & Birch, E. J. (2019). Effect of milk protein composition on physicochemical properties, creaming stability and volatile profile of a protein-stabilised oil-in-water emulsion. Food Research International, 120, 83-91.
Loi, C. C., Eyres, G. T., & Birch, E. J. (2019). Effect of mono- and diglycerides on physical properties and stability of a protein-stabilised oil-in-water emulsion. Journal of Food Engineering, 240, 56-64.
Mao, L., Calligaris, S., Barba, L., & Miao, S. (2014). Monoglyceride self- assembled structure in O/W emulsion: Formation, characterization and its effect on emulsion properties. Food Research International, 58, 81- 88.
Masum, A., Chandrapala, J., Adhikari, B., Huppertz, T., & Zisu, B. (2019).
Effect of lactose-to-maltodextrin ratio on emulsion stability and
51
physicochemical properties of spray-dried infant milk formula powders. Journal of Food Engineering, 254, 34-41.
McClements, D. J., & Jafari, S. M. (2018). Improving emulsion formation, stability and performance using mixed emulsifiers: A review. Advances in Colloid and Interface Science, 251, 55-79.
Ni, S., Hu, C., Sun, R., Zhao, G., & Xia, Q. (2017). Nanoemulsions-based delivery systems for encapsulation of quercetin: Preparation, characterization, and cytotoxicity studies. Journal of Food Process Engineering, 40(2), e12374.
Osborn, H. T., & Akoh, C. C. (2004). Effect of emulsifier type, droplet size, and oil concentration on lipid oxidation in structured lipid-based oil- in-water emulsions. Food Chemistry, 84(3), 451-456.
Park, K.-M., Jo, S.-K., Yu, H., Park, J.-Y., Choi, S. J., Lee, C. J., & Chang, P.- S. (2018). Erythorbyl laurate as a potential food additive with multi- functionalities: Antibacterial activity and mode of action. Food Control, 86, 138-145.
Park, K.-M., Lee, D. E., Sung, H., Lee, J., & Chang, P.-S. (2011). Lipase- catalysed synthesis of erythorbyl laurate in acetonitrile. Food Chemistry, 129(1), 59-63.
Park, K.-M., Lee, M. J., Jo, S.-K., Choi, S. J., Lee, J., & Chang, P.-S. (2017).