저작자표시-비영리-변경금지 2.0 대한민국 이용자는 아래의 조건을 따르는 경우에 한하여 자유롭게
l 이 저작물을 복제, 배포, 전송, 전시, 공연 및 방송할 수 있습니다. 다음과 같은 조건을 따라야 합니다:
l 귀하는, 이 저작물의 재이용이나 배포의 경우, 이 저작물에 적용된 이용허락조건 을 명확하게 나타내어야 합니다.
l 저작권자로부터 별도의 허가를 받으면 이러한 조건들은 적용되지 않습니다.
저작권법에 따른 이용자의 권리는 위의 내용에 의하여 영향을 받지 않습니다. 이것은 이용허락규약(Legal Code)을 이해하기 쉽게 요약한 것입니다.
Disclaimer
저작자표시. 귀하는 원저작자를 표시하여야 합니다.
비영리. 귀하는 이 저작물을 영리 목적으로 이용할 수 없습니다.
변경금지. 귀하는 이 저작물을 개작, 변형 또는 가공할 수 없습니다.
수의학박사 학위논문
Gut microbiota analysis in animals and its application to bacterial identification
동물에서의 장내 미생물 군집 분석 및 미생물 탐색에 대한 활용
2020 년 2 월
서울대학교 대학원
수의학과 수의병인생물학 및 예방수의학 전공
김 준 형
Gut microbiota analysis in animals and its application to bacterial identification
By
Junhyung Kim
Supervisor: Seongbeom Cho, D.V.M., Ph. D.
Dissertation
Submitted to the faculty of the Graduate School of Seoul National University in partial fulfillment of the requirements
for the Degree of Doctor of Philosophy February, 2020
Department of Veterinary Medicine The Graduate School
Seoul National University
Gut microbiota analysis in animals and its application to bacterial identification
지도교수 조 성 범
이 논문을 수의학박사 학위논문으로 제출함
2019 년 10 월
서울대학교 대학원
수의학과 수의병인생물학 및 예방수의학 전공
김 준 형
김준형의 수의학박사 학위논문을 인준함
2019 년 12 월
위 원 장 유 한 상 (인)
부위원장 조 성 범 (인)
위 원 권 혁 준 (인)
위 원 연 성 찬 (인)
위 원 윤 장 원 (인)
i
Abstract
Gut microbiota analysis in animals and its application to bacterial identification
Junhyung Kim
(Supervisor: Seongbeom Cho, D.V.M., Ph. D.)
Department of Veterinary Medicine The Graduate School
Seoul National University
Recent advances in next-generation sequencing (NGS) technologies have enabled comprehensive analysis of the gut microbiota, which is the collection of living microorganisms inhabiting the gastrointestinal tract of the host. Particularly, in humans, the human microbiome project called the second
ii
human genome project has been launched worldwide. Consequently, it has been revealed that the gut microbiota is closely linked with the health and disease status of hosts. The gut microbiota could be affected by multifactorial factors, among which environmental factors have been found to have a great effect.
However, these studies have mainly been focused on humans, with animal studies lagging behind. Furthermore, NGS-based gut microbiota analysis could be used in other microbiological studies such as pathogen identification in the public health field. Traditionally, detection of pathogens has been performed using culture-dependent tools, but most gut microbes are difficult to cultivate under laboratory conditions. However, metagenomics, a culture-independent tool, enables identification of microbes that cannot be detected through conventional culture-based approaches. Therefore, this study aimed to analyze and compare the gut microbiota of animals according to different environmental conditions and to apply gut microbiota analysis to bacterial identification.
Firstly, pronounced differences in the gut microbiota of dogs (Canis lupus familiaris) according to diet type, natural diet and commercial feed, were observed. Specifically, dogs fed a natural diet have more diverse and abundant microbiota than dogs fed a commercial feed, but the potential risk of opportunistic infection could be higher. Secondly, changes in the gut microbiota of wild mice (Mus musculus) according to the environment, particularly habitat and diet, were observed. The gut microbiota of wild mice exposed to various
iii
external conditions, natural environments, was characterized by high richness and diversity. However, as they adapted to constant conditions, laboratory animal facilities, the gut microbial diversity gradually decreased and distribution of the gut microbiota became constant. Thirdly, through the application of metagenomics tools, the most effective method for isolating Campylobacter jejuni from chicken feces, a high-level microbial matrix, was found. Changes in the microbial community during the C. jejuni isolation procedure, which cannot be detected using previous culture-based analysis, were revealed. Particularly, the appropriate type and ratio of antibiotics effectively enriched C. jejuni, and controlled competing flora (extended- spectrum beta-lactamase-producing E. coli and Proteus mirabilis) during the microbe isolation procedure. Lastly, through the application of metagenomic tools, it was shown that wild mice (Micromys minutus) are a potential reservoir of C. jejuni. Regardless of culture-based isolation results, C. jejuni was present in high proportions in the gut of Micromys minutus, the new host, which had not been reported yet.
This study suggests that the gut microbiota of animals is significantly influenced by environmental factors, particularly diet type and habitat.
Additionally, it suggests the possibility of applying a metagenomics approach to the evaluation of bacterial isolation methods and the identification of fastidious bacteria. Differences in the gut microbiota of animals in different conditions identified through this study could be the basis for further studies on
iv
animal gut microbiota. Particularly, this study, along with subsequent studies, could be used to devise appropriate external conditions for animals, which can ultimately help improve animal health or achieve accurate results in animal experiments. Furthermore, this study provides new perspectives and possibilities for the application of metagenomics in microbiological research field, such as improving diagnostic methods for fastidious microbes that are difficult to isolate.
Keywords: Gut microbiota, Metagenomics, Dogs, Wild mice, Chicken, Campylobacter jejuni
Student Number: 2015-21815
v
Contents
Abstract ··· ⅰ
Contents ··· v
List of figures ··· vⅰⅰⅰ List of tables ··· xiⅰ List of abbreviations ··· xiv
General introduction ··· 1
Literature review ··· 4
1. Gut microbiota ··· 4
A. Microbes in the gastrointestinal tract ··· 4
B. Gut microbiota related factors ··· 8
C. The relationship between gut microbiota and disease ··· 13
2. Microbial community analysis ··· 17
A. Next generation sequencing technology ··· 17
B. Taxonomic profiling ··· 21
C. Microbial diversity ··· 23
3. Application of metagenomics to bacterial identification ··· 24
vi
Chapter I. Differences in the gut microbiota of dogs (Canis lupus familiaris) fed a natural diet or a commercial feed
Abstract ··· 28
1.1. Introduction ··· 30
1.2. Materials and Methods ··· 34
1.3. Results ··· 39
1.4. Discussion ··· 43
1.5. Conclusions ··· 49
Chapter II. Changes in the gut microbiota of wild mice (Mus musculus) according to environment; habitat and diet Abstract ··· 67
2.1. Introduction ··· 69
2.2. Materials and Methods ··· 71
2.3. Results ··· 74
2.4. Discussion ··· 78
2.5. Conclusions ··· 82
Chapter III. Metagenomic analysis of isolation methods of a targeted microbe, Campylobacter jejuni, from chicken feces with high microbial contamination Abstract ··· 97
vii
3.1. Introduction ··· 99
3.2. Materials and Methods ··· 103
3.3. Results ··· 109
3.4. Discussion ··· 119
3.5. Conclusions ··· 128
Chapter IV. The wild mouse (Micromys minutus): reservoir of a novel Campylobacter jejuni strain Abstract ··· 159
4.1. Introduction ··· 161
4.2. Materials and Methods ··· 164
4.3. Results ··· 171
4.4. Discussion ··· 179
4.5. Conclusions ··· 187
General conclusions ··· 212
References ··· 214
국문 초록 ··· 239
viii
List of figures
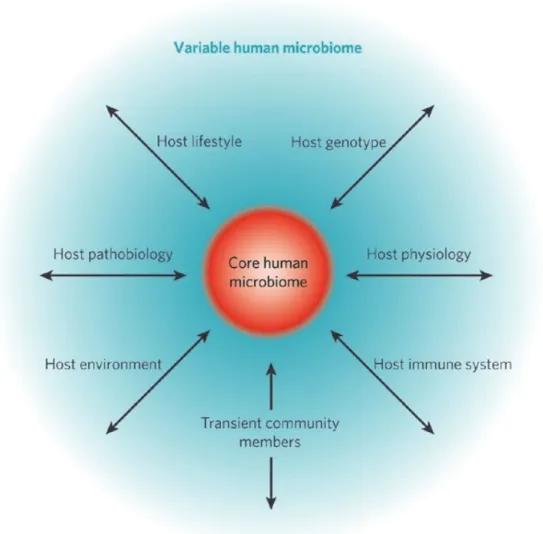
Figure 1. The concept of a core human microbiome.
Figure 2. Clustering of gut microbial taxa into entero-types is associated with long-term diet.
Figure 3. Gut microorganisms at the intersection of several diseases.
Figure 4. Template immobilization strategies.
Figure 5. General overview of the bioinformatic pipelines for the 16SrRNA gene microbial profiling and shotgun metagenomics.
Figure 6. Rarefaction curves for gut microbial communities in 11 dogs.
Figure 7. Box plots of the alpha diversity indices in the two diet groups.
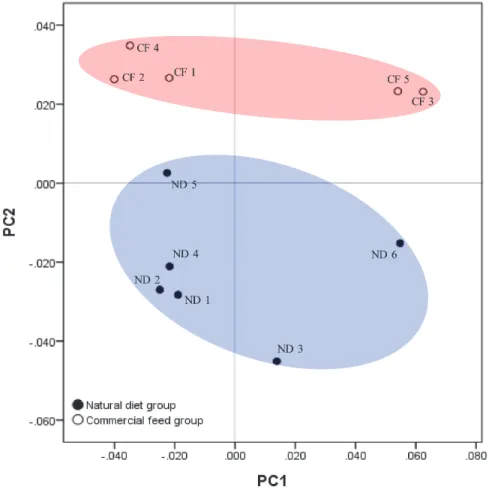
Figure 8. Principal component analysis (PCA) plot of the two diet groups.
Figure 9. Differences in the taxonomic composition of core gut microbiota in the two diet groups.
Figure 10. Alpha diversity in the gut microbiota of wild mice according to the adaptation to laboratory animal facilities.
Figure 11. Principal coordinates analysis (PCoA) plot of gut microbiota in wild mice according to the adaptation to laboratory animal facilities.
ix
Figure 12. The volatility of beta diversity in the gut microbiota of wild mice.
Figure 13. Taxonomic composition of the core gut microbiota of wild mice.
Figure 14. The relative abundance of the core microbiota of wild mice according to the adaptation to laboratory animal facilities.
Figure 15. A schematic diagram of the isolation method of C. jejuni.
Figure 16. Proportion of competing microbes according to isolation procedures of C. jejuni based on culture-dependent tools.
Figure 17. Evaluating the effect of competing flora on the isolation of C.
jejuni using culture-dependent tools.
Figure 18. Alpha diversity of each seven enrichment procedures using metagenomics tools.
Figure 19. Similarity of the microbial community of fecal samples in each procedure.
Figure 20. Microbial community of fecal samples in each procedure at the genus level.
Figure 21. Bacterial taxa that are differentially abundant in microbial community of fecal samples in each procedure.
Figure 22. Relationship between microorganisms in microbial community of fecal samples.
x
Figure 23. The relative abundance of each microbe according to the isolation results of C. jejuni.
Figure 24. The correlation between colony forming units and cycle threshold (Ct) values of C. jejuni standard strains (NCTC 11168 and ATCC 33560).
Figure 25. Quantitative PCR of C. jejuni applied to all 54 samples.
Figure 26. Information regarding the habitat of wild mice, Mus musculus and Micromys minutus.
Figure 27. Characteristics of Campylobacter jejuni isolates from Micromys minutus.
Figure 28. Complete genome sequence and functional profile of Micromys minutus-derived C. jejuni (str. SCJK2).
Figure 29. MLST results showing the genetic relatedness between C. jejuni derived from Micromys minutus and those derived from other sources.
Figure 30. Comparative-genomic analysis of Micromys minutus-derived C.
jejuni sequences (strain SCJK2) with 174 other C. jejuni sequences.
Figure 31. Principal coordinates analysis (PCoA) plot of the each wild mouse species (Mus musculus and Micromys minutus).
xi
Figure 32. Taxonomic composition of each wild mouse species (Mus musculus and Micromys minutus).
Figure 33. Relative abundance of Campylobacter in each wild mouse species (Mus musculus and Micromys minutus).
xii
List of tables
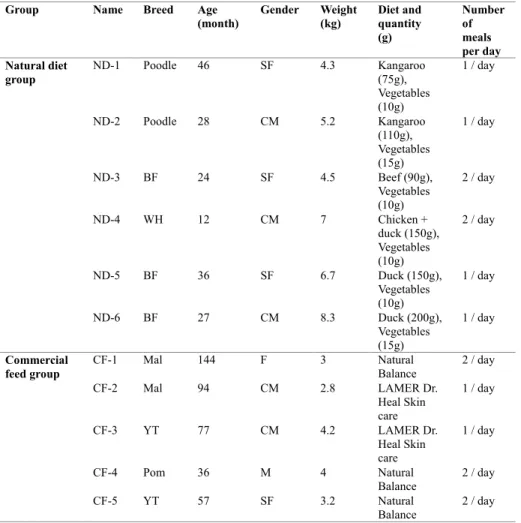
Table 1. Information on the dogs enrolled in this study.
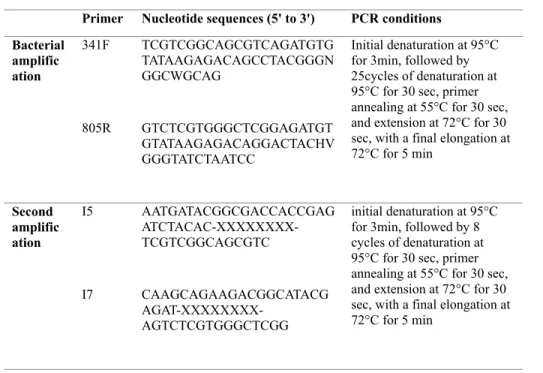
Table 2. PCR amplification conditions and primer sequence for bacterial DNA amplification.
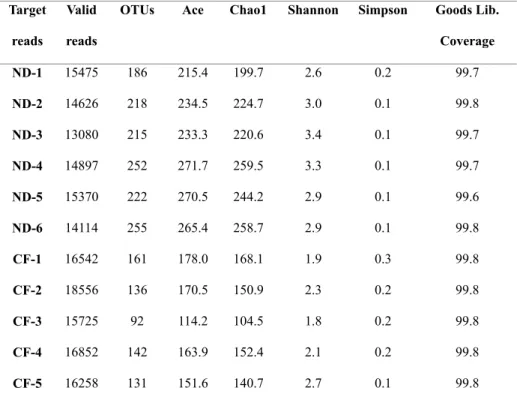
Table 3. The raw data of diversity indices for all samples.
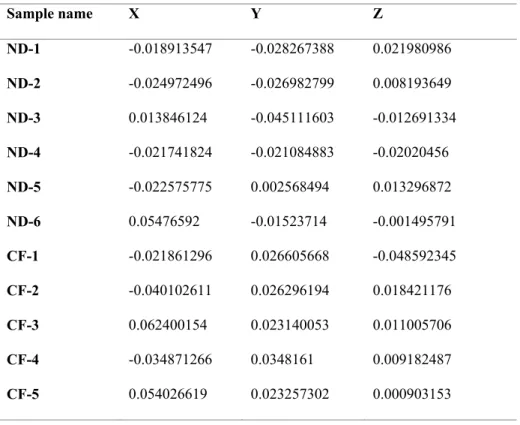
Table 4. The raw data of PCO vectors for all samples.
Table 5. The core gut microbiota of dogs fed a natural diet or a commercial feed, at phylum, family, and species level.
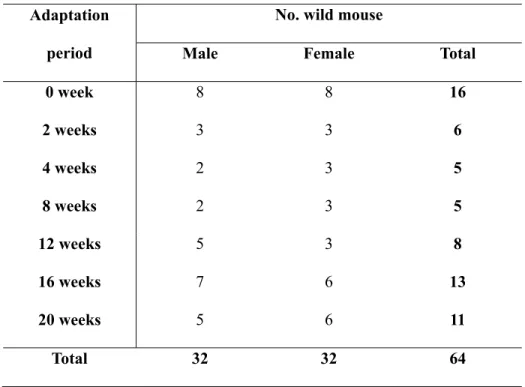
Table 6. Information of wild mice in this study.
Table 7. Information of samples and isolation results of C. jejuni.
Table 8. Primer list for polymerase chain reaction (PCR), quantitative PCR, and bacterial DNA amplification in this study.
Table 9. Culture-dependent isolation results of Campylobacter jejuni and competing microbes in each procedures.
Table 10. Primer list for polymerase chain (PCR) reaction in this study.
Table 11. The 174 complete genome sequences of C. jejuni obtained from the NCBI database used for comparative genomic analysis.
xiii
Table 12. The 19 genome sequences of C. jejuni obtained from the NCBI genome database used for comparative genomic analysis.
Table 13. Prevalence of Campylobacter jejuni by wild mouse species.
Table 14. Genomic features of Micromys minutus-derived C. jejuni.
xiv
List of abbreviations
ANOSIM Analysis of similarities ASV Amplicon sequence variants
CARD Comprehensive antibiotic resistance database CD-HIT Cluster database at high identity with tolerance CFU Colony forming units
COG Clusters of Orthologous Group
Ct Cycle threshold
ESBL Eextended-spectrum beta-lactamase
GI Gastrointestinal
GPS The global positioning system IBD Inflammatory bowel disease
LEfSe Linear discriminant analysis effect size
mCCDA Modified charcoal-cefoperazone-deoxycholate agar MHA Müller-Hinton agar
MIC Minimum inhibitory concentration MLST Multilocus sequence typing
xv NGS Next-generation sequencing
ortho ANI Orthologous average nucleotide identity OTUs Operational taxonomic units
PCA Principal component analysis PCoA Principal coordinate analysis PCR Polymerase chain reaction
PERMANOVA Permutational multivariate analysis POGs Pan-genome orthologous groups qPCR Quantitative PCR
r Pearson correlation coefficient
STs Sequence types
UPGMA Unweighted pair group method with an arithmetic mean VBNC Viable but nonculturable
VFDB Virulence factors of pathogenic bacteria database
1
General introduction
Studies on the gut microbiota, which are closely related to the health status of host, were mainly focused on humans (Frank et al., 2007; David et al., 2014; Zhang et al., 2015). Although animal health is intricately linked to human health based on the ‘One Health’ perspective and animals could be used as comparative models for humans, studies on the animal gut microbiota lags behind human studies. Among them, dog (Canis lupus familiaris) is one of the closest companion animals to humans, and people have been treating their dogs as family members rather than pets and focusing on their health (Barker and Wolen, 2008). However, studies on dog gut microbiota have not matched the increase in the number of pet owners and their increased interest in dog health.
Mice are the most popular species in animal experiments worldwide because of their small size, ease of handling, short gestation period, low maintenance costs, and 99% gene sharing with humans (Willis-Owen and Flint, 2006; Rosenthal and Brown, 2007). Although most studies are mainly conducted on laboratory mice, wild mice Mus musculus are frequently used as animal models in population and evolutionary biology (Kreisinger et al., 2014). However, studies on the gut microbiota have not been conducted in wild mice compared with laboratory mice.
Most microbiota-related studies have been conducted on the gut microbiota, which is closely related to host health, though microbiota analysis could be used in other microbiological research fields. Particularly, this could
2
be applied to the identification of fastidious bacteria. Traditionally, in public health fields, the identification of pathogens is performed based on culture- dependent methods. However, these methods could not identify causative pathogens in about 40% of gastroenteritis (Finkbeiner et al., 2008). Particularly, Campylobacter jejuni, which is one of the most common zoonotic pathogens worldwide, is difficult to isolate because of its specific growth conditions (Silva et al., 2011; Adzitey et al., 2012). However, the application of metagenomics, which is a culture-independent tool, could overcome the limitation of traditional culture-dependent tools, by allowing the rapid detection of Campylobacter. Furthermore, this could improve the isolation method of C.
jejuni by evaluating changes in microbial communities during the isolation procedures.
Therefore, this study was conducted to analyze the gut microbiota in animals according to different environmental conditions, and to apply microbiota analysis to bacterial identification, particularly C. jejuni.
Specifically, (1) differences in the gut microbiota of dogs (Canis lupus familiaris) according to diet type, i.e., natural diet and commercial feed and (2) changes in the gut microbiota of wild mice (Mus musculus) according to the environment, particularly habitat and diet, was investigated. Then, microbiota analysis was applied (3) to evaluate and optimize the isolation method of C.
jejuni from chicken feces according to the different antibiotic types and concentrations in the process of isolation and (4) to determine whether wild
3
mice (Micromys minutus) is a reservoir of C. jejuni.
4
Literature review
1. Gut microbiota
A. Microbes in the gastrointestinal tract
The gut microbiota is the collection of living microorganisms inhabiting the gastrointestinal (GI) tract of the host. The gut is the largest habitat for microbes compared to other body sites of the host, including skin, oral cavity, airways, and vagina. The gut microbiota perform important homeostatic functions, including metabolism, de-conjugation of bile acids, prevention of colonization of pathogens, and immune effect, through interactions with the host in the body (Quigley, 2013). Although the two terms, microbiota and microbiome, are often used interchangeably, the microbial taxa associated with the host’s body is defined as microbiota and the catalog of genes is defined as microbiome (Ursell et al., 2012). The gut microbiota vary widely among different individuals, but most of them share a core microbiota, which remains fairly constant (Turnbaugh et al., 2007). Particularly, Firmicutes, Bacteroidetes, Actinobacteria, and Proteobacteria are the predominant phyla in the gut of most vertebrates (Khanna and Tosh, 2014). However, it is known that the gut microbiota is affected by multifactorial factors, particularly genetic and environmental factors, including genotype, physiological state, health/disease state, lifestyle, and environment (Figure 1) (Turnbaugh et al., 2007).
5
Studies on the gut microbiota were mainly focused on humans. Particularly, in humans, the human microbiome project called the second human genome project has been launched worldwide. As a result, the core microbiota of the skin, oral cavity, airways, vagina, and gut have been reported, and factors affecting the microbiota and the relationship between the microbiota and diseases have been revealed (Turnbaugh et al., 2007; Lee and Mazmanian, 2010). However, studies on animals, particularly production and companion animals, are lagging behind human studies. In animals, most of the studies have been conducted to define the core gut microbiota (Ikeda-Ohtsubo et al., 2018).
Particularly, studies on industrial animals such as cattle, pigs, and chickens have been conducted to improve the productivity (Hanning and Diaz-Sanchez, 2015);
studies on companion animals, such as dogs and cats, have mostly been conducted to improve animal health (Handl et al., 2011; Deng and Swanson, 2015; Schmitz and Suchodolski, 2016).
6
Figure 1. The concept of a core human microbiome.
The core human microbiome (red) is the set of genes present in a given habitat in all or the vast majority of humans. The variable human microbiome (blue) is the set of genes present in a given habitat in a smaller subset of humans.
This variation could result from a combination of factors such as host
genotype, host physiological status (including the properties of the innate and
7
adaptive immune systems), host pathobiology (disease status), host lifestyle (including diet), host environment (at home and/or work) and the presence of transient populations of microorganisms that cannot persistently colonize a habitat.
Adapted from Turnbaugh et al., 2007.
8
B. Gut microbiota related factors
Recent studies have shown that environmental factors such as diet, host environment, and usage of antibiotics have a greater impact on the gut microbiota than genetic factors (Benson et al., 2010). The gut microbiota has been shown to change with the life span of the host. In general, the gastrointestinal tract of the normal fetus is a sterile environment in which microbial communities are not formed (Perez-Muñoz et al., 2017). Immediately after birth, microbes present in the mother or environment colonize the gut of infants, forming the gut microbial communities. Particularly, the gut microbial diversity in infants is lower than that in adults, and due to the influence of breast milk; Bifidobacteria is the predominant genus in the infant gut microbiota (Mueller et al., 2015). Subsequently, as the infant grows, the gut microbiota also matures, becoming similar to that of an adult after about 2–3 years (Sommer and Bäckhed, 2013). In these processes, the conditions of birth (mode of delivery or type of lactation), diet pattern, mother’s age and health, lifestyle, and genetic factors have been reported to affect the formation of the gut microbiota (Milani et al., 2017). It has been found that the gut microbiota of infants is not only related to the health status at infancy but also to the health status at adulthood. Furthermore, this could affect the development and physiology of the host, such as organ development and morphogenesis (Sommer and Bäckhed, 2013).
9
Recent studies have suggested that among such diverse factors, diet greatly influences the gut microbiota. Particularly, the human gut microbiota has been divided into a Prevotella enterotype (protein and animal fat) and a Bacteroides enterotype (carbohydrates), according to long-term diet (Figure 2) (Wu et al., 2011). Furthermore, according to short-term diet, animal-based diets might cause an increase in the abundance of Alistipes, Bilophila, and Bacteroides at the genus level, and a decrease in the abundance of Firmicutes at the phylum level in the gut microbiota of vertebrates (David et al., 2014). Conversely, vegetable-based diet cause an increase in the abundance of Prevotella and is associated with the overall gut microbial diversity (Jeffery and O'Toole, 2013).
These results indicate that changes in short-term or long-term dietary patterns affect the gut microbiota, including diversity and taxonomic composition.
The gut microbiota is involved in the metabolism of various drugs. Some microbes in the gut secrete enzymes, which have a significant effect on drug stability (Sousa et al., 2008). Conversely, the use of drugs, also affects the gut microbiota. Particularly, antibiotics could rapidly change the taxonomic composition through the selection of resistant pathogens (Francino, 2016).
However, in these processes, antibiotics could also cause microbial imbalance by decreasing the microbial diversity; in the case of ciprofloxacin, this antibiotic decreased the gut microbial richness, diversity, and evenness (Dethlefsen et al., 2008). These microbial dysbiosis could reduce the carbohydrate fermentation capacity and metabolism of bile acids, which affect
10
the health and food digestibility of the host. Without the use of antibiotics, the gut microbiota could be recovered, but these changes could be maintained even after a long period. Furthermore, long-term use of antibiotics rather decrease the resistance to pathogen colonization, and pathogens such as Clostridium difficile could cause diarrhea (Theriot et al., 2014).
11
12
Figure 2. Clustering of gut microbial taxa into entero-types is associated with long-term diet.
(A) Clustering in the COMBO cross-sectional study using Jensen-Shannon distance. The left panel shows that the data are most naturally separated into two clusters by the PAM method. The x axis shows cluster number; the y axis shows silhouette width, a measure of cluster separation. The right panel shows the clustering on the first two principal components. (B) Proportions of bacterial taxa characteristic of each enterotype. Boxes represent the interquartile range (IQR) and the line inside represents the median. Whiskers denote the lowest and highest values within 1.5 × IQR. (C) The association of dietary components with each enterotype. The strength and direction of each association, as measured by the means of the standardized nutrient measurements, is shown by the color key at the lower right. Enterotype is shown at the right. Red indicates greater amounts, blue lesser amounts of each nutrient in each enterotype. Columns were clustered by Euclidean distance.
Adapted from Wu et al., 2011.
13
C. The relationship between gut microbiota and disease
It was revealed that the gut microbiota is closely linked with the health and disease status of hosts, including the maintenance of the GI health, stimulation of the immune system, development of obesity, and various GI disorders, including inflammatory bowel disease (Figure 3) (Frank et al., 2007; Zhang et al., 2015).
The development of obesity is caused by both genetic and environmental factors. The gut microbiota plays a key role in the digestive process by fermenting carbohydrates that the host cannot digest and are associated with the development of obesity. In particular, the gut microbiota modulate energy harvesting from the diet, energy storage as triglycerides, and energy consumption through fatty acid oxidation (Musso et al., 2010). In humans, decrease in the microbial diversity could cause obesity, and low composition of Bacteroidetes and high composition of Actinobacteria or Firmicutes are also highly associated with obesity (Turnbaugh et al., 2009). The same results were shown in animal models using leptin-deficient ob /ob mice (Ley et al., 2005).
Fecal transplant experiments from obese/lean mice to germ-free mice clearly demonstrated that the gut microbiota was the cause, not the result of obesity (Turnbaugh et al., 2008).
14
Inflammatory bowel disease (Crohn's disease and ulcerative colitis), which is affected by genetics, microbial, and environmental factors, is a chronic disease that affects millions of people worldwide (Loftus Jr, 2004). Recent studies have linked the development of inflammatory bowel disease (IBD) to changes in the gut microbiota. As a result, it was found that Crohn's disease and ulcerative colitis are clearly related to the dysbiosis of the gut microbiota, such as decrease in microbial diversity, which could disrupt immune homeostasis (Miyoshi and Chang, 2017). In addition, changes in taxonomic composition have been shown to affect the development of IBD; decrease in Bacteroides, Firmicutes, Clostridia, Ruminococcaceae, Bifidobacterium, and Lactobacillus and increase in Gammaproteobacteria (Kostic et al., 2014). Therefore, the gut microbiota plays an important role in the treatment of IBD. In the treatment of this disease, it is more effective to reconstruct a healthy gut microbial community through probiotic administration or fecal microbiota transplantation than to use antibiotics that is effective for inhibiting pathogens, but could cause imbalances in the gut microbiota (Loftus Jr, 2004).
Allergies, caused by genetic and environmental factors, are various conditions with hypersensitivity of the immune system to harmless substances.
These diseases have been shown to be associated with early infant gut microbiota, which could affect the maturation of the immune system (Sjögren et al., 2009). In particular, the low microbial diversity and taxonomic composition of Lactobacilli, Bifidobacterium, and Clostridium difficile are
15
associated with the development of allergies (Sakata et al., 2005; Sjögren et al., 2009). Allergies can be prevented by exposure to various microbes during fetal or infant periods, which are important for the formation of an early gut microbiota (Abrahamsson et al., 2015). In addition, studies have been conducted to investigate the relationship between the gut microbiota and neurological diseases (chronic neurodegenerative and autoimmune conditions), cardiovascular diseases, liver diseases, and cancer (Shreiner et al., 2015; Cani, 2017; Tremlett et al., 2017).
16
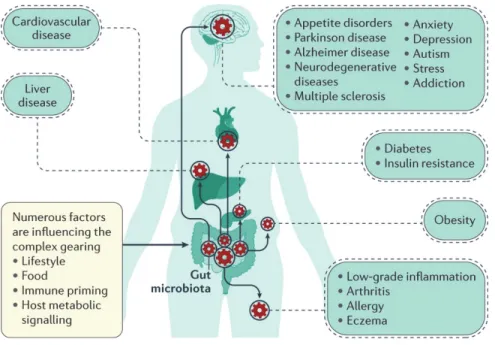
Figure 3. Gut microorganisms at the intersection of several diseases.
Gut microbiota composition and activity are under the influence of numerous factors (e.g. lifestyle and host metabolic activities). In numerous studies, the gut microbiota were found to be affected in a vast number of pathological situations.
Adapted from Cani, 2017.
17
2. Microbial community analysis
A. Next generation sequencing technology
In the past, studies on microbial communities were conducted using culture-based methods, and research in the field was limited. However, recent advances in next-generation high-throughput DNA sequencing techniques (NGS) have allowed a more comprehensive analysis of complex and diverse microbial communities (Kwong et al., 2015). NGS is a technology that sequences millions of DNA fragments in parallel in one reaction, and is different from Sanger sequencing, which sequences one DNA fragment (up to about 700 base pairs) based on chain-termination (Bunnik and Le Roch, 2013).
Since the Roche 454 pyrosequencing became commercial in 2005, various NGS systems, such as Illumina Genome Analyzer (HiSeq, MiSeq), Applied Biosystems SOLiD System, Life Technologies Ion Torrent, ONT MinION/
GridION, and the PacBio RSII/Sequel, have been available in microbiological research fields (Quail et al., 2012; Mardis, 2017). There are different sequence strategies according to the type of sequencer, but in most cases the sequence proceeds as follows (Metzker, 2010; Bunnik and Le Roch, 2013; Mardis, 2017):
1) the DNA libraries are clonally amplified; 2) the DNA is sequenced by synthesis to be determined by adding nucleotides to the complementary strands;
3) DNA templates are sequenced in a massively parallel fashion (Figure 4).
Among the various NGS systems, the Illumina MiSeq platform generates long
18
and high-quality sequence reads, with the lowest error rates. Furthermore, it is also the most cost-effective platform, and hence suitable for small investigations (Caporaso et al., 2012; Kozich et al., 2013; Salipante et al., 2014;
Derakhshani et al., 2016).
19 Figure 4. Template immobilization strategies.
In emulsion PCR (emPCR) (a), a reaction mixture consisting of an oil–aqueous emulsion is created to encapsulate bead–DNA complexes into single aqueous droplets. PCR amplification is performed within these droplets to create beads containing several thousand copies of the same template sequence. EmPCR beads can be chemically attached to a glass slide or deposited into PicoTiterPlate wells. Solid-phase amplification (b) is composed of two basic steps: initial priming and extending of the single-stranded, single-molecule
20
template, and bridge amplification of the immobilized template with immediately adjacent primers to form clusters. Three approaches are shown for immobilizing single-molecule templates to a solid support: immobilization by a primer (c); immobilization by a template (d); and immobilization of a polymerase (e). dNTP, 2′-deoxyribonucleoside triphosphate.
Adapted from Metzker, 2010.
21
B. Taxonomic profiling
Microbiota analysis applies 16S rRNA gene-based microbial profiling using universal primers to amplify hypervariable regions of the 16S rRNA gene during this sequencing process (Hamady and Knight, 2009). Nine hypervariable regions, including the V1-V9 regions, are present in the 16S rRNA gene, and there is no standard approach for selecting the most suitable region for equally amplifying parts of a gene (Milani et al., 2017). While the V3-V4 and V4-V5 regions are expected to provide the highest classification accuracy, most studies select variable regions depending on historical use or published protocols (Claesson et al., 2010; Cao et al., 2017).
Bioinformatics analysis is then performed using bioinformatics pipelines such as QIIME2 (Caporaso et al., 2010) or Mothur (Schloss et al., 2009).
Specifically, obtained raw sequence reads are filtered, de-replicated, and de- noised (Callahan et al., 2016). Then, amplicon sequence variants (ASV) or operational taxonomic units (OTUs) are determined. Taxonomy assignments are conducted using databases such as SILVA, RDP, and Greengenes (Figure 5) (Quast et al., 2012).
22
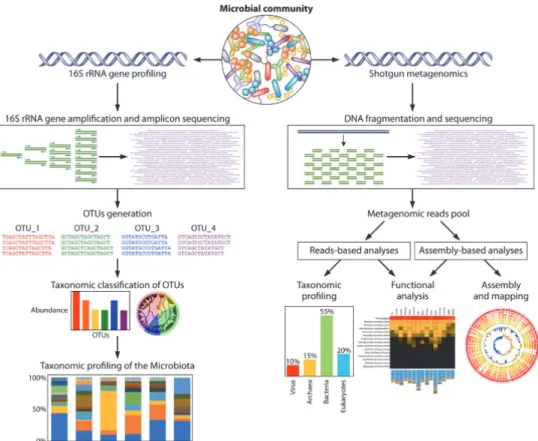
Figure 5. General overview of the bioinformatic pipelines for the 16S rRNA gene microbial profiling and shotgun metagenomics.
Starting from DNA extraction of a microbial community and subsequent sequencing, the pipeline generates taxonomic profiling of the microbiota and the reconstruction of microbial genomes with corresponding functional analyses of the genes.
Adapted from Milani et al., 2017
23
C. Microbial diversity
Alpha diversity in a microbial community means the diversity of microbes within the sample, particularly one host, and is determined using the richness and evenness (Whittaker, 1972). According to the pipeline used for bioinformatics analysis, the number of sequence variants ASVs or the number of sequence clusters OTUs are the basis for alpha diversity. The microbial richness, a measure of the total number of species in the microbial community, is calculated using Faith’s phylogenetic diversity, Chao 1 richness, and Ace richness index (Faith, 1992). The microbial evenness, a measure of how evenly individual species are distributed in a microbial community, is calculated using the Shannon’s and Simpson’s index (Shannon, 2001; Spellerberg and Fedor, 2003).
Beta diversity in a microbial community means how microbial composition differs from one host to another, and is determined by the diversity of microbiota between samples (Whittaker, 1960). This allows the distribution of microbial communities between samples to be determined. The measures used for beta diversity include Bray-Curtis dissimilarity and weighted UniFrac based on relative abundances in the microbial community, and Jaccard distance and unweighted UniFrac based on the presence/absence of species and sequence distances (Lozupone and Knight, 2005; Somerfield, 2008).
24
3.
Application of metagenomics to bacterial identification
NGS-based microbiota analysis, metagenomics, could be applied to the identification of pathogens in the public health field. This enables the simultaneous detection of all microbes in clinical samples without prior knowledge of the disease (Kwong et al., 2015). Furthermore, thiscould improve the isolation method of bacteria by evaluating changes in microbial communities during isolation procedures.
Traditionally, in epidemic surveillance, the detection of pathogens is performed using culture-based or immune-based methods. However, these methods could not detect causative pathogens in about 40% of gastroenteritis (Finkbeiner et al., 2008). Particularly, most gut microbes are highly resistant to cultivation under standard laboratory conditions (Tringe et al., 2005). It was estimated that about 20–60% of the gut microbes in vertebrates could not be cultivated (Pei et al., 2004; Bik et al., 2006; Peterson et al., 2009). It is difficult and laborious to isolate the gut microbes because most of them areobligate anaerobic and easily die from short-term air exposure (Flint et al., 2007).
Furthermore, among the microbes suitable for cultivation, some microbes, particularly Campylobacter jejuni, are difficult to isolate, resulting in differences in prevalence of pathogen infections among researchers (Silva et al., 2011; Adzitey et al., 2012).
25
C. jejuni is one of the most common zoonotic pathogens worldwide, and human infections with this pathogen have increased in both developing and developed countries (Kaakoush et al., 2015). It is a commensal organism that naturally colonizes and is asymptomatic in the gastrointestinal tract of poultry, particularly chickens; C. jejuni is a major cause of human campylobacteriosis (Dearlove et al., 2016; Skarp et al., 2016). In particular, C. jejuni directly causes gastrointestinal diseases such as diarrhea and abdominal pain, and it can also lead to late complications such as neurological diseases, including Guillain- Barre and Miller-Fisher syndromes in humans (Nachamkin et al., 1998; Ang et al., 2001). The main sources of C. jejuni transmission in humans are livestock, including poultry and cattle (Bronowski et al., 2014). In addition, environmental sources (Gras et al., 2012) and wildlife species (Waldenström et al., 2007) are also sources of C. jejuni infections in humans. Therefore, humans, livestock, environmental sources, and wildlife form complex interactions that contribute to C. jejuni infection and constitute a transmission cycle.
The most common methods for isolating C. jejuni are pre-enrichment (4–5 h, microaerophilic conditions, 37 °C) and enrichment (48 h, microaerophilic conditions, 42 °C) procedures in Bolton broth or Preston broth, followed by selection (48 h, microaerophilic conditions, 42 °C) on modified charcoal- cefoperazone-deoxycholate agar (mCCDA) or Preston agar. However, C. jejuni is difficult to isolate because of its specific growth conditions (i.e., requires a microaerophilic environment) (Ugarte‐Ruiz et al., 2012). The presence of
26
viable but nonculturable (VBNC) C. jejuni and the tendency of C. jejuni to be masked by competing microbes make it challenging to isolate C. jejuni from the gut of vertebrates (Chon et al., 2014; Gu et al., 2018). Therefore, culture- independent diagnostic tests based on detection of specific antigens or DNA markers, which show high sensitivity and rapid diagnosis, were recently applied to detect Campylobacter-infections in humans, particularly by the Centers for Disease Control and Prevention and the Foodborne Diseases Active Surveillance Network (Huang, 2016; Gu et al., 2018).
27
Chapter I.
Differences in the gut microbiota of dogs (Canis lupus familiaris) fed a natural diet or a
commercial feed
28
Abstract
Background: Recent advances in next-generation sequencing technologies have enabled comprehensive analysis of the gut microbiota, which is closely linked to the health of the host. Consequently, several studies have explored the factors affecting gut microbiota composition. In recent years, increasing number of dog owners are feeding their pets a natural diet i.e., one consisting of bones, raw meat (such as chicken and beef), and vegetables, instead of commercial feed. However, the effect of these diets on the microbiota of dogs (Canis lupus familiaris) is unclear.
Methods and Results: Six dogs fed a natural diet and five dogs fed a commercial feed were selected; dog fecal metagenomic DNA samples were analyzed using the Illumina MiSeq platform. Pronounced differences in alpha and beta diversities, and taxonomic composition of the core gut microbiota were observed between the two groups. According to alpha diversity, the number of operational taxonomic units, the richness estimates, and diversity indices of microbiota were significantly higher (p < 0.05) in the natural diet group than in the commercial feed group. Based on beta diversity, most samples clustered together according to the diet type (p = 0.004). Additionally, the core microbiota between the two groups was different at the phylum, family, and species levels. Marked differences in the taxonomic composition of the core microbiota of the two groups were observed at the species level; Clostridium
29
perfringens (p = 0.017) and Fusobacterium varium (p = 0.030) were more abundant in the natural diet group.
Conclusions: The gut microbiota of dogs is significantly influenced by diet type (i.e., natural diet and commercial feed). Specifically, dogs fed a natural diet have more diverse and abundant microbial composition in the gut microbiota than dogs fed a commercial feed. In addition, this study suggests that in dogs fed a natural diet, the potential risk of opportunistic infection could be higher, than in dogs fed a commercial feed. The type of diet might therefore play a key role in animal health by affecting the gut microbiota. This study could be the basis for future gut microbiota research in dogs.
Keywords: Canis lupus familiaris, Natural diet, Next-generation sequencing, Gut microbiota
30
1.1. Introduction
The gut microbiota is the collection of living microorganisms inhabiting the gastrointestinal (GI) tract of the host. It has been estimated that the gut microbiota of humans and animals consists of 1010–1014 microbial cells, a number roughly similar or 10 times higher than the number of host cells (Honneffer et al., 2014; Sender et al., 2016). In the past, studies on the microbiota were performed using culture-based methods, and research in the field was limited. However, recent advances in next-generation sequencing (NGS) technologies have allowed a more comprehensive analysis of the complex and diverse gut microbial communities (Kwong et al., 2015).
Therefore, the number of studies on the gut microbiota using NGS system, which could provide a broad and deep understanding of the microbiota, is on the rise. These studies have revealed that the gut microbiota is closely linked with the host’s health and disease status, including maintenance of the GI health, stimulation of the immune system, development of obesity, and various GI disorders, including inflammatory bowel disease (Frank et al., 2007; Zhang et al., 2015). Concomitant with the analysis of the relationship between the microbiota and health, several studies are aiming to identify the various factors affecting the microbiota (Penders et al., 2006). Some studies have suggested that among such diverse factors, the diet greatly influences the composition of the gut microbiota; hence, recent studies have largely focused on the relationship between the diet and gut microbiota. The results revealed that
31
animal-based diets might cause an increase in the abundance of Alistipes, Bilophila, and Bacteroides at the genus level, and a decrease in the abundance of Firmicutes at the phylum level in the human gut microbiota; furthermore, the human gut microbiota has been divided into a Prevotella enterotype and a Bacteroides enterotype, according to long-term diet (Wu et al., 2011; David et al., 2014).
The dog (Canis lupus familiaris) is one of the closest companion animals to humans; over the years, as the quality of life improved, the number of people who raised dogs increased. In addition, people began treating their dogs as family members rather than pets, and began focusing on their health (Barker and Wolen, 2008). However, gut microbiota studies were mainly focused on human and human-oriented mouse models (Penders et al., 2006;
Frank et al., 2007; Wu et al., 2011; David et al., 2014; Zhang et al., 2015).
Several studies of the dog were conducted, including comparisons of the microbiota of obese and lean dogs; comparisons of the microbiota in the presence or absence of GI diseases; and comparisons of the microbiota according to the presence or absence of dietary fiber or boiled meat in the diet (Middelbos et al., 2010; Suchodolski et al., 2012; Handl et al., 2013; Herstad et al., 2017). Nevertheless, most of these studies of dog gut microbiota were performed using the 454 pyrosequencing techniques, which are rarely used now-a-days; furthermore, they were not nearly as numerous as human-based studies, and did not match the increase in the numbers of pet owners, and their
32 increased interest in dog health.
In recent years, the number of pet owners who feed their dogs a natural diet, i.e., one consisting of bones, raw meat (such as chicken and beef), and vegetables, instead of commercial feed, has increased (Strohmeyer et al., 2006).
This increase was fueled by the 2007 pet food recalls, because of melamine contamination (Schlesinger and Joffe, 2011). In parallel with this trend, the advantages and disadvantages of a natural diet were discussed. Feeding dogs a natural diet was associated with some health benefits, such as fresher breath, healthier coat and skin, alleviation of arthritis, and improved immune response (Stogdale and Diehl, 2003). In contrast, some studies have provided evidences that discourage the use of natural diet because of nutritional imbalance and bacterial contamination. Feeding dogs a natural diet led to a pronounced nutritional imbalance and increased the risk of exposure to zoonotic pathogenic bacteria, including Salmonella spp., Campylobacter spp., and pathogenic Escherichia coli, which threaten the dog and public health (Joffe and Schlesinger, 2002; Strohmeyer et al., 2006; Lefebvre et al., 2008; Schlesinger and Joffe, 2011). These studies, however, were only based on nutrition, pathogen detection, and clinical experience, and there were few studies about changes in microbiota composition associated with natural diet and commercial feed in dogs (Sandri et al., 2017).
Given the above, factors that can influence the gut microbiota, especially diet type, in dogs, need to be studied. The current study was
33
performed to investigate the effect of diet, i.e., natural diet and commercial feed, on the gut microbiota. Specifically, (1) we identified the core microbiota of dogs fed a natural diet or a commercial feed up to the species level; and (2) compared the differences in alpha diversity, beta diversity, and the composition of gut microbiota between animals fed the two different types of diet.
34
1.2. Materials and Methods
Animals and diets
For this study, 24 dogs were initially recruited; 11 dogs were from a pet owner group (Seoul, Korea), which is a social community of pet owners gathered to feed dogs a natural diet. Pet owners in this group share information of dogs and raise dogs in the same way, walking a dog in a similar way and feeding a natural diet in similar rate of raw meat and vegetables (90% of raw meat : 10% of vegetables). Thirteen dogs belonged to veterinary college (Seoul, Korea) students who fed the dogs a commercial feed. From among these, 11 representative fecal samples (6 dogs fed a natural diet and 5 dogs fed a commercial feed) were selected for gut microbiota analysis according to the selection criteria, which included diet, medical history, living area (indoor), breed, gender, age, and weight. All dogs analyzed in this study were small breeds, including the Maltese (n = 2), Yorkshire terrier (n = 2), Pomeranian (n
= 1), Poodle (n = 2), Bichon Frise (n = 3), and white West Highland terrier (n = 1) breeds. The natural diet was based on approximately 90% raw meat (kangaroo, beef, chicken, or duck) and 10% vegetables; the commercial feed comprised Natural Balance (Natural Balance Korea CO., Ltd., Suwon, Kyonggi-Do, Korea) and LAMER Dr. Heal Skin care (CHD MEDICS CO., Ltd., Goyang, Kyonggi-Do, Korea). The chemical composition of these two commercial feed is crude protein (18–21% of total content), crude fat (8–10%),
35
crude fiber (3–5%), and crude ash (7%), and 10% of moisture. The median age of the dogs was 36 months (range: 12–144 months); the median body weight was 4.3 kg (range: 2.8–8.3 kg); and the body condition score of all dogs was 5, based on a 9-point scale (Laflamme, 1997). All dogs were clinically healthy, had not been receiving any medications that could have affected the gut microbiota for at least 6 months prior to the study, and their diet had not been changed for at least 1 year prior to sample collection. Detailed information about the animals and their diet is provided in Table 1.
Sample collection and DNA extraction
Fecal samples of 11 dogs were analyzed. Fresh fecal samples were individually collected, and then immediately transported to the laboratory at 4 °C. All samples were stored at −75 °C for microbial community analysis.
After thawing the frozen fecal samples, metagenomic DNA was extracted using the FastDNA SPIN extraction kit (MP Biomedicals, Santa Ana, CA, USA) following the manufacturer’s instructions. All metagenomic DNA samples were stored at 4 °C for microbial community analysis.
Polymerase chain reaction (PCR) amplification and Illumina sequencing
For bacterial DNA amplification, the reactions were carried out using the extracted metagenomic DNA, with the primers 341F and 805R, targeting
36
the V3–V4 regions of the 16S rRNA gene (Table 2). A secondary amplification to attach the Illumina Nextera barcodes was then performed using the i5 forward primer and i7 reverse primer (Table 2); PCR products were examined via 2% agarose gel electrophoresis. For purification of the amplified products, the QIA quick PCR purification kit (Qiagen, Valencia, CA, USA) was used.
Equal amounts of purified products were pooled together, and non-target fragments were removed using the Ampure beads kit (Agencourt Bioscience, Beverly, MA, USA). The product size and quality were evaluated on a Bioanalyzer 2100 (Agilent, Palo Alto, CA, USA). The amplicons were pooled, and sequencing was conducted at Chunlab, Inc. (Seoul, Korea) using an Illumina MiSeq sequencing system (Illumina, San Diego, CA, USA).
MiSeq pipeline
The raw reads were first submitted to a quality check and filtering of low quality (<Q25) reads by Trimmomatic 0.32. The paired-end sequences (250 bp) were then merged using PandaSeq (Masella et al., 2012; Bolger et al., 2014).
Primers were trimmed using Chunlab in-house program (Chunlab, Inc., Seoul, Korea) at a similarity cut-off of 0.8; the sequences were denoised using the DUDE-Seq to correct the sequencing errors. From all quality controlled sequences, 20,000 reads were randomly selected, and UCHIME and the 16S database in the EzBioCloud were used to identify chimera reads with a best hit similarity rate below 97% (Edgar et al., 2011). Taxonomic assignment was
37
performed based on the EzBioCloud database, and sequence similarity was calculated via pairwise alignment (Myers and Miller, 1988; Altschul et al., 1990). Sequences that matched the reference sequence by more than 97%
similarity in EzBioCloud were considered identified at the species level. The sequences that were not matched to the EzBioCloud 16S database were then clustered using cluster database at high identity with tolerance (CD-HIT) and UCLUST tools with 97% similarity boundary (Edgar, 2010; Fu et al., 2012).
The species identified at the EzBioCloud 16S database and OTUs obtained by CD-HIT and UCLUST tools were combined to form the final set of OTUs, and the remaining singletons were ignored. Other sequence similarity cut offs were genus (97% > x ≥ 94.5%), family (94.5% > x ≥ 86.5%), order (86.5% > x ≥ 82%), class (82% > x ≥ 78.5%), and phylum (78.5% > x ≥ 75%).
Data and statistical analyses
The alpha and beta diversities were analyzed by using CLcommunityTM version 3.43 (Chunlab, Inc.). The alpha diversity analysis, including rarefaction curve and diversity indices, was carried out. The beta diversity, including principal component analysis (PCA), was analyzed based on Fast UniFrac (Hamady et al., 2010). The core microbiota was defined as including microorganisms present in more than 80% of dog feces in each diet group, and at the same time accounting for more than 0.1% of the total microbial community. Differences in the alpha diversity, including the number
38
of operational taxonomic units (OTUs), richness, and diversity, were investigated in the two diet groups. Furthermore, differences in taxonomic composition between the two groups, from the phylum to species level, were analyzed. Statistical analysis was performed using a Mann–Whitney U test in SPSS statistics package, version 22.0 (SPSS IBM, New York, NY, USA), and a p-value of <0.05 was accepted as indicating statistical significance.
39
1.3. Results
Sequence analysis
In total, 3,288,464 reads were obtained from the fecal samples;
1,896,221 were from the natural diet group (median read number: 317,576;
range: 237,356–387,829), and 1,392,243 were from the commercial feed group (median read number: 284,801; range: 224,940–311,212). After quality trimming, merging, primer trimming, and length trimming, 20,000 reads were randomly selected, and chimera reads were removed; 171,495 valid reads were hence obtained from 11 samples. The number of valid reads from the natural diet group was 14,593.67 ± 893.73 (mean ± SD), and from the commercial feed group, 16,786.6 ± 1072.53 (p = 0.004). The median read length was 409.54 (403.91–419.99) and the median Good’s library coverage was 99.77734 (99.5751–99.81349) (Table 3). The rarefaction curves for all 11 samples are shown in Figure 6.
Alpha diversity
The number of OTUs in the natural diet group was significantly higher than that in the commercial feed group (natural diet group: 224.67 ± 25.72, commercial feed group: 132.4 ± 25.28, p = 0.004; Figure 7A). The species richness estimates were significantly higher in the natural diet group than in the commercial feed group. The Ace richness estimates of the natural diet group
40
and commercial feed group were 248.48 ± 23.78 and 155.64 ± 25.13 (p = 0.004;
Figure 7B), respectively; the Chao1 richness values were 234.56 ± 23.66 and 143.31 ± 23.81 (p = 0.004), respectively (Figure 7C). In addition, the diversity indices of the natural diet group were also significantly higher than that in the commercial feed group based on the Shannon diversity index and Simpson diversity index. The Shannon diversity indices of the natural diet and commercial feed groups were 3.03 ± 0.29 and 2.17 ± 0.33, respectively (p = 0.009; Figure 7D); the Simpson diversity indices were 0.10 ± 0.04 and 0.20 ± 0.06, respectively (p = 0.017; Figure 7E). The raw data of alpha diversity for all samples are shown in Table 3.
Beta diversity
PCA plots based on the Fast UniFrac distance metric were used to compare the composition of microbiota in the two animal groups. Upon PCA analysis, no difference in PC distribution was seen along PC 1, but a significant difference was observed along PC 2 (p = 0.004). The commercial feed group clustered together; the natural diet group also clustered together (Figure 8). The raw data of PCO vectors for all samples are shown in Table 4.
The core gut microbiota of dogs fed a natural diet or a
commercial feed
41
At the phylum level, we identified eight different bacterial phyla in 11 dog samples; the core microbiota in the natural diet group comprised Firmicutes, Bacteroidetes, Fusobacteria, Actinobacteria, and Proteobacteria, and in the commercial feed group, these were Firmicutes, Bacteroidetes, Proteobacteria, and Actinobacteria (Table 5). These core gut microbiota constituted more than 99% of the total microbiota in each group; the predominant core microbiota at the phylum level was Firmicutes, followed by Bacteroidetes, regardless of the diet type.
At the family level, 81 families were identified; among these, 14 families comprised the core microbiota in the natural diet group and constituted more than 99% of the total microbiota; in the commercial feed group, 13 families formed the core microbiota and constituted ca. 90% of the total microbiota (Table 5). Only 10 bacterial families from the core microbiota were shared by the two groups.
At the species level, 594 bacterial species were identified; among these, 37 species formed the core microbiota in the natural diet group and comprised ca. 67% of the total microbiota; in the commercial feed group, 30 species formed the core microbiota and comprised ca. 66% of the total microbiota (Table 5). Only 14 species from the core microbiota were shared by the two groups.
42
Differences in the taxonomic composition of core gut microbiota of the two diet groups
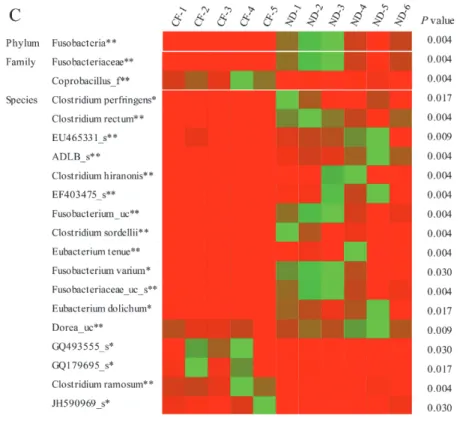
Differences in the taxonomic composition of core gut microbiota of the two diet groups were analyzed. At the phylum level, the abundances of Fusobacteria were different in the two groups; Fusobacteria were more abundant in the natural diet group than in the commercial feed group (p = 0.004;
Figure 9A). At the family level, Fusobacteriaceae was more abundant in the natural diet group than in the commercial feed group (p = 0.004), while Coprobacillus_f was more abundant in the commercial feed group than in the natural diet group (p = 0.004; Figure 9B). At the species level, the abundance of 30 species was different in the two groups. In particular, Clostridium ramosum (p = 0.004) and Anaerostipes caccae (p = 0.009) were more abundant in the commercial feed group; Clostridium perfringens (p = 0.017), Clostridium rectum (p = 0.004), Clostridium hiranonis (p = 0.004), Clostridium sordellii (p
= 0.004), Eubacterium tenue (p = 0.004), Fusobacterium varium (p = 0.030), Eubacterium dolichum (p = 0.017), and Clostridium glycyrrhizinilyticum (p = 0.017) were more abundant in the natural diet group (Figure 9C). Differences in the taxonomic composition of the gut microbiota at the phylum, family, and species levels in the two groups are presented as a heat map in Figure 9C.
43
1.4. Discussion
To the best of our knowledge, the current study is the first to investigate the effect of diet on the gut microbiota of dogs fed a natural diet compared with ones fed a commercial feed that have been actually applicated by dog owners by identifying the core microbiota up to the species level and comparing the differences in the gut microbiota between the two diet groups using NGS technology.
In the current study, the Illumina MiSeq platform and EzBioCloud database were used to analyze the gut microbiota of the dog. Among the various NGS systems, the Illumina MiSeq platform generates long and high-quality sequence reads, with the lowest error rates; it is also the most cost-effective platform, and hence suitable for small investigations (Caporaso et al., 2012;
Kozich et al., 2013; Salipante et al., 2014; Derakhshani et al., 2016). The Illumina MiSeq platform was therefore chosen from the available NGS systems for the current study. In general, it is known that classification up to the species level may not be possible in MiSeq, because the species-level classification system of the reference database is not sufficient, rather than limitations of sequencing. In the case of SILVA and RDP, which are widely used, classification information is provided only up to the genus level, and the database is not updated periodically. However, the EzBioCloud database has a total of 78,870 taxa information (a total of 17,903 species with valid species names), which is more systematic, accurate, and periodically updated (Yoon et
44
al., 2017). Therefore, data analysis using the EzBioCloud database allowed us to classify correctly up to the species level. The results of this study were similar to some but not all previous studies that employed the Illumina MiSeq platform to investigate the dog gut microbiota. In a study by Sandri et al. (Sandri et al., 2017), the gut microbiota of dog was found to be composed of Firmicutes (43%), Bacteroidetes (19.8–26.9%), Fusobacteria (4.7–11%), and Proteobacteria (1.3–4.3%); in another study (Igarashi et al., 2014), it was found to be composed of Firmicutes (84.4% of all sequences), Bacteroidetes (2.9%), Fusobacteria (3.2%), Proteobacteria (7.8%), and Actinobacteria (1.7%). These differences might be due to individual variation of gut microbiota and differences in the animals. In particular, the gut microbiota is highly affected by the host genotype and environmental exposure, i.e., conditions that are difficult to standardize (Turnbaugh et al., 2009). The inconsistency might also be attributable to the different DNA extraction kits employed. Previous studies have revealed that DNA yield, quality, and integrity, and the microbial community results vary depending on the DNA extraction kits used (Kennedy et al., 2014; Wagner Mackenzie et al., 2015a). The number of OTUs identified in the current study was nonetheless similar to that of other studies (range: 129–
242); furthermore, the Good’s library coverage in the current study was higher than that in other studies, which suggested that our results might reflect the actual bacterial gut community of dogs enrolled in this study.
45
In this study, diets were found to have a greater extent on the gut microbiota than other factors. No specific tendencies were observed when each sample was categorized by other factors (breed, gender, age, and weight of the dogs); however, there were pronounced differences in beta diversity, i.e., the measure of group comparison according to dietary types. Specifically, the samples mostly clustered together between the two diet groups based on PCA analysis. In addition, significant differences were observed between the two diet groups in the number of OTUs, species richness, and evenness. According to alpha diversity, i.e., species diversity, the richness estimates, and diversity indices of the microbiota of the natural diet group were significantly higher (p
< 0.05) than those in the commercial feed group. Differences in the core microbiota at the phylum, family, and species levels were also observed between the two groups. The core microbiota comprised shared organisms found in the majority of individuals (Turnbaugh et al., 2007). In the current study, core microbiota accounted for more than 99 percent at the phylum level, more than 90 percent at the family level, and more than 66 percent at the species level and could have a different impact on host health. Thus, the diet might indeed be responsible for the differences in alpha diversity, beta diversity, and the core microbiota. These differences might be due to differences in the way the two diet types were manufactured and differences in the main ingredients of the two diets. Generally, commercial feeds contain controlled nutrients and controlled microorganisms, because they undergo formal manufacturing
46
processes, including compression through high temperature and high pressure and microbial monitoring. However, natural diets do not go through any manufacturing process and are fed to dogs as raw, so that more nutrients and microorganisms in the natural habitat are absorbed into the gut of the dog. In addition, these two diet types had differences in the main ingredients. The commercial feeds given to dogs recruited for the current study contained crude protein (18–21% of total content), crude fat (8–10%), crude fiber (3–5%), and crude ash (7%), with 10% of moisture. Based on these values, the main ingredients of the commercial feed were carbohydrates (up to ca. 50%). On the other hand, the main ingredients of the natural diet, which consisted of bones and raw meat, were crude protein (30–52%) and fat (11–50%), regardless of the meat type (Murray et al., 1998). A previous study of the human gut microbiota revealed that there was a difference in gut microbiota between individuals with protein/fat-based eating habits and individuals with carbohydrate-based eating habits, because of the differences in microorganisms required for the digestion of carbohydrates, proteins, and fats (Wu et al., 2011). By analogy, in the current study, the microbiota of dog would have c