저작자표시-비영리-변경금지 2.0 대한민국 이용자는 아래의 조건을 따르는 경우에 한하여 자유롭게
l 이 저작물을 복제, 배포, 전송, 전시, 공연 및 방송할 수 있습니다. 다음과 같은 조건을 따라야 합니다:
l 귀하는, 이 저작물의 재이용이나 배포의 경우, 이 저작물에 적용된 이용허락조건 을 명확하게 나타내어야 합니다.
l 저작권자로부터 별도의 허가를 받으면 이러한 조건들은 적용되지 않습니다.
저작권법에 따른 이용자의 권리는 위의 내용에 의하여 영향을 받지 않습니다. 이것은 이용허락규약(Legal Code)을 이해하기 쉽게 요약한 것입니다.
Disclaimer
저작자표시. 귀하는 원저작자를 표시하여야 합니다.
비영리. 귀하는 이 저작물을 영리 목적으로 이용할 수 없습니다.
변경금지. 귀하는 이 저작물을 개작, 변형 또는 가공할 수 없습니다.
이학박사 학위논문
Geology, mineralogy and stable isotope geochemistry of the Erdenetiin Ovoo
porphyry Cu-Mo deposit and the Dzuunmod orogenic gold deposits in northern Mongolia: Implications for ore
genesis and sources
몽골 북부에 위치한 에르데넷 오보 반암 동- 몰리브덴 광상과 준모드 지역 조산형 금 광상의
지질학, 광물학 및 안정동위원소 지구화학 연구
2019년 2월
서울대학교 대학원 지구환경과학부
김 영 민
Ph.D. Thesis
Geology, mineralogy and stable isotope geochemistry of the Erdenetiin Ovoo
porphyry Cu-Mo deposit and the Dzuunmod orogenic gold deposits in northern Mongolia: Implications for ore
genesis and sources
몽골 북부에 위치한 에르데넷 오보 반암 동- 몰리브덴 광상과 준모드 지역 조산형 금 광상의
지질학, 광물학 및 안정동위원소 지구화학 연구
February 2019
School of Earth and Environmental Sciences Graduate School
Seoul National University
YEONGMIN KIM
G
G G
Abstract
##
Geology, mineralogy and stable isotope geochemistry of the Erdenetiin Ovoo porphyry Cu-Mo deposit and
the Dzuunmod orogenic gold deposits in northern Mongolia: Implications for ore genesis and sources
#
YEONGMIN KIM School of Earth and Environmental Sciences
Graduate School Seoul National University
#
This study reports geological, mineralogical and stable isotope geochemical results of porphyry Cu-Mo deposit and orogenic gold deposit in northern Mongolia.
The former is the Erdenetiin Ovoo deposit located in Orkhon province and the latter is the Dzuunmod gold area deposit in Selenge province. Both deposits have large tonnage of Cu, Mo and Au, and been mined for a long time. Compared to many geological studies about petrographic and mineralogical characteristic of both deposits, few researches have been conducted for ore genesis and material sources.
Based on geological, mineralogical and stable isotope geochemical measurements, therefore, this study focuses on the ore genesis and sources of metal and sulfur, implying for deposit origin and mineral exploration.
The copper (δ65Cu) and sulfur (δ34S) isotope compositions of ore minerals from the Erdenetiin Ovoo porphyry Cu-Mo deposit in northern Mongolia were measured.
The δ65Cu values of Cu (I) sulfide minerals ranged from 0.14 ‰ to 2.69 ‰, suggesting that Cu predominantly originated from magmatic sources, whereas Cu (II) minerals such as chrysocolla, malachite and azurite presented much larger
G G
variations of δ65Cu values from -1.01 ‰ to 10.0 ‰. The small difference between the primary and secondary Cu sulfide minerals indicates an insignificant influence of Cu isotope fractionation processes during their formation, which may be explained by large mass transport and/or the involvement of biogenic activities. The δ65Cu values of primary chalcopyrite suggest source heterogeneity and/or the occurrence of isotope fractionation under a high-temperature environment. The positive ΔCu (II) mineral – Cu (I) mineral values imply little transport of Cu in the deposit, with a rough mass balance and fast redox reaction.
The δ34S values of the primary sulfide minerals (pyrite, molybdenite and chalcopyrite) clustered near 0 ‰, indicating that the sulfur is mainly derived from a homogeneous magmatic source. By contrast, the δ34S values of secondary Cu sulfide minerals ranged from -3.2 ‰ to -0.3 ‰, with an average of -1.6 ‰. The lower δ34S values are likely influenced by either S isotope fractionation processes or input of sulfur with different S isotope compositions during their formation.
The measured δ65Cu and δ34S values of these ore minerals suggest a large mass transportation of Cu to an adjacent location, indicating little possibility of a hidden Cu occurrence in the Erdenetiin Ovoo deposit area.
The Dzuunmod gold area located in the North Khentii Gold belt (NKGB) of Central Northern Mongolia includes lode gold deposits such as Gatsuurt, Boroo, Sujigtei, Ereen and Ulaanbulag with several gold occurrences. These show similar alteration types and ore mineral assemblages, where sericite, siliceous and potassic alteration assemblages are major hydrothermal alteration types. Pyrite and arsenopyrite are main sulfide minerals with minor amount of galena, sphalerite and chalcopyrite. Gold occurs as native form and invisible gold in pyrite and arsenopyrite.
The major sulfide minerals are separated into earlier non-auriferous stage and later
G
G G
auriferous grains containing invisible gold. Native gold postdates the major sulfide mineralization.
Gold and arsenic content of pyrite grains indicates that gold exists mainly as solid solution form (Au+1) in the Gatsuurt and Boroo deposit whereas gold nanoparticle (Au0) is present in the Sujigtei deposit. High Co/Ni and Mo/Ni ratios of pyrite grain suggest a post-sedimentary or hydrothermal origin and the ore-forming fluid was significantly affected by fluid-rock interaction during mineralization processes.
Large variation of δ34S values of pyrite and arsenopyrite from -2.6 ‰ to 17.2
‰ indicates that sulfur seems to be mainly derived from a source with heterogeneous sulfur isotope composition, which is the pyrite-bearing sediment mainly produced by the reduction of seawater sulfate. Consistent with geological evidence, relatively positive δ34S values suggest that sulfidation plays an important role for gold and sulfide precipitation. The calculated δ18O values of hydrothermal fluid from the measured δ18O values of quartz samples (from 14.7 ‰ to 17.7 ‰) indicate that a metamorphic derivation of ore-forming fluid.
Based on the observation and analytical results in this study, gold mineralization processes seem to occur several times by multiple input of hydrothermal fluid, fluid- rock interactions and mixing of ore-forming fluids. Therefore, the gold deposits in the Dzuunmod area is considered to be orogenic gold type influenced by fluid-rock interactions in the deposit area.
#
Keywords: Ore deposits, Geology, Mineralogy, Stable isotope geochemistry, Mongolia
Student Number: 2011-23264
G G
ㆢ
ㆢ# # # # ᳷#
#
Ⰾ# ᘖῒ⯚# ὗᆂ# ∛√⩪# ⮞㋲㧶# ⩪Ḏ᠊ᗑ㞎# ⪾# ₲⧮# ᡳ0ὊṆ⊦# ᆫ╛ᆖ# # ὂ# ⹚⪇# ⴊ╊㪯# ኢ# ᆫ╛⯲# ⹚㧳/# ᆫῖ㧳# ₩# ⧢ⲯᡳ⮞⭪☦#
⹚ሆ㫮㧳# ⪊ሆⰎ1# ᣪ# ᆫ╛# ὂᣪ# Ṩ⯚# ሆṆ/# ὊṆ⊦# ₩# ኢ# Ṿⰿᱣ⯞#
Ⴐᅺ# Ⱒ⯖Ἂ/# ⪾ᰶ# ዊ႞# ᡳ⧢# Ⴖ₶ᢲ⩎# ⫮1# ኒᲆᔲ# ⧮▷㧳# ₩#
ᆫῖ㧳ⲛ# 㝓⯞# 㞦⧟㧲ዊ# ⮞㧶# ⪊ሆ⩪# ⋞㨎# ᆫ╛⯲# ○Ⱂᆖ# ῖ⯲#
ዊ⭪⩪# រ㧶# ⪊ሆᜮ# ᄊ⯲# ⚲㨣ᢲ⹚# ὕ㧲⪚1# ᰖ▶# Ⰾ™# ⪊ሆ⩪▶ᜮ#
⹚㧳/# ᆫῖ㧳# ₩# ⧢ⲯᡳ⮞⭪☦# ⹚ሆ㫮㧳# ⪊ሆᅊᆖḖ# ₮㕯⯖ᳶ# ᆫ╛⯲#
○Ⱂᆖ# ኢ☧# ₩# 㬃⯲# ዊ⭪# ㈮ⲛ⯞# 㙏㨎# ᆫ╛⯲# ዊ⭪ᆖ# ᆫῖ# 㕪╆⩪# រ㨎#
ㆢⲪ⯞# Ṹ㈮ᅺⰪ# 㧶1#
ὗᆂ# ∛√⯲# ⩪Ḏ᠊ᗑ㞎# ⪾# ₲⧮# ᡳ0ὊṆ⊦# ᆫ╛⩪▶# ╊㈶ᢲᜮ#
ᆫ▷# ᆫῖ⯲# ሆṆ+儑98Fx,# ₩# 㬃+儑67V,# ᡳ⮞⭪☦# ⴊ○⯞# ㊻ⲯ㧲⪚1#
4ႚ# ሆṆ+Fx# +L,,Ḗ# 㨂⮺㧶# ሆṆ# 㬃㫮ῖ⯲# 儑98Fx# Ⴌ⯚# 3147# #
519<俉⯲# ℮⮞Ḗ# ⰎἊ/# Ⰾᜮ# ሆṆႚ# ṢኒṢ⩪▶# ዊ⭪㧲⪚⯦⯞#
⹚❶㧶1# ₲Ἆ⩪# 5ႚ# ሆṆ+Fx# +LL,,Ḗ# 㨂⮺㧶# 㔆Ṇ☦㏶ᰖ/# ᆏⰫ▷# ₩#
ᕂᡳ▷ᆖ# Ⴓ⯚# ሆṆ# ᆫῖ⯲# 儑98Fx# Ⴌ⯚# 04134# # 4313俉⯲# # 㔊#
℮⮞Ḗ# Ⱂ1# 4ヂ# ₩# 5ヂ# ሆṆ# 㬃㫮ῖ# ႞⯲# Ⱛ⯚# ሆṆ# ᡳ⮞⭪☦# Ⴌ⯲#
ヂⰎᜮ# 5ヂ# ሆṆ# 㬃㫮ῖⰎ# ╷○ᢲᜮ# ᡳ⧢# ሆṆ# ᡳ⮞⭪☦# ∞⅞# Ⱛ⭃Ⰾ#
㔆⹚# ⧤⧲⯦⯞# ⹚❶㧶1# Ⰾᲆ㧶# Ⱛ⯚# ∞⅞# Ⱛ⭃⯚# រቶὂ⯲# ሆṆ#
ⰎᡳⰎ# Ⱆ⩎ᕆᄊᔲ# ╷ῖ㧳ⲛ# 㫶ᡳ⩪# ⯲㧶# ᄝ⯖ᳶ# ╷ႛᢶ1# 㬃ᡳ▷⯲#
儑98Fx# Ⴌ⯚# ዊ⭪# ῖ⯲# ⋞ቺ㧶# ሆṆ# ᡳ⮞⭪☦# ⴊ○# ᪪ᜮ# ᅺ⫂⩪▶#
Ⱆ⩎ᔶ# ሆṆ# ᡳ⮞⭪☦# ∞⅞# Ⱛ⭃⩪# ⯲㧶# ᄝ⯖ᳶ# ⪆ᅂ1# ᪪㧶# ⨫⯲#
僱Fx# +LL,# plqhudo# ˀ# Fx# +L,# plqhudo# Ⴌ⯚# ᆫ╛⩪▶# ሆṆ⯲# ⰎᡳⰎ# Ỗ# ᆍዦ⹚#
Ⰾᶞ⹚⹚# ⧤⧞# រᱏⲛⰒ# ῖ# ⚲⹚⫚# ⋺Ḓ# ╊㫮㫲⭪# ₲⯫Ⰾ# Ⱆ⩎ᕆ⯦⯞#
⹚❶㧶1#
4ヂ# 㬃㫮ῖ+㬃ㄺ▷/# 㬃ᡳ▷# ₩# 㮲⚲⪊▷,⯲# 儑67V# Ⴌ⯚# 3俉# ኖㄲ⩪#
ὂ⪆# Ⱒ⯖Ἂ/# Ⰾᜮ# 㬃Ⰾ# ቺ㧶# ṢኒṢ⩪▶# ዊ⭪㧲⪚⯦⯞# ⹚❶㧶1#
₲Ἆ⩪# 5ヂ# 㬃㫮ῖ⯲# 儑67V# Ⴌ⯚# 0615# # 0316俉⯲# ℮⮞Ḗ# Ⴐ⯖Ἂ/#0
G
G G
419俉⯲# 㡣ቺႬ⯞# Ⴐᜮ1# Ⰾᲆ㧶# # ᕈ⯚# 㬃# ᡳ⮞⭪☦# ⴊ○⯚# 㬃#
ᡳ⮞⭪☦# ∞⅞# Ⱛ⭃# ᪪ᜮ# Ḓ# 㬃# ᡳ⮞⭪☦# ⴊ○⯞# Ⴐᜮ# 㬃⯲# ⮺Ⱏ⩪#
⯲㧶# ᄝ⯖ᳶ# ⪆ᅂ1# #
ᆫ▷# ᆫῖ⯲# Ⰾᲆ㧶# ሆṆ# ₩# 㬃# ᡳ⮞⭪☦# Ⴌ⯚# ኖㄲ# ⹚⪇⯖ᳶ#
រቶὂ⯲# ሆṆ# ῖⰎ# Ⰾᡳ㧲⪆/# ⪊ሆ# ⹚⪇⩪▶# Ḓ# ⛂ᅂ# ᆫㅎႚ#
₶ᅆᢺ# ႚ○⯚# Ṿ⭊# Ⱛ⯦⯞# ⹚❶㧶1# #
ὗᆂ# ⶫ∛√⯲# ᄪ㞊# ኢ# ᆫ㫮រ⩪# ⮞㋲㧶# ὂ# ⹚⪇⩪ᜮ#
ႭḎ㝒+Jdwvxxuw,/# ᶂ+Erurr,/# ⚲⹚㗦Ⰾ+Vxmljwhl,/# ⩪Ṋ+Huhhq,#
₩# ⭒ᰚ∢ᰖኒ+Xoddqexodj,⫚# Ⴓ⯚# ኢ# ᆫ╛Ⰾ# ᔲ㕚ᔶ1# Ⰾ⯚#
⋞❑㧶# ⅚# ₩# ᆫ▷# ᆫῖ# ⴊ㨃⯞# ⪆ⶖἊ/# ⶖᳶ# ᅆ⭎ὂ/# ቶ╊# ₩#
N0ⰿ▷⯲# ⅚# ᆫῖ# ⴊ㨃Ⰾ# ኢ# ᆫ㫮Ⱛ⭃ᆖ# ⪊ᆚᢲ⩎# ᔲ㕚ᔶ1#
㬃ㄺ▷ᆖ# 㬃⋞ㄺ▷Ⰾ# ⶖ⬮# ᆫ▷# ᆫῖⰎἊ/# ⲛ⯚# ⨫⯲# ⪊▷/# ◆⧞⪊▷#
₩# 㬃ᡳ▷Ⰾ# 㨂፲# ╊㈶ᢶ1# ኢ⯚# Ⱚ⪊ኢᆖ# 㬃㫮ῖ# ᕎ⩪# 㢆㨂ᢶ#
⮻⧢⯖ᳶ# ᆚナᢲ⹚# ⧤⯚# ኢ⯲# 㪯㕶ᳶ# ὂᣪ# ᔲ㕚ᔶ1# ⶖ⬮# 㬃㫮ῖ⯚#
ㆢዊ⯲# ኢ⯞# 㨂⮺㧲⹚# ⧤⯚# ᆫ㫮# គᅞ⫚# 㭞ዊ⯲# ኢ⯞# 㨂⮺㧶# ᆫ㫮#
គᅞᳶ# ᔲᛲἊ/# Ⱚ⪊ኢ⯚# Ⰾ㭞⩪# 㪯○ᢶ# ᄝ⯖ᳶ# ⪆ᅂ1#
㬃⋞ㄺ▷# ᕎ⯲# ኢᆖ# ⋞☦# 㨂ᱣ⯚# ኢⰎ# ႭḎ㝒⫚# ᶂ# ᆫ╛⩪▶ᜮ#
ᅺ⭃ㅎ# 㪯㕶⯲# 4ႚ# ኢ⯖ᳶ# ⴎⱆ㧲ᜮ᠊# ₲㨎/# ⚲⹚㗦Ⰾ# ᆫ╛⩪▶ᜮ# ᔲᘒ#
ⰟⰪ# 㪯㕶ᳶ# ⴎⱆ㨂⯞# ⪆1# 㬃ㄺ▷# ᕎ⯲# ᘬ⯚# Fr2Qlᆖ# Pr2Ql# ⋞ᜮ#
ⰎⰎ# 㚎ⲛⰫ⭃# Ⰾ㭞⩪# ╷○ᢲ⩢⯖Ἂ/# ᆫ㫮# ⮺ㅎႚ# ᆫ㫮# Ⱛ⭃# ᡳ⧢⩪#
⮺ㅎ0⧮▷# Ⱛ⭃⩪# Ṩ⯚# ⪛㨿⯞# ₵⧲⯦⯞# ⹚❶㧶1# #
㬃ㄺ▷ᆖ# 㬃⋞ㄺ▷⯲# 儑67V# Ⴌ⯚# 0519# # 4:15俉⯲# ᖭ⯚# ℮⮞Ḗ#
Ⴐ⯖Ἂ/# Ⰾᜮ# 㬃Ⰾ# ⋞ቺ㧶# 㬃# ᡳ⮞⭪☦# ⴊ○⯞# Ⴐᜮ# ῖ⩪▶#
ዊ⭪㧲⪚⯦⯞# ⹚❶㧶1# ⶖᳶ# 㨎⚲# ᕎ# 㬃╊⪖⯲# 㫲⭪⩪# ⯲㨎# ╷○ᢶ#
㬃ㄺ▷Ⰾ# 㢆㨂ᢶ# 㚎ⲛῖⰎ# ႚⰿ# ⶖ⬮㧶# 㬃⯲# ዊ⭪# ῖⰎᰖ# ⪆ᅂ1#
⹚㧳ⲛ# ⸷ᄊᆖ# Ⱆ㋲㧲⪆# ╛រⲛ⯖ᳶ# ⨫⯲# Ⴌ⯞# Ⰾᜮ# 儑67V# Ⴌ⯚#
㬃㫮Ⱛ⭃Ⰾ# ኢᆖ# 㬃㫮ῖ⯲# ㌂Ⲟ⩪# ⶫ⬮㧶# ⪇㧺⯞# 㧲⪚⯦⯞# ⹚❶㧶1#
▷⪛# ṿ# ❶ᵦ⯲# 儑4;R# Ⴌ+471:# # 4:1:俉,⯞# 㙏㨎# ᅞ╊ᢶ# ⪎⚲⯲#
儑4;R# Ⴌ⯚# ᆫ㫮# ⮺ㅎႚ# ⅚○# ዊ⭪⯞# Ⴐ⯦⯞# ⪆1# #
G G
Ⰾ™# ⪊ሆḖ# 㙏㨎# ⩕⩎# ᆚナ# ₩# ㊻ⲯ# ᅊᆖ⯚# ኢ# ᆫ㫮Ⱛ⭃Ⰾ#
⪆ᲆ# ヂ᳚⯲# ⪎⚲# ⮺Ⱏ/# ⮺ㅎ0⧮▷# ₲⯫ᆖ# ᆫ㫮# ⮺ㅎ# ႞⯲# 㫖㨃⩪# ⯲㨎#
Ⱆ⩎ᕆ⯦⯞# ႚṆ㕂1# ᰖ▶# ⪊ሆ# ⹚⪇⯲# ኢ# ᆫ╛⯚# ⮺ㅎ0⧮▷# ╛㫒#
Ⱛ⭃⩪# ⪛㨿⯞# ₵⯚# ⴊ╊㪯# ኢ# ᆫ╛# ⮺㪯⯖ᳶ# ⪆ᅂ1#
##
ⶖ⬮⩎# =# ᆫ╛/# ⹚㧳/# ᆫῖ㧳/# ⧢ⲯᡳ⮞⭪☦# ⹚ሆ㫮㧳/# ὗᆂ#
㧳# # # ™# =#5344056597#
#
#
G
G G
Preface
The vast area of Mongolia lies in the Central Asian Orogenic Belt (CAOB) bounded on the north by the Precambrian Siberian Craton and fringed by the Tarim and Sino-Korean Cratons in the south. It has been considered as a representative example of long-lasting continental growth and formed by multiple collision of intra- oceanic volcanic arcs, accretion and subduction events associated with magmatism on the continental margin. With the complex tectonic evolution, the CAOB hosts important and giant mineral deposits of gold, silver, copper, molybdenum, lead, zinc and nickel from Late Proterozoic to Early Mesozoic age.
The tectonic evolution of Mongolia has also been explained by the growth of the CAOB involving the subduction of small ocean basin, accretion of island arcs and formation of suture zones. These tectonic events were attributed to the closure of the Paleo-Asian Ocean including the Mongol-Okhotsk Ocean, which existed between the Siberian Craton and Sino-Korean Craton from Late Paleozoic to Early Mesozoic. The formation of the Mogol-Okhotsk Ocean and related complexes played an important role on metal endowment as well as the tectonic development of Mongolia even though the exact opening and closing time of the Mongol-Okhotsk Basin is still under debate.
Mongolia is separated into a northern and southern domain by the Main Mongolian Lineament (MML). The former is composed of Precambrian and Early Paleozoic rocks, whereas Middle to Late Paleozoic rocks occur in the latter. These domains are subdivided into forty-four terranes, three basins (Hovsgul basin, Tsagaanolom basin and Khangai-Khentii basin) and two belt (Selenge belt and Middle Gobi belt). Terranes are subdivided into Precambrian craton, high-grade
G G
metamorphic rocks, passive continental margins, island arc, forearc/backarc basin, accretionary complex and ophiolitic types. Vast amount of mineral resources, especially gold, copper and molybdenum, are distributed in these various geological settings of Mongolia.
Copper (Cu) is one of base metals with great economic importance and shows affinity to sulfur as chalcophile element. Both Cu+ and Cu2+ cations exists and the redox-sensitive characteristics with high mobility in oxidizing condition allows many copper deposits to high grades by supergene enrichment processes. because copper ore deposits can be formed in all major systems such as magmatic, hydrothermal, diagenetic and metamorphic processes, primary copper deposit types include porphyry Cu (-Mo-Au), magmatic Ni-Cu, skarn and replacement Cu, iron- oxide-copper-gold (IOCG), volcanic-hosted massive sulfide (VMS), stratabound sediment-hosted and supergene ore deposits. Among these, porphyry Cu systems supply about 75 % of the world’s Cu and half the Mo and most Re.
Gold (Au) shows strong siderophile characteristics and occurs as coarse- grained native gold or invisible form in sulfide grains. Although gold is one of the rarest elements, gold deposits are common owing to the crustal fluid which is able to transport the gold. Therefore, numerous gold deposits are associated with magmatic and metamorphic systems. Major gold deposit types are orogenic gold, porphyry, IOCG, Carlin type, epithermal and placer deposits. Especially, orogenic gold deposits formed by crustal-scale massive fluid flows of aqueous carbonic metamorphic and local magmatic water in orogenic belts are one of primary gold deposits.
Therefore, it is greatly important to identify the geological characteristics and understand the ore genesis for the exploration of deposit because of various deposit
G
G G
types and geological settings. Based on the geological, mineralogical and petrological observations, stable isotope geochemical studies are able to provide a valuable information on formation and sources of the ore deposit. Not only sulfur and oxygen isotope analysis utilized from several decades ago, but non-conventional isotope analysis for Cu developed since 2000s can elucidate the source of metal itself, sulfur complexing with metals as sulfide minerals and hydrothermal fluid where metals and its complexes are transported. The development of Multi Collector- Induced Coupled Plasma Mass Spectrometer (MC-ICPMS) has enabled the measurement of transition metal isotopes including Cu isotopes with a great precision better than 0.2 ‰. Because Cu is utilized in both biotic and abiotic mechanisms, an exact measurement of Cu isotopes expands the application of Cu isotopes on various research field. The Cu isotope composition of ore deposits particularly provides a direct evidence for metal sources and supergene enrichment process, enabling to understand deposit origin.
In contrast, sulfur and oxygen isotope analysis has been researched for several decades and widely used to trace the sulfur and fluid sources in the porphyry Cu system and orogenic Au deposits. Most major Cu minerals are present as sulfide minerals such as chalcopyrite (CuFeS2), chalcocite (Cu2S) and covellite (CuS) whereas Cu is transported as a chloride complex (e.g., CuCl2) in hydrothermal fluid.
It means that the derivation of sulfur from its sources and the input to precipitation site is necessary to form Cu ore minerals. Because major sulfur sources have distinct range of sulfur isotope composition, the measurement of sulfur isotope composition of Cu ore minerals is helpful to constrain the sulfur sources. The oxygen isotope measurement of quartz veins in orogenic Au deposit can offer an information for the possible sources of hydrothermal fluid associated with ore-forming processes. Based
G G
on the assumption that hydrothermal fluid and precipitated quartz are in equilibrium state, the oxygen isotope composition of ore-forming fluid can be calculated using an isotope fractionation factor between them controlled by temperature. Similar to sulfur sources, major fluid sources (magmatic, metamorphic and meteoric water) shows different range of oxygen isotope composition, indicating that the oxygen isotope measurement of quartz samples is a great pathway to trace the origination of ore-forming fluid in orogenic Au deposit.
In this study for Ph.D. thesis, two different deposits, the Erednetiin-Ovoo and Dzuunmod gold deposit, were chosen because (1) they are representative deposit type for Cu and Au, respectively in Mongolia as well as in the world, (2) there are many interesting geological issues in these deposits such as ore genesis and sources which can provide a valuable information for mineral exploration in the region and (3) they have large tonnage indicating a high potential for Cu and Au resources.
The Erdenetiin-Ovoo deposit is porphyry Cu-Mo type formed in Middle Triassic period, which was the largest porphyry Cu deposit in Mongolia before the discovery of Oyu Tolgoi deposit in southern Mongolia. The deposit was first discovered in 1964 and has been mined since 1978. According to a USGS report, the deposit has 1780 million metric tons of ore at 0.62 wt% Cu and 0.015 wt% Mo, with metal reserves of 11 Mt Cu and 0.162 Mt Mo. The Erdenentiin-Ovoo deposit is classified into giant porphyry Cu deposit containing more than 10 Mt Cu reserves.
Many placer and lode gold deposits are distributed in the Dzuunmod gold area in the North Khentii Gold Belt (NKGB) in central northern Mongolia. Potential gold resources in NKGB have varied depending on the researches from 250 t to more than 600 t. Most lode gold deposits contain Boroo, Gatsuurt, Sujigtei, Ereen, Ulaanbulag, Kharnaga with Biluut and Balj occurrence. These deposits formed from Late Triassic
G
G G
to Early Jurassic and show similar host rocks (metasedimentary rocks, volcanic rocks and granitoid complex), alteration assemblage (sericitic, potassic, siliceous) and ore mineralogy (pyrite, arsenopyrite and gold), which is corresponding to the geological characteristics of orogenic gold deposit.
In this study for Ph.D. dissertation divided into two parts, I report geological, geochemical and stable isotopic characteristics of these two deposit types, the Erdenetiin-Ovoo porphyry Cu-Mo deposit and orogenic gold deposits distributed in the Dzuunmod gold area. In chapter 1, I report the Cu and S isotope data of major ore minerals in the Erdenetiin Ovoo porphyry Cu-Mo deposit to (1) determine the Cu and sulfur sources from the isotopic characteristics of ore minerals, (2) understand the isotope fractionation processes during the mineralization event, and (3) discuss the implications of Cu isotope data for mineral exploration and the deposit environment in the study area. In chapter 2, the trace element composition of auriferous pyrite and arsenopyrite, sulfur isotope composition of sulfide minerals are discussed with mineralogical and petrological characteristics of ore and gangue minerals by field-, macro- and micro-scale observation results, to (1) identify the geological and (stable isotope) geochemical features of the deposit, (2) constrain the fluid and metal sources related to the gold mineralization, and (3) understand the ore- forming processes in the Dzuunmod area.
G G
Contents
Abstract --- i
㽞⪳ --- iv
Preface --- vii
Contents --- xii
List of Figure --- xiv
List of Table --- xviii
Chapter 1. Cu and S isotopic signatures of the Erdenetiin Ovoo porphyry Cu-Mo deposit, northern Mongolia: Implications for their origin and mineral exploration --- 1
Abstract --- 2
1. Introduction--- 3
2. Geological setting --- 6
2.1. Regional Geology --- 6
2.2. Deposit Geology --- 7
2.3. Age of the Deposit --- 9
3. Sample description --- 10
4. Analytical method --- 12
4.1. Cu isotope analysis --- 12
4.1.1. Pretreatment processes for Cu isotopes --- 12
4.1.2. Ion exchange chromatography for separation of Cu --- 13
4.1.3. Cu isotope analysis --- 13
4.2. S isotope analysis --- 14
5. Results --- 15
6. Discussion --- 16
6.1. The δ65Cu values of ore deposits and igneous rocks --- 16
6.2. Cu isotope data --- 20
6.2.1. The δ65Cu values of Cu sulfide minerals --- 20
6.2.2. The δ65Cu values of Cu (II) minerals --- 24
6.3. S isotope data --- 27
6.4. Implications for mineral exploration and deposit environment --- 30
7. Conclusions --- 31
G
G G
References --- 32
Chapter 2. Geological, trace elemental and stable isotopic characteristics of the Dzuunmod gold area in northern Mongolia: Constraints for formation of deposit and sources of sulfur and fluid --- 60
Abstract --- 51
1. Introduction --- 63
2. Geological setting --- 66
2.1. Regional geological setting --- 66
2.2. Deposit geological setting --- 67
2.3. Ages of the deposits --- 69
3. Samples and analytical methods --- 70
4. Characteristics of the Dzuunmod gold area --- 72
4.1. Gatsuurt deposit --- 73
4.2. Sujigtei deposit --- 74
4.3. Ereen deposit --- 75
4.4. Boroo deposit --- 75
4.5. Ulaanbulag deposit --- 76
4.6. Khargana deposit --- 76
4.7. Balj occurrence --- 77
4.8. Biluut occurrence --- 77
4.9. Paragenetic sequences --- 78
5. Trace element geochemistry --- 79
6. Stable isotope systematics --- 82
6.1. Sulfur isotope data --- 82
6.2. Oxygen isotope data --- 87
7. Implications for ore genesis and sources and Conclusions --- 89
References --- 92
Concluding Remarks --- 125
Ⴊ╆⯲# ኚ#---# 127
G G
List of Figure
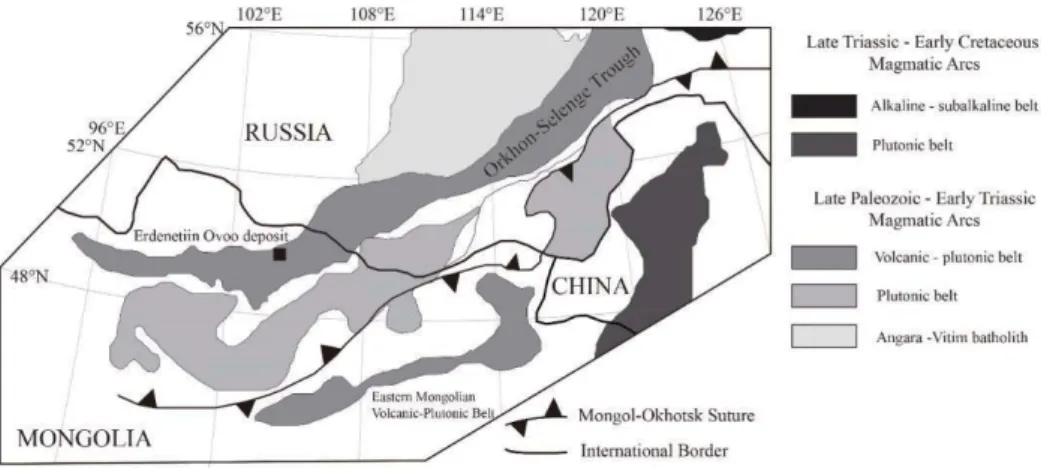
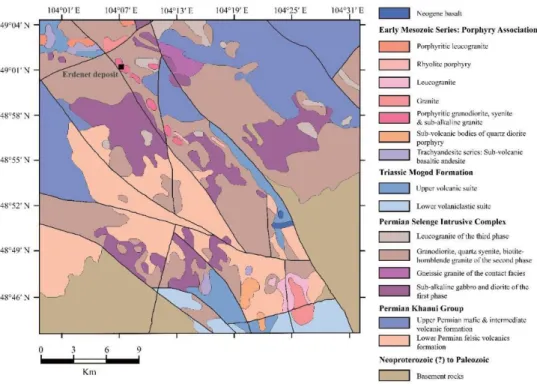
Figure 1.1. Schematic map of the Mongol-Okhotsk fold belt in northern Mongolia, southern Siberia and northern China (modified from Gerel & Munkhtsengel, 2005). --- 46 Figure 1.2. Geological map of the Erdenetiin Ovoo porphyry Cu-Mo
deposit area (modified from Gerel & Munkhtsengel, 2005).
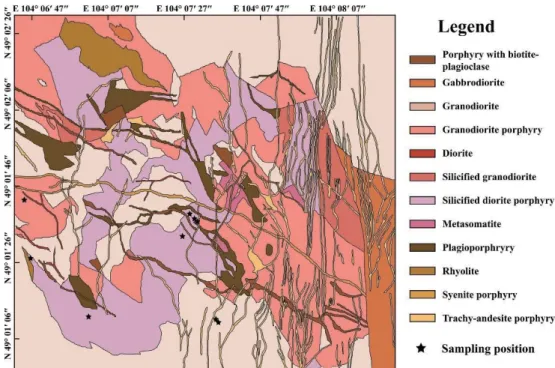
--- 47 Figure 1.3. Geological map of the open-pit mine in the Erdenetiin Ovoo
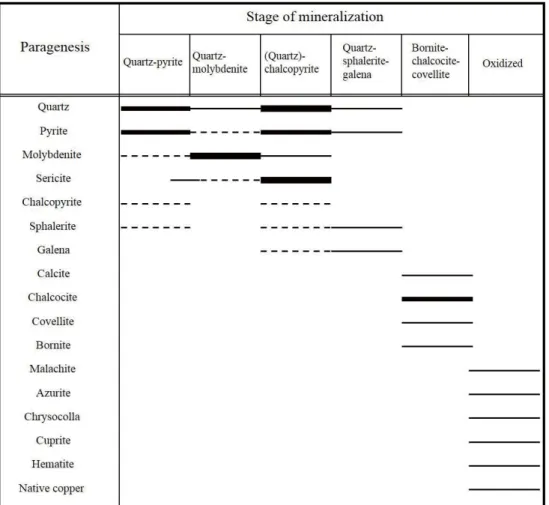
deposit and the sampling locations in this study. --- 48 Figure 1.4. Paragenetic sequences of the major ore and gangue
minerals in the Erdenetiin Ovoo deposit (modified from Gavrilova et al., 1984). --- 49 Figure 1.5. (A) & (B) General view of the open-pit mine in the
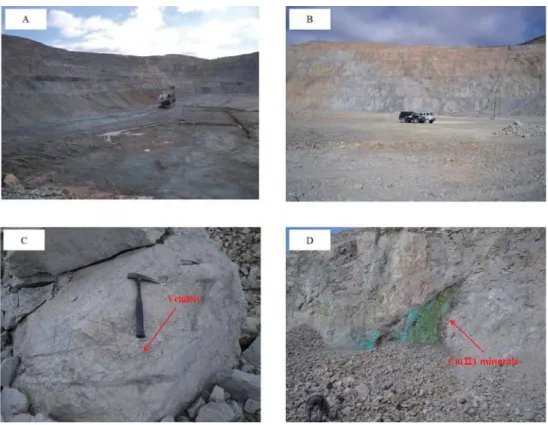
Erdenetiin Ovoo deposit, (C) the vein-let developed in the host rocks and (D) the occurrence of Cu (II) minerals. --- 50 Figure 1.6. Representative photos of micrographs of the host rocks in
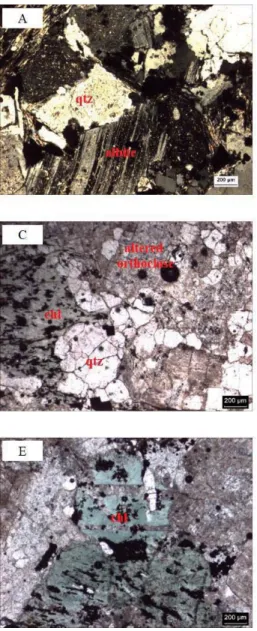
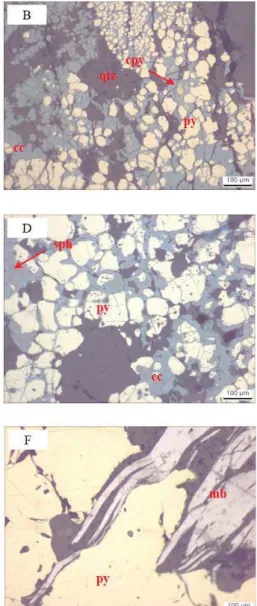
the Erdenetiin Ovoo deposit. (A) Feldspar with distinct albite twinning and quartz with isometric texture; (B) plagioclase altered to sericite; (C) chlorite, quartz and altered orthoclase; (D) & (E) chlorite altered from mafic minerals and (F) a pervasive quartz-sericite alteration assemblage. Chl: chlorite, qtz: quartz, ser: sericite. --- 51 Figure 1.7. Representative photos of micrographs of the ore minerals
in the Erdenetiin Ovoo deposit. (A) Dominant hypogene minerals such as chalcopyrite and pyrite; (B) the dominant secondary mineral, chalcocite, replacing other primary minerals; (C) hypogene minerals accompanied by sphalerite; (D) & (E) sphalerite and galena occurring with pyrite; and (F) molybdenite with quartz-molybdenite veins or quartz-pyrite veins. cc chalcocite, cpy: chalcopyrite, gn:
galena, mb: molybdenite, py: pyrite, qtz: quartz, sph:
G
G G
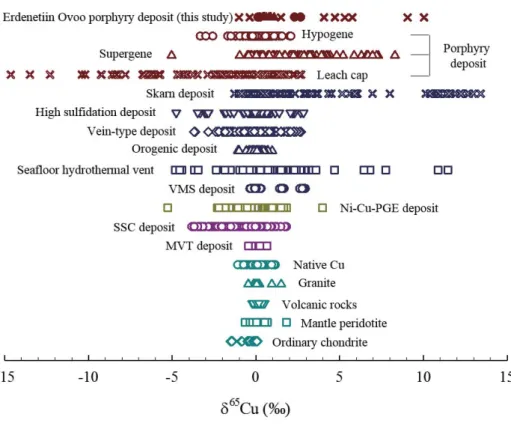
sphalerite. --- 52 Figure 1.8. The range of δ65Cu values in this study and various ore
deposits from porphyry Cu deposits (Maréchal et al., 1999;
Larson et al., 2003; Graham et al., 2004; Mathur et al., 2009; Li et al., 2010; Mathur et al., 2010; Mirnejad et al., 2010; Braxton & Mathur, 2011; Palacios et al., 2011;
Mathur et al., 2012; Mathur et al., 2013; Asadi et al., 2015;
Wu et al., 2017b), skarn deposits (Larson et al., 2003;
Graham et al., 2004; Maher & Larson, 2007; Wang et al., 2017), high sulfidation epithermal deposits (Duan et al., 2016; Wu et al., 2017a), vein-type deposits (Jiang et al., 2002; Markl et al., 2006; Haest et al., 2009; Yao et al., 2016), orogenic deposits (Molnár et al., 2016; Wang et al., 2018), seafloor hydrothermal vents (Maréchal et al., 1999;
Zhu et al., 2000; Rouxel et al., 2004; Berkenbosch et al., 2015), VMS deposits (Mason et al., 2005; Ikehata et al., 2011), Ni-Cu-PGE deposits (Zhu et al., 2000; Larson et al., 2003; Malitch et al., 2014; Ripley et al., 2015; Zhao et al., 2017), SSC deposits (Asael et al., 2007; Asael et al., 2009;
Li et al., 2010; Asael et al., 2012; Mathur et al., 2018), MVT deposits (Luczaj & Huang, 2018), and various igneous rocks such as native Cu, granite, volcanic rocks, mantle peridotite and ordinary chondrite (Luck et al., 2003; Li et al., 2009; Ikehata & Hirata, 2012; Liu et al., 2015; Huang et al., 2016). --- 53 Figure 1.9. Histogram of the δ65Cu values from the Cu ore minerals in
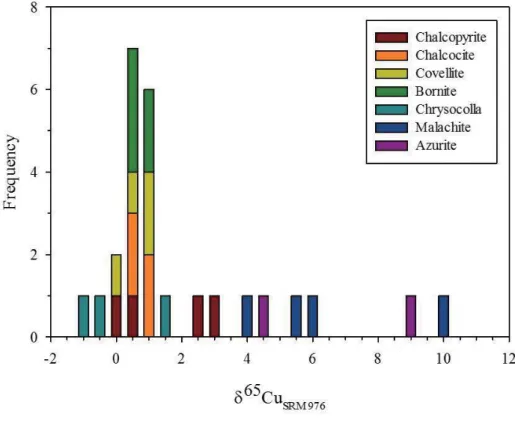
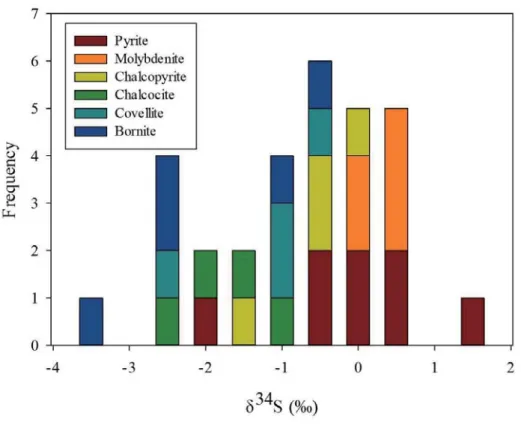
the Erdenetiin Ovoo deposit. --- 55 Figure 1.10. Histogram of the δ34S values from sulfide minerals in the
Erdenetiin Ovoo deposit. --- 56 Figure 1.11. The plot of Cu and S isotope data of major sulfide minerals
in the Erdenetiin-Ovoo porphyry Cu-Mo deposit. --- 57 Figure 2.1. Distribution of the Late Paleozoic to Early Mesozoic
G G
batholiths and belts in Mongolia and Russia (modified fromDonskaya et al., 2013). --- 103 Figure 2.2. Simplified tectonostratigraphic map of Mongolia (modified
after Badarch et al., 2002; Bussien et al., 2011). --- 104 Figure 2.3. Geological map of the North Khentii Gold Belt (NKGB) in
northern Mongolia and the distribution of major lode deposit in the area (modified from Khishgee & Akasaka, 2015). --- 105 Figure 2.4. General view of ore deposits in the study area. (a) view of
Gatsuurt deposit with Sujigtei fault, (b) & (c) host rocks, tectonic clay and siliceous rocks in the Gatsuurt deposit, (d) view of Ereen deposit with gateway of old underground mine, (e) fault-controlled gold mineralization within quartz vein in Ereen deposit, (f) view of open-pit mine in Boroo deposit, (g) & (h) host rocks and NE-trending fault in Balj occurrence, (i) view of Ulaanbulag deposit. --- 106 Figure 2.5. Representative photos of the core rocks. (a) sulfidized
granite in the Central zone, (b) rhyolite dike with quartz veins in the Main zone, (c) diorite influenced by siliceous alteration, (d) granite with K-feldspar and mafic minerals, (e) silicified granite & (f) quartz vein in granite in Gatsuurt deposit, (g) sulfidized rhyolite & (h) siliceous alteration with quartz veins in Sujigtei deposit, (i) altered rhyolite with quartz vein in Ereen deposit, (j) silicified granite in Boroo deposit, (k) quartz veinlet with sulfide grain in granite in Ulaanbulag deposit, (l) quartz veins in sandstone in Balj occurrence. --- 107 Figure 2.6. Representative reflected-light photomicrographs and BSE
images of sulfide minerals and native gold in Dzuunmod gold area. (a) & (b) pyrite and arsenopyrite in disseminated and stockwork type, (c) native gold with galena, (d) pyrite and arsenopyrite with sphalerite & (e) native gold, pyrite,
G
G G
arsenopyrite and sphalerite in quartz vein type in Gatsuurt deposit, (f) pyrite, galena and sphalerite & (g) native gold grain within pyrite grain in Sujigtei deposit, (h) pyrite and arsenopyrite in Boroo deposit. PY: pyrite, ASP:
arsenopyrite, SPH: sphalerite, GN: galena. --- 108 Figure 2.7. Mineral paragenetic sequences of the Gatsuurt deposit and
Boroo deposit modified from Khishgee et al. (2014) and Khishgee and Akasaka (2015). --- 110 Figure 2.8. Au-As diagram with Au solubility line defined by Reich et
al. (2005) and plots of pyrite and arsenopyrite from Gatsuurt, Boroo and Sujigtei deposit. --- 111 Figure 2.9. Histogram of sulfur isotope composition (δ34S) of pyrite
and arsenopyrite in the Dzuunmod gold area. --- 112 Figure 2.10. Temperature – logfS2 diagram presenting arsenopyrite and
pyrite stability field with at. % As in the Fe-As-S system (after Kretschmar and Scott, 1976). The average As content of arsenopyrite in quartz vein samples (29.2 at. % As) is plotted in the diagram. Asp: arsenpyrite, Py: pyrite, Lö:
Loellingite, Po: Pyrrhotite, As: arsenic, L: sulfur-arsenic liquid. --- 113 Figure 2.11. δ18O values of several geologically important fluid sources
(Sheppard, 1986), typical orogenic and magmatic- hydrothermal gold deposits (Taylor, 1987; McCuaig &
Kerrich, 1998; Goldfarb et al., 2005; Goldfarb & Groves, 2015; Ding et al., 2016; Zhang et al., 2018) and calculated ore-forming fluids from measured δ18O of quartz in this study. --- 114
G G
List of Table
Table 1.1. Column chromatography separation procedure for Cu isotope analysis. --- 58 Table 1.2. Cu and S isotope compositions of ore minerals from the
Erdenetiin Ovoo porphyry Cu-Mo deposit. AZ: azurite, BN: bornite, CC: chalcocite, CH: chrysocolla, CPY:
chalcopyrite, CV: covellite, MC: malachite, MB:
molybdenite, PY: pyrite. --- 59 Table 2.1. Summary of geological characteristics of gold deposits and
occurrences in the Dzuunmod area. --- 115 Table 2.2. Sulfur isotope compositions of pyrite and arsenopyrite with
mineralization type and host rock in the Dzuunmod gold area. --- 116 Table 2.3. Oxygen isotope composition (δ18O) of quartz samples from
Au-bearing quartz veins, disseminated and stockwork, and silica type ores and calculated δ18O values of ore-forming fluid in the Dzuunmod gold deposits. --- 118 Table S.2.1. EPMA data of sulfides in the Dzuunmod gold area. The ‘-’
indicates the below detection limit. --- 119
G
G XG
#
* Chapter 1. Cu and S isotopic signatures of the Erdenetiin Ovoo porphyry Cu-Mo deposit, northern
Mongolia: Implications for their origin and mineral exploration G
* Parts of this chapter has been published in Ore Geology Reviews as a research article by Yeongmin Kim, Insung Lee, Sodnom Oyungerel, Luvsanchultem Jargal and Tserenjav Tsedenbal.
G
G YG Abstract
The copper (δ65Cu) and sulfur (δ34S) isotope compositions of ore minerals from the Erdenetiin Ovoo porphyry Cu-Mo deposit in northern Mongolia were measured.
The δ65Cu values of Cu (I) sulfide minerals ranged from 0.14 ‰ to 2.69 ‰, suggesting that Cu predominantly originated from magmatic sources, whereas Cu (II) minerals such as chrysocolla, malachite and azurite presented much larger variations of δ65Cu values from -1.01 ‰ to 10.0 ‰. The small difference between the primary and secondary Cu sulfide minerals indicates an insignificant influence of Cu isotope fractionation processes during their formation, which may be explained by large mass transport and/or the involvement of biogenic activities. The δ65Cu values of primary chalcopyrite suggest source heterogeneity and/or the occurrence of isotope fractionation under a high-temperature environment. The positive ΔCu (II) mineral – Cu (I) mineral values imply little transport of Cu in the deposit, with a rough mass balance and fast redox reaction.
The δ34S values of the primary sulfide minerals (pyrite, molybdenite and chalcopyrite) clustered near 0 ‰, indicating that the sulfur is mainly derived from a homogeneous magmatic source. By contrast, the δ34S values of secondary Cu sulfide minerals ranged from -3.2 ‰ to -0.3 ‰, with an average of -1.6 ‰. The lower δ34S values are likely influenced by either S isotope fractionation processes or input of sulfur with different S isotope compositions during their formation.
The measured δ65Cu and δ34S values of these ore minerals suggest a large mass transportation of Cu to an adjacent location, indicating little possibility of a hidden Cu occurrence in the Erdenetiin Ovoo deposit area
Keywords: Erdenetiin Ovoo deposit, Cu isotope, S isotope, Porphyry Cu-Mo deposit, Mongolia
G
G ZG
1. Introduction
The transition metal copper (Cu) has two stable isotopes, 63Cu (69.15%) and
65Cu (30.85%) (de Laeter et al., 2003). Cu is widely utilized in both abiotic and biotic mechanisms in natural systems (e.g., Beard et al., 2004; Stürup et al., 2008; Weiss et al., 2008), but early works measuring Cu isotope composition reported a large analytical error of up to 1.5 ‰ by Thermal Ionization Mass Spectrometry (TIMS) due to its high ionization energy (Walker et al., 1958; Shields et al., 1965). This poor analytical precision has restricted the application of Cu isotope analysis in many research fields for several decades. However, improvements in analytical instruments have enabled the measurement of Cu isotopes with greater precision better than 0.2 ‰ by Multi Collector-Induced Coupled Plasma-Mass Spectrometry (MC-ICP-MS) (Maréchal et al., 1999; Zhu et al., 2000).
Because the Cu isotope composition in the ore-forming environment may provide direct evidence of its sources and fluid movement, the Cu isotope ratios (65Cu/63Cu) of Cu minerals in various ore deposits have been increasingly studied to understand Cu isotope fractionation processes and determine the origin of Cu as well as ore deposits (Larson et al., 2003; Ehrlich et al., 2004; Graham et al., 2004; Rouxel et al., 2004; Mathur et al., 2005; Markl et al., 2006; Asael et al., 2007; Maher &
Larson, 2007; Wall et al., 2007; Mathur et al., 2009; Li et al., 2010; Berkenbosch et al., 2015; Ripley et al., 2015; Duan et al., 2016; Wang et al., 2017; Wu et al., 2017a;
Wu et al., 2017b; Luczaj & Huang, 2018). Especially, porphyry Cu systems exhibit a much larger range of 65Cu/63Cu ratios than other Cu deposit types, mainly due to the relatively large Cu isotope fractionation during redox reactions in low- temperature environments and therefore provide valuable information on deposit origins and the ore-forming environment(Larson et al., 2003; Graham et al., 2004;
G [G
Mathur et al., 2009; Li et al., 2010; Palacios et al., 2011; Wu et al., 2017b).
Differences in Cu isotope composition among Cu ore minerals may be a useful indicator for identifying the type (primary and secondary) of Cu ore minerals (Mathur et al., 2012; Mathur et al., 2013; Duan et al., 2016; Wu et al., 2017b; Mathur et al., 2018). Recently, Mathur et al. (2018) insisted that the classification of chalcocite based on Cu isotope composition could help to improve the mineralization models. Furthermore, several studies have suggested that the Cu isotopic gap between Cu (I) and Cu (II) mineral pairs can be used to evaluate the significance of Cu transport at the deposit scale and, in turn explore unrevealed Cu occurrence (Markl et al., 2006; Asael et al., 2007; Mathur et al., 2009).
The sulfur (S) isotope composition (34S/32S) of sulfide minerals in ore deposits has been used to constrain sulfur sources and evaluate the evolution of sulfur species in hydrothermal fluids (Ohmoto, 1972, 1979; Taylor, 1987; Seal et al., 2000; Seal, 2006). The 34S/32S ratio of sulfide minerals in porphyry Cu systems usually shows a signature of mantle-derived sulfur sources (e.g., Taylor, 1987; Seal, 2006; Wilson et al., 2007 and references therein), whereas the increase in oxidized sulfur species in the hydrothermal fluid lowers the 34S/32S ratio due to isotope fractionation between the oxidized and reduced species (Rye, 1993; Seal et al., 2000; Rye, 2005; Seal, 2006). For example, Khashgerel et al. (2006) suggested that the low 34S/32S ratio of sulfide minerals in the Oyu Tolgoi porphyry Cu systems is attributable to the oxidizing condition of the hydrothermal fluid.
The Erdenetiin Ovoo deposit, one of the largest porphyry Cu-Mo deposits in Mongolia, is located in northern Mongolia near the city of Erdenet in the central part of Orkhon Province and 384 km northwest of Ulaanbaatar. The deposit was first discovered in 1964 and started to be mined in 1978 (Gerel et al., 2005; Gerel &
G
G \G
Munkhtsengel, 2005). According to a United States Geological Survey (USGS) report, the Erdenetiin Ovoo deposit has 1780 million metric tons (Mt) of ore at 0.62 wt % Cu and 0.015 wt % Mo, with metal reserves of 11 Mt Cu and 0.162 Mt Mo (Singer et al., 2008). Based on the suggested classification of Cu deposits by Yakubchuk et al. (2012), the Erdenetiin Ovoo deposit is defined as a giant Cu deposit containing more than 10 Mt Cu.
Due to its large deposit size and tonnage and economical importance to Mongolian industry, many studies of its geological characteristics, geochemical features, ore-forming processes and formation age have been conducted since the discovery and exploitation of the deposit(Khasin et al., 1977; Koval et al., 1982;
Gavrilova et al., 1984, 1990; Sotnikov et al., 1995; Dejidmaa & Naito, 1998; Gerel, 1998; Watanabe & Stein, 2000; Gerel et al., 2005; Gerel & Munkhtsengel, 2005;
Berzina & Sotnikov, 2007; Kavalieris et al., 2017). Several radiogenic isotopic analyses were also conducted to identify the age of magmatic intrusion and mineralization of the deposit (Sotnikov et al., 1995; Berzina et al., 1999; Watanabe
& Stein, 2000; Kavalieris et al., 2017), but few stable isotopic studies of ore minerals, which can provide direct evidence of metal sources and formation processes as well as the potential presence of hidden Cu occurrences, have been performed.
In this study, we report the Cu and S isotope data of ore minerals in the Erdenetiin Ovoo porphyry Cu-Mo deposit to (1) determine the Cu and sulfur sources from the isotopic characteristics of ore minerals, (2) understand the isotope fractionation processes during the mineralization event, and (3) discuss the implications of Cu isotope data for mineral exploration and the deposit environment in the study area.
G ]G
2. Geological setting 2.1 Regional Geology
The Late Permian to Early Triassic Orkhon-Selenge trough included in the Mongolian subprovince, one of seven Cu belts in Central Asia, is part of the active margin of the Siberian craton (Yakubchuk et al., 2012). It is located between the Siberian craton, where Late Paleozoic to Mesozoic subduction-related volcanism was recorded (Watanabe & Stein, 2000; Yakubchuk et al., 2012), and the central Mongolian blocks consisting of three massifs with different Precambrian rocks (Fig.
1.1). The single large Amurian Massif was constructed by the amalgamation of these massifs during the Mesozoic and separation from the Siberian craton by the Mongol- Okhotsk Ocean (Gerel & Munkhtsengel, 2005). During the Late Paleozoic to Mesozoic, the Mongol-Okhotsk Ocean was closed and subducted northward beneath the Siberian craton (Watanabe & Stein, 2000; Gerel & Munkhtsengel, 2005; Windley et al., 2007b). They suggested that this collision and subduction was terminated in the Middle Jurassic within Mongolia and caused uplift of the Khangai-Khentii highlands, including the Orkhon-Selenge trough. The Erdenetiin Ovoo deposit is located 320 km from the subduction zone and occupies the southern boundary of the Khangai-Khentii highlands.
The Orkhon-Selenge trough is filled with Permian to early Mesozoic volcanogenic sedimentary rocks and mid to upper Triassic and Jurassic volcanic rocks as shown in Fig. 1.2. The Permian volcanic rocks, which belong to the Khanui Group, overlie the basement rocks consisting of Neoproterozoic metamorphic rocks, a Paleozoic sedimentary sequence, Devonian granitoids and non-intrusive rocks (Gerel & Munkhtsengel, 2005). The Khanui Group is composed of an upper Permian mafic and intermediate volcanic formation and a lower Permian felsic volcanic
G
G ^G
formation overlain by volcaniclastics and mafic volcanics (Fig. 1.2).
The Erdenetiin Ovoo deposit is hosted by a Late Permian Selenge intrusive complex consisting of granite, gabbro and diorite (Gerel, 1998; Watanabe & Stein, 2000; Gerel & Munkhtsengel, 2005; Berzina & Sotnikov, 2007) (Fig. 1.3). Gerel and Munkhtsengel (2005) divided the Selenge intrusive complex into three (early, main and last) phases. The early phase ranges from diorite to monzonite, including gabbrodiorite, diorite, syenodiorite, monzonite and quartz-monzonite. The main phase comprises granitoids such as granosyenite, granodiorite and leucocratic granite, whereas the last phase is dominated by leucogranite and granite. The Selenge complex was subsequently intruded by the Late Permian to Early Triassic Erdenet porphyry complex, which is mainly composed of diorite and granodiorite ranging from gabbrodiorite to granodiorite and granite (Dejidmaa & Naito, 1998; Watanabe
& Stein, 2000; Gerel & Munkhtsengel, 2005). Dejidmaa and Naito (1998) divided the Erdenet porphyry complex into three stages: the diorite porphyry complex, granodiorite porphyry complex and granodiorite associated with breccia. Gerel and Munkhtsengel (2005) also reported that the Erdenet porphyry complex associated with mineralization consists of subvolcanic and explosive stocks, including porphyritic quartz-diorite, diorite, quartz-syenite, granodiorite, granite and leucogranite. The syenite porphyry dikes and the porphyries associated with trachyte-trachyandesite-alkaline basalt series intrude the Selenge intrusive and Erdenet porphyry complex (Watanabe & Stein, 2000; Gerel & Munkhtsengel, 2005).
2.2 Deposit Geology
The Erdenetiin Ovoo ore district occurs within a 20–25-km-diameter structure embracing numerous intrusive centers with dykes and altered granodiorite stocks,
G _G
and the ore body of the deposit is located in an area of 2 × 1 km (Fig. 1.3). The Cu- Mo mineralization in the Erdenetiin Ovoo ore district is associated with the Erdenet porphyry complex consisting of quartz-diorite, granodiorite porphyry and granite porphyry, and the ore-bearing stockwork intrudes the Selenge intrusive complex, including granodiorite, granite and quartz-syenite (Watanabe & Stein, 2000; Gerel
& Munkhtsengel, 2005). The mineralization of the deposit is related to the subvertical and pipe-like late Triassic granodiorite porphyry, where disseminated and vein-controlled mineralization developed (Gerel & Munkhtsengel, 2005). The weak potassic alteration zone with feldspar veins occurs in the host rocks, whereas the subsequent quartz-sericite alteration overprints the vein assemblages and appears to be responsible for the Cu-Mo mineralization (Watanabe & Stein, 2000; Gerel &
Munkhtsengel, 2005). The widespread quartz-sericite alteration shows the replacement of feldspar by white mica (Gerel et al., 2005). The major ore minerals are pyrite, molybdenite, chalcopyrite, chalcocite and bornite occurring in veinlets and/or disseminated within the host rocks (Watanabe & Stein, 2000).
Zonation of both the major ore minerals and alteration is well-developed within the deposit (Gerel et al., 2005; Gerel & Munkhtsengel, 2005). Pyrite occurs mainly on the periphery and high-grade chalcopyrite-chalcocite-bornite ores are present in the core (Gerel & Munkhtsengel, 2005). Sericitic (quartz-sericite), intermediate argillic (chlorite-sericite) and prophylitic (chlorite and epidote-chlorite) alteration zones occur from the core to the periphery in the deposit (Gerel et al., 2005). A 30- to 300-m-thick secondary Cu enrichment blanket of a bornite-chalcocite-covellite assemblage is developed in the supergene zone at the top and overlain by native Cu and Cu oxides such as malachite, azurite and cuprite (Watanabe & Stein, 2000; Gerel
& Munkhtsengel, 2005).
G
G `G
The mineralization and alteration stages of the Erdenetiin Ovoo deposit have been investigated by several researchers. Watanabe and Stein (2000) introduced the successive mineralization stages of the deposit from the study of Jargalsaihan (1996) as follows: (1) magnetite, (2) pyrite-quartz, (3) molybdenite-quartz, (4) chalcopyrite- pyrite-quartz, (5) pyrite, (6) pyrrhotite-chalcopyrite ± cubanite, (7) chalcocite- bornite and (8) galena-sphalerite-tennantite. In addition, Gerel and Munkhtsengel (2005) incorporated the paragenetic sequence of ore minerals of the Erdenetiin Ovoo deposit from previous studies (Khasin et al., 1977; Gavrilova et al., 1984, 1990) and described the integrated mineralization stages: (1) quartz-sericite, (2) quartz- chalcopyrite-pyrite, (3) quartz-pyrite-molybdenite-chalcopyrite, (4) quartz- chalcopyrite-tennantite, (5) quartz-pyrite-galena-sphalerite, (6) bornite-chalcocite- covellite, and (7) gypsum-calcite-pyrite. They classified it as the first pre-ore stage, followed by four ore stages, one Cu-enriched secondary stage and the last post-ore stage.
Despite slight differences among these studies, the paragenetic mineral association is usually divided into five mineralization stages as follows: quartz-pyrite, quartz-molybdenite, (quartz)-chalcopyrite, quartz-sphalerite-galena (polymetallic), and bornite-chalcocite-covellite (secondary enrichment zone) (Khasin et al., 1977;
Gavrilova et al., 1984; Gerel & Munkhtsengel, 2005). The paragenetic sequences of the major ore and gangue minerals are presented in Fig. 1.4.
2.3 Age of the Deposit
Age dating results of both complexes have been reported in several studies, primarily the study of Sotnikov et al. (1995). The K-Ar age of the Selenge intrusive complex ranges from 290 to 260 Ma, and the biotite from the Erdenet porphyry
G XWG
complex shows K-Ar age results of approximately 250 Ma and 230 Ma (Sotnikov et al., 1995). They suggested that these results represent the occurrence of two-stage magmatism. The similar age dating results obtained by the Rb-Sr method also indicated two-stage magmatism, with ages of 253 ± 18 Ma, 252 ± 11 Ma and 248
±17 Ma for the first stage and 229 ± 14 Ma, 223 ±9 Ma and 220 ±7 Ma for the second stage (Sotnikov et al., 1995; Berzina et al., 1999). Gerel and Munkhtsengel (2005) introduced other age dating results for the K-Ar method of the granite from the Erdenet porphyry complex ranging from 245 to 226 Ma and from 226 to 221 Ma.
40Ar/39Ar age dating studies were conducted on the plagioclase (225 ± 7 Ma by Berzina et al. (1999)) and on the sericite (207 ± 5 Ma by Lamb and Cox (1998).
Watanabe and Stein (2000) reported Re-Os ages of the molybdenite from the Erdenetiin Ovoo deposit of 240.7 ± 0.8 and 240.4 ± 0.8 Ma for the primary mineralization processes. They insisted that these results were significantly older than the 40Ar/39Ar ages, which might be attributed to a reset of the 40Ar/39Ar ages during hydrothermal events. A recent study by Kavalieris et al. (2017), however, reported new 40Ar/39Ar age dating results for muscovite of 239.7 ±1.6 and 240 ± 2.0 Ma, very close to the previous Re-Os ages.
3. Sample descriptions
Representative rock and ore samples were collected from the open pit of the Erdenetiin Ovoo deposit, including various ore minerals within the veinlet or disseminated (Fig. 1.5A). Most of the sampling positions are composed of granodiorite, granodiorite porphyry and silicified diorite porphyry associated with major mineralization processes (Fig. 1.5B). The collected granodiorite porphyry samples are composed of altered granodiorite with quartz veins and ore-bearing
G
G XXG
stockwork associated with the Erdenet porphyry complex (Fig. 1.5C). Cu-oxide minerals such as malachite, azurite and chrysocolla are also well-developed (Fig.
1.5D). Feldspar with distinct albite twinning occurs, and quartz shows an isometric and anhedral texture. (Fig. 1.6-A). Due to the secondary alteration, polysynthetic twinning of plagioclase is not clear where intensive alteration to sericite occurs (Fig.
1.6B). Plagioclase with andesine composition is widely tabular and prismatic in shape and changes slightly to sericite (Fig. 1.6C). Chlorite seems to be intensively altered from mafic minerals such as hornblende and biotite (Fig. 1.6C-E). A pervasive quartz-sericite alteration composed of quartz, sericite and pyrite is well- developed (Fig. 1.6F) and overprints the previous potassium alteration.
The oxidized leach cap zone has already been eroded, and mining processes are in progress at the secondary sulfide enrichment zone in most areas of the deposit.
This zone develops from 1325 m to 1310 m and from 1250 m to 1235 m where the rocks samples were collected.
Pyrite, the most common sulfide mineral, is isometric with sizes up to several millimeter scale and is associated with other ore and silicate minerals such as quartz and sericite (Fig. 1.7A). The dominant hypogene Cu sulfide mineral in the deposit is a chalcopyrite accompanied by quartz-pyrite or chalcocite-bornite-covellite (Fig.
1.7A-C). Other Cu sulfide minerals, such as bornite and covellite, are widespread. A supergene enrichment zone is a high-grade zone up to 300 m thick and dominated by secondary chalcocite replacing the other sulfide minerals. It is superimposed on pyrite and chalcopyrite (Fig. 1.7A-C). Bornite and covellite also overprint the pyrite and chalcopyrite intergrowth with chalcocite. Sphalerite and galena occur with quartz-pyrite-chalcopyrite or quartz-molybdenite (Fig. 1.7C-E). Another major sulfide ore mineral, molybdenite, is associated with quartz-molybdenite veins or
G XYG
quartz-pyrite (Fig. 1.7F) prior to the dominant Cu mineralization processes.
Molybdenite occurs rarely in association with chalcopyrite.
4. Analytical methods
Polished sections of rock and ore samples were prepared for microscopic observation of silicate and ore minerals. Pyrite, molybdenite and Cu ore minerals for Cu and S isotope analysis were separated manually under a binocular microscope after crushing the ore-bearing rocks.
4.1 Cu isotope analysis
All chemical procedures to pretreat and purify the Cu ore samples we report below were performed in a clean room (Class 100) at the Korea Basic Science Institute (KBSI) in Ochang, South Korea. Double-distilled MQ water and reagents including nitric acid (HNO3), hydrochloric acid (HCl) and hydrofluoric acid (HF) were used.
4.1.1 Pretreatment processes for Cu isotopes
Approximately 0.1 g of manually separated Cu ore minerals were placed in a Teflon beaker and digested with 8 mL of a mixture of HNO3 and HF in a ratio of 3:5 (v/v) at 180–200 °C. After completing the dissolution of the samples, 5 mL of 6 N HCl was added to eliminate the precipitated silicon tetrafluoride (SiF4). Then, the solution was dried and diluted with 5% HNO3 to analyze the Cu concentration by Inductively Coupled Plasma-Optical Emission Spectrometry (ICP-OES, PerkinElmer Optima 8300).
G
G XZG
4.1.2 Ion exchange chromatography for separation of Cu
We followed the protocol of Cu separation by anion exchange chromatography outlined by Maréchal et al. (1999). To separate Cu from solution, chromatography columns (Poly-Prep® from Bio-rad company, 0.8 x 4 cm) with anion exchange resin (AG® MP-1M, 100-200 mesh) were used. The column was cleaned with 10 % HCl and filled with 2 mL (approximately 1.2 g) of anion exchange resin. The resin was cleaned 3 times with 7 mL of 0.5 N HNO3, 5 mL of 7 N HCl and 2 mL of distilled water sequentially to remove fine particles within the resin. Then, the resin was conditioned with 6 mL of 7 N HCl + 0.001 % hydrogen peroxide (H2O2). After loading on the resin with a mixture of 0.5 mL of 7 N HCl + 0.001 % H2O2, the sample was adsorbed onto the resin by adding another mixture of 0.5 mL of 7 N HCl + 0.001 % H2O2. The matrix was removed in 10 mL of 7 N HCl + 0.001 % H2O2, and then Cu was eluted with 24 mL of 7 N HCl + 0.001 % H2O2. The procedures for column chromatography separation are described in Table 1.
To identify the efficiency of Cu separation by ion exchange chromatography, an ICP multi-elements standard solution (AccuTraceTM reference standard) and two United States Geological Survey (USGS) geological reference materials with relatively high Cu concentrations (BHVO-2 and BIR-1a) were tested. The recovery rates of the materials were higher than 95 % and the total procedural blank was 0.93 ng, which is typically less than 0.1% of loaded Cu (approximately 1 μg) in the measured samples.
4.1.3 Cu isotope analysis
The Cu isotope composition of the ore samples was measured on the MC-ICP- MS (Neptune, Thermo Scientific) at KBSI in Ochang. A sample-standard bracketing
G X[G
(SSB) method was utilized to constrain and correct the instrumental mass fractionation. The Cu isotopic ratios of the measured samples were reported in δ notation relative to the international Cu standard material (ERM®-AE647) used as an operating standard material as follows:
δ65Cu(ERM®-AE647) = [(65Cu/63Cu)sample - (65Cu/63Cu)(ERM®-AE647)]/(65Cu/63Cu)(ERM®- AE647)
Typically, δ65Cu(ERM®-AE647) values are reported in per mil (‰, parts per thousand) which means that δ-value obtained by above equation are then multiplied by 1000.
Most previously reported Cu isotope values (δ65Cu) have been relative to another international Cu standard material (NIST SRM976), and δ65Cu(SRM 976) differs from δ65Cu(ERM®-AE647) by approximately 0.21 ‰ (Moeller et al., 2012). The measured δ65Cu(ERM®-AE647) value was calibrated to the δ65Cu(SRM 976) value using the following equation:
δ65Cu(NIST SRM976) (‰) = δ65Cu(ERM®-AE647) (‰) + 0.21 ‰
4.2 S isotope analysis
The manually selected sulfide minerals were prepared as a powder within an agate cleaned with acetone and distilled water. The powder was placed into a 3.5 × 5 mm tin-foil cup and combusted within a combustion tube packed with reagent materials at 1030 °C in the Elemental Analyzer (EA). The reagent column was composed of 0-1 cm quartz wool, 1-7 cm quartz chips, 7-7.5 cm quartz wool, 7.5-14 cm 0.5-mm ultrahigh purity Cu wire, 14-14.5 cm quartz wool, 14.5-16.5 cm quartz chips, 16.5-17 cm quartz wool, 17-18.5 cm quartz chips and 18.5-19.5 cm quartz wool. The S isotopic ratio was measured by Continuous Flow (CF)-EA-IRMS (IsoPrime-EA) at the School of Earth and Environmental Sciences, Seoul National
G
G X\G
University. The standard material, IAEA Ag2S standard S-1, was bracketed within the samples and analyzed with the same procedure. The results were calculated by linear regression of the standards, and the S isotope composition of the samples is reported using δ-notation relative to the Vienna-Canyon Diablo Troilite (V-CDT) as follows:
δ34S(V-CDT) = [(34S/32S)sample - (34S/32S)(V-CDT)]/(34S/32S)(V-CDT)
Typically, δ34S(V-CDT) values are reported in per mil (‰, parts per thousand) which means that δ-value obtained by above equation are then multiplied by 1000.
All samples and standards were analyzed in duplicate, and the external reproducibility for long-term analyses was better than ± 0.2 ‰.
5. Results
The measured Cu isotope compositions (δ65Cu) of major Cu minerals from the Erdenetiin Ovoo porphyry Cu-Mo deposit are given in Table 2. The δ65Cu values of Cu ore minerals range from -1.01 ‰ to 10.0 ‰. The δ65Cu values of Cu (I) sulfide minerals have an average value of 0.82 ‰, with an overall variation of 2.55 ‰. Cu (II) minerals such as malachite and azurite show higher average values (6.88 ‰ and 6.29 ‰, respectively), whereas chrysocolla has a relatively low δ65Cu value of 0.04
‰. The δ65Cu values of chalcopyrite range from 0.14 ‰ to 2.69 ‰, with a slightly higher average value (1.35 ‰), and other Cu (I) sulfide minerals, such as bornite, chalcocite and covellite, have lower and narrow δ65Cu ranges clustering near 0.6 ‰ (Table 2).
The S isotope compositions (δ34S) of sulfide minerals range from -3.2 ‰ to 1.3
‰, with an average of -0.8 ‰ (Table 2). The Cu sulfide minerals show slightly lower δ34S values, including -0.5 ‰ for chalcopyrite, -1.1 ‰ for covellite, -1.7 ‰ for
G X]G
chalcocite and -2.0 ‰ for bornite on average, whereas pyrite and molybdenite have average values of -0.1 ‰ and 0.5 ‰, respectively.
6. Discussion
6.1. The δ65Cu values of ore deposits and igneous rocks
Cu isotope compositions of Cu ore minerals have been reported since the 2000s, revealing distinct δ65Cu values depending on the deposit types, which are in turn related to the origin of Cu and the formation processes. The δ65Cu values of Cu sulfide minerals from magmatic and hydrothermal deposits where Cu is considered to be derived from mantle sources and preserve its magmatic signature cluster around 0 ‰, similar to the δ65Cu values of mantle sources of 0.06±0.20 ‰ (2SD), which has been suggested as the δ65Cu value of bulk silicate Earth (BSE) by Liu et al. (2015).
The hypogene Cu minerals from the porphyry deposit show δ65Cu values ranging from -3.31 ‰ to 2.28 ‰ but mostly clustering from -1 ‰ to 1‰, as shown in Fig.
1.8 (Maréchal et al., 1999; Larson et al., 2003; Mathur et al., 2009; Li et al., 2010;
Mirnejad et al., 2010; Braxton & Mathur, 2011; Palacios et al., 2011; Mathur et al., 2012; Mathur et al., 2013; Wu et al., 2017b; Mathur et al., 2018). The Cu minerals from Ni-Cu-PGE deposits and volcanic-associated massive sulfide (VMS) deposits have δ65Cu values ranging from -5.26 ‰ to 3.98 ‰ (Zhu et al., 2000; Larson et al., 2003; Malitch et al., 2014; Ripley et al., 2015; Zhao et al., 2017) and from -0.34 ‰ to 2.97 ‰, respectively (Mason et al., 2005; Ikehata et al., 2011).
The Cu isotope composition of magma has been researched by measuring the δ65Cu values of ordinary chondrite, native Cu and igneous rocks such as granite, volcanic rocks and ultramafic/mafic rocks (Luck et al., 2003; Li et al., 2009; Ikehata
& Hirata, 2012; Dekov et al., 2013; Liu et al., 2015; Savage et al., 2015; Huang et
G
G X^G
al., 2016; Baggio et al., 2018). These rocks present a very narrow range of δ65Cu values from -0.51 ‰ to 0.10 ‰ in ordinary chondrite(Luck et al., 2003), from -1.07
‰ to 1.18 ‰ in native Cu(Dekov et al., 2013; Baggio et al., 2018), from -0.46 ‰ to 1.51 ‰ in granite(Li et al., 2009), from -0.22 ‰ to 0.51 ‰ in volcanic rocks(Liu et al., 2015; Huang et al., 2016) and from -0.64 ‰ to 1.82 ‰ in ultramafic/mafic rocks (Ikehata & Hirata, 2012; Liu et al., 2015). In particular, MORBs and OIBs exhibit a narrow δ65Cu range from -0.18 ‰ to 0.21 ‰ (Liu et al., 2015; Savage et al., 2015;
Huang et al., 2016). The non-metasomatized peridotites have an overlapping range with MORBs and OIBs from -0.15 ‰ to 0.18 ‰ (Liu et al., 2015), representing a homogeneous Cu isotope composition of the mantle source.
Several studies have shown insignificant Cu isotope fractionation during magmatic processes such as mantle partial melting, magma differentiation and fractional crystallization under high-temperature conditions (Li et al., 2009; Ikehata
& Hirata, 2012; Huang et al., 2016), indicating that the Cu isotope of fresh igneous rocks maintains its homogeneous magmatic signature during their formation. Li et al. (2009) reported tight clustering of δ65Cu values near 0 ‰ for I-type granites (0.03±0.15 ‰, 2SD) and suggested a homogeneous mantle source and insignificant fractionation processes for the Cu isotope. By contrast, the S-type granites span more variable δ65Cu values (-0.03±0.42 ‰, 2SD), reflecting the heterogeneous Cu isotope composition of sedimentary sources (Li et al., 2009). Similarly, the δ65Cu values of the arc and continental basalts and the metasomatized peridotites range from -0.19
‰ to 0.47 ‰ and from -0.64 ‰ to 1.82 ‰, respectively (Liu et al., 2015). This wider variation of δ65Cu values was considered to reflect the involvement of crustal materials with their Cu isotopic heterogeneity due to redox and hydrothermal processes (Li et al., 2009; Liu et al., 2015). The heterogeneous Cu isotope
G X_G
composition of sedimentary reservoirs is considered to be attributable to the variable δ65Cu values of the sediment-hosted stratiform copper (SSC) deposit from -3.44 ‰ to 1.85 ‰ (Fig. 1.8), although other conditions, such as redox reactions, variation of Eh and pH can also affect the δ65Cu values of Cu minerals in this deposit type (Asael et al., 2007; Asael et al., 2009; Asael et al., 2012; Mathur et al., 2018).
Some previous studies of hypogene ore deposits have revealed distinct δ65Cu variations under high-temperature magmatic and hydrothermal processes, especially the Cu isotope fractionation process due to its partitioning into vapor and liquid phases during phase separation or fluid boiling (Seo et al., 2007; Li et al., 2010;
Maher et al., 2011; Yao et al., 2016; Wu et al., 2017a). Quantum chemical calculations (Seo et al., 2007) and experimental (Li et al., 2010; Maher et al., 2011) studies, however, indicated opposite Cu isotope fractionation pathways. The former suggested preferential partitioning of the heavier Cu isotope (65Cu) into the vapor phases, such as Cu3Cl3, whereas the latter indicated that the light Cu isotope (63Cu) is enriched in the vapor controlled by the kinetic isotope fractionation processes under pH and salinity variation.
The δ65Cu values of Cu minerals in the ore deposit where low-temperature mineralization events occur show much larger variations (Fig. 1.8), mostly related to the redox reactions. In the porphyry deposit, the Cu minerals from the supergene enrichment and leach cap zone present a much larger variation of δ65Cu values from -16.5 ‰ to 8.30 ‰ (Fig. 1.8), whereas the δ65Cu values of hypogene sulfide minerals, mostly chalcopyrite, span a narrow range clustering near 0 ‰ (Maréchal et al., 1999;
Larson et al., 2003; Mathur et al., 2009; Li et al., 2010; Mirnejad et al., 2010; Braxton
& Mathur, 2011; Palacios et al., 2011; Mathur et al., 2012; Mathur et al., 2013; Wu et al., 2017b; Mathur et al., 2018). The δ65Cu data from the high-sulfidation Cu