저작자표시-비영리-변경금지 2.0 대한민국 이용자는 아래의 조건을 따르는 경우에 한하여 자유롭게
l 이 저작물을 복제, 배포, 전송, 전시, 공연 및 방송할 수 있습니다. 다음과 같은 조건을 따라야 합니다:
l 귀하는, 이 저작물의 재이용이나 배포의 경우, 이 저작물에 적용된 이용허락조건 을 명확하게 나타내어야 합니다.
l 저작권자로부터 별도의 허가를 받으면 이러한 조건들은 적용되지 않습니다.
저작권법에 따른 이용자의 권리는 위의 내용에 의하여 영향을 받지 않습니다. 이것은 이용허락규약(Legal Code)을 이해하기 쉽게 요약한 것입니다.
Disclaimer
저작자표시. 귀하는 원저작자를 표시하여야 합니다.
비영리. 귀하는 이 저작물을 영리 목적으로 이용할 수 없습니다.
변경금지. 귀하는 이 저작물을 개작, 변형 또는 가공할 수 없습니다.
Ph.D. Dissertation of Amaël Borzée
Why are anurans threatened?
The case of Dryophytes suweonensis
왜 무미양서류는 멸종위기에 처해 있는가?
수원 청개구리의 사례를 통하여
2018년 2월
서울대학교 대학원
생명과학부
Amaël Borzée
Why are anurans threatened?
The case of Dryophytes suweonensis
지도교수 Piotr G. Jablonski
이 논문을 이학박사 학위논문으로 제출함
2017 년 10월
서울대학교 대학원
생명과학부
Amaël Borzée
Amaël Borzée의 박사학위논문을 인준함 2017 년 12월
위 원 장 Young Woon Lim (인) 부 위 원 장 Piotr G. Jablonski (인)
위 원 Mi-Sook Min (인)
위 원 Yikweon Jang (인)
위 원 Daesik Park (인)
Why are anurans threatened?
The case of Dryophytes suweonensis
A Thesis presented by Amaël Borzée
Supervised by
Professor Piotr G. Jablonski
In partial fulfilment of the requirements for the degree of Doctor of Science, Biological Science
Graduate School of Biological Sciences Seoul National University
February 2018
Abstract
Amaël Borzée
School of Biological Sciences College of Natural Sciences Seoul National University
The sixth mass extinction is under way, and amphibians are leading the race. An unpredictably high number of amphibian species is under threats of extinction. Factors of population decline in amphibians include (1) habitat destruction, (2) agrochemical and chemical pollution, (3) UV-B radiation, (4) diseases, (5) introduced species, (6) exploitation, (7) climate change and (8) complex causes, being the combined effects of the factors above. For any given species, some factors are of major significance, while other may be considered negligible. The loss of habitat due to urban development and encroachment is a major threat to almost all endangered species. Since the Neolithic Agricultural Revolution, humans have largely settled in lowlands, the primary breeding habitats for the majority of amphibian species. This trend continues nowadays, culminating in metropoles around the world. Encroachment also results in
decreased connectivity between metapopulations, and is linked to the resulting genetic depression. Anthropogenic modification of landscapes also impacts the behaviour and ecology of species, leading to new competition dynamics. For instance, agricultural practices and the loss of natural habitat bring geographically isolated species in contact, potentially leading to introgressive extinction. Finally, the use of chemicals and their presence in the environment, and the introduction of invasive species are factors that can bring a last blow to already weak and destabilised species.
My dissertation aims at assessing the status of the endangered Suweon Treefrog, Dryophytes suweonensis, to ultimately predict the species’ probability of survival. The species is present on a narrow range on west Korean lowlands, and completes its life cycle in rice paddies. It co-occurs with the widespread Japanese treefrog (D. japonicus), with which it interacts on a broad spectrum. The first step of this dissertation was to estimate the entire distribution of D. suweonensis in the Republic of Korea. With the data on its distribution and population size, I estimate the meta-population connectivity of the species, and the relationship between range size and fitness depression. I then assess competition, diet overlap and habitat segregation with D. japonicus. Because of the spatial arrangement and anthropogenically modified breeding strategy of the two treefrog species in rice paddies, I investigated hybridization between D.
suweonensis and D. japonicus and the possibility of introgressive
extinction in D. suweonensis. Besides, I investigated the phylogenetic relation between D. suweonensisand other closely related Hylid species in North East Asia to clarify recent evolutionary history. I then assessed the threats linked to the winter ecology of the species, and to chemical run-off resulting from agricultural practices. Finally, I assessed the potential for translocation and reintroduction of the species through a pilot study. I established long term population trends, before running a Population Viability Analysis to assess the probability of extinction for D.
suweonensis.
This research project is organised under five main parts: (I) demography, (II) behavioural ecology, (III) phylogenetics, and (IV) other factors of population decline and conservation assessment. This dissertation has two intrinsically connected principal aims. First, I determine the threatened status of D. suweonensis, in relation to habitat, ecology, competition and disease, and provide possible solutions for its conservation. The second aims is on a broader scale, intending to demonstrate the impact of landscape anthropisation on metapopulation connectivity, exemplify the need for long term surveys to estimate fluctuating population sizes, demonstrate the impact of range restriction on behavioural fitness, retrace evolutionary history through current behavioural patterns, demonstrate the risks of introgressive extinction, highlight the role of resurgence in the Yellow Sea for speciation events,
and finally, demonstrate the relationship between healthy invasive carriers and emergent anuran pathogens. Each of the 14 chapters is linked to the endangered status of D. suweonensis, and all highlight a different type of threat that has the potential to accelerate the decline of the species, to the point that it could be extinct within a short period.
Keywords: endangered species, anthropogenic pressure, anuran, Dryophytestreefrog, threat, conservation
Student number: 2013-31281
Table of Contents
Abstract ...4
Table of Contents ...8
PART I: DEMOGRAPHY...10
Chapter one: Range and threats ...11
Chapter two: Population connectivity...37
Chapter three: Population trends...73
Appendix one: Range extension ...102
Appendix two: Natural habitat ...103
Appendix three: Case study - Seoul...116
PART II: BEHAVIOURAL ECOLOGY ...132
Chapter four: Boldness and physiological traits ...133
Chapter five: Microhabitat use ...168
Chapter six: Competition ...202
Chapter seven: Agro-environmental variables...234
Chapter eight: Hibernation and migration...278
Appendix four: Interference competition ...334
Appendix five: Mating behaviour...345
Appendix six: Brumation ...349
PART III: PHYLOGENETICS...387
Chapter nine: Hybridisation ...388
Chapter ten: A ring of species...419
Appendix seven: Full mtDNA sequence ...441
PART IV: OTHER FACTORS OF POPULATION DECLINE AND CONSERVATION ASSESSMENT ...445
Chapter eleven: Water quality...446
Chapter twelve: Translocation ...467
Chapter thirteen: Population viability analysis...493
General conclusion ...508
Acknowledgements...오류! 책갈피가 정의되어 있지 않습니다. 초록...513
Bibliography...516
Appendix ...611
PART I: DEMOGRAPHY
This part contains all aspects of demographics in relation with the endangered status of amphibians. This includes range description and its limiting factors (chapter 1 & appendix 1), population connectivity and the
relationship with population sizes (chapter 2), population trends (chapter 3), description of natural habitat (appendix 2) and a case study around
Seoul (appendix 3).
Chapter one
IMPACT OF LAND RECLAMATION AND AGRICULTURAL WATER REGIME ON THE DISTRIBUTION AND CONSERVATION STATUS OF THE ENDANGERED
DRYOPHYTES SUWEONENSIS.
ABSTRACT
Knowledge about the distribution and habitat preferences of a species is critical for its conservation. The Suweon Treefrog (Dryophytes suweonensis) is an endangered species endemic to the Republic of Korea.
We conducted surveys from 2014 to 2016 at 890 potentially suitable sites across the entire range of the species in South Korea. We then assessed whether D. suweonensis was found in the current and predicted ancestral ranges, reclaimed and protected areas, and how the presence of agricultural floodwater affected its occurrence. Our results describe a 120 km increase in the southernmost known distribution of the species, and the absence of the species at lower latitudes. We then demonstrate a putative constriction on the species ancestral range due to urban encroachment, and provide evidence for a significant increase in its coastal range due to the colonisation of reclaimed land by the species. In addition, we demonstrate that D. suweonensis is present in rice fields that are flooded with water originating from rivers as opposed to being present in rice
fields that are irrigated from underground water. Finally, the non-overlap of protected areas and the occurrence of the species shows that only the edge of a single site where D. suweonensis occurs is legally protected.
Based on our results and the literature, we suggest the design of a site fitting all the ecological requirements of the species, and suggest the use of such sites to prevent further erosion in the range of D. suweonensis.
INTRODUCTION
Very few species have a cosmopolitan distribution, and most are likely to be under local environmental pressure (Purvis et al. 2000). When the entire range of a species is threatened by urbanization or other types of habitat modification, the risk of extinction increases exponentially (Huxley 2013). As a result, the assessment of extinction risks depend on threat levels (Mace and Lande 1991; see IUCN 2016), which may guide optimal conservation effort to prevent extinction (Pimm et al. 2014).
Lack of knowledge of species’ distributions has already resulted in extinctions that could have been easily avoided. For example, the Tecopa pupfish (Cyprinodon nevadensis calidae) became extinct following construction of man-made structures on the Tecopa Hot Springs, the only site where the species occurred (Miller et al. 1989).
Unfortunately, this information was not available at the time of
construction. Knowledge of species’ habitat preferences provides background information for the assessment of extinction risks (Manne and Pimm 2001), and can be used to develop spatial models for species’
distribution (Corsi et al. 2000). For instance, a subspecies of Ursini's viper, Vipera ursinii graeca, was known to occur only in Greece and at a single locality in Albania. However, eight new localities were found through landscape and climate modelling, doubling the known range of the species (Mizsei et al. 2016).
Although critical, obtaining information about species’ ranges and habitat preferences is only a first step for any conservation effort. At risk species with clearly defined ranges still go extinct in large numbers and a way to stem this loss is through the implementation of protected areas (Pimm et al. 2014). The occurrence of a species within a protected area will significantly increase its chance of survival, despite the debated effectiveness of currently located protected areas (Abellán and Sánchez- Fernández 2015), and the need for the establishment of additional protected areas (Brooks et al. 2004).
The Class Amphibia is currently the most endangered class of vertebrates (Stuart et al. 2004). Among the difficulties for amphibian conservation efforts are unknown distribution limits and the absence of adequate breeding sites. Suitable natural wetlands for amphibians have been converted into farmlands such as rice-paddies over the last century,
especially in the Republic of Korea (Juliano 1993; Czech and Parsons 2002; Machado and Maltchik 2010). Furthermore, those farmlands still holding a fraction of the original biodiversity are being converted into residential and commercial facilities at an alarming rate. In the Republic of Korea, rice production has decreased by about 25 % since peak production in the 1970s (FAO 2016). Since then, there have been clear negative repercussions on habitats available for amphibians (Park et al.
2014).
The Suweon Treefrog, Dryophytes suweonensis (previously attributed to Hyla; Duellman et al. 2016), is an endangered, endemic treefrog species from the Korean Peninsula. As of 2012, the species was known to occur in a very restricted range, limited to five valleys centred in metropolitan Seoul (Kim et al. 2012b). It is therefore possible that the largest populations of D. suweonensismight have been historically present in and around the present Seoul area (Borzée et al. 2015a). Yet, opportunistic observations of calling males in the Democratic People’s Republic of Korea (Chun et al. 2012) and further south than previously reported (Borzée et al. 2016c), lead to the expectation of a broader distribution for the species.
Dryophytes suweonensis is an evolutionary important species due to its unusual ZW karyotype, warranting special conservation efforts (Dufresnes et al. 2015). Here, we first aimed to describe the extent of
occurrence and distribution of the species through occurrence surveys, as well as the loss of ancestral range because of urbanisation. We then assessed the overlap between the range of the species and reclaimed tidal flats, and the overlap between range and protected areas. Next, because the distribution of D. suweonensis is closely intertwined with rice cultivation, we examined whether the origin of agricultural flood waters was critical for the occurrence of the species. Finally, we extracted environmental variables collected from field surveys and described optimal conservation sites for D. suweonensis.
MATERIAL AND METHODS
Field surveys were conducted during 2014, 2015 and 2016, only after the beginning of the breeding season of the species (Roh et al. 2014) to prevent any false negative. Because Dryophytes suweonensis has not been observed using other vegetation than rice seedlings as supports from which to hang to produce advertisement calls (Borzée et al. 2016b), and because it is not known to breed in any other wetland than rice paddies (Borzée et al. 2016b, the species typically starts breeding after rice planting.
The setting of modern rice fields during the last decades led to a specific geometric grouping of rice paddies, here referred to as rice-paddy
complexes. A rice-paddy complex is characterized by a central ditch running mostly straight through the complex for irrigation purposes.
Along this central ditch, and thus along the longest and straightest line available, usually runs a cemented lane, typically following the centre of the valley. In this study, rice-paddy complexes were considered spatially independent if further than 200 m apart, the maximum daily dispersion distance for the species (Borzée et al. 2016a), or separated by landscape barriers impermeable to treefrogs (Roh et al. 2014).
The Japanese Treefrog, D. japonicus is ubiquitously present on the wetlands of the Korean Peninsula, and the two treefrog species are in sympatry at all sites. The advertisement calls of D. japonicus and D.
suweonensis are species specific (Jang et al. 2011; Park et al. 2013), and we noted the presence or absence of D. suweonensis through acoustic monitoring. In calling anurans, including Hylids, acoustic monitoring is known to be reliable to estimate population size, and thus adequate to assess occurrence (Weir et al. 2005; Pellet et al. 2007; Dorcas et al. 2009;
Petitot et al. 2014; Moreira et al. 2016). In a preliminary study, our aural survey protocol with 5-min transects was accurate to estimate the occurrence of D. suweonensis(Borzée et al. 2017c).
Transect surveys
We defined the general area for this study a priori, following the ecological requirements of the species such as defined by Roh et al.
(2014) and including all natural and man-made wetlands west of 127.5° E and below 120 m above sea level. This pre-selection of potential breeding sites through Google Earth Pro (Google Earth imagery, v7.1.2.2041, 2013) identified 789 sites in 2014 (Fig. 1.1). A previous study for the occurrence of this species had drawn the southern limit of the range around the Bay of Asan, below 37° N (Kim et al. 2012b; Fig. 1.1). However, our surveys in 2014 demonstrated the southern limit of the range to be inaccurate (Borzée et al. 2016c), and additional surveys were conducted further south in 2015 and 2016, until reaching a point past where the species was no longer detected. In 2015, we surveyed 189 sites, composed of 90 new sites and 99 sites where the species was present in 2014.
A single site where the species was detected in 2014 could not be visited again due to its location within the Civilian Control Zone (CCZ) adjacent to the border with the Democratic Republic of Korea and the lack of permits for 2015 and 2016. In 2016, we surveyed a total of 122 sites (99 sites from 2014, 12 from 2015 and 11 new sites). All accessible sites where the species had been recorded in 2014 were surveyed in 2015 and 2016, even if the species was not detected in 2015. All sites where the species had been detected in 2015 were kept in the list of sites to survey in 2016. In total, 890 sites were surveyed at least once over the three years of surveys.
Surveys were conducted between 5 pm and 2 am, during the peak
calling activity of the species. After arrival at a survey site, five minutes were spent waiting quietly. For each site, aural monitoring was conducted along a single transect along the centre of the rice-paddy complex. A surveyor walked briskly at a maximum speed of circa80 m/min along the transect, noting the presence or absence of D. suweonensis at the rice- paddy complex. Before conducting the project, we had empirically measured the detection range for advertisement calls of D. suweonensis(n
= 20), resulting in a 250 ± 45 m range. The farthest rice paddies in rice- paddy complexes were typically within this detection range.
At the end of each transect survey we recorded water pH and water conductivity (μS) to define the ecological preferences of D.
suweonensis. We also estimated surface area and longest straight line within sites to determine a sphericity ratio for the occurrence of the species. This is important for determining the likelihood of a species’
presence because a circular site will better retain a species than a narrow and linear site. We then recorded the length of continuity with rivers and forests, defined as the continuous line between the edge of rice-paddy complexes and the aforementioned landscape feature, and finally, we noted the presence of buildings and greenhouses within the rice-paddy complexes. These variables were collected through the drawing of polygons or visual inspection of sites in Google Earth Pro (Google Earth imagery, v7.1.2.2041, 2016), at a 10 m resolution, on map dated from
2015 at the latest.
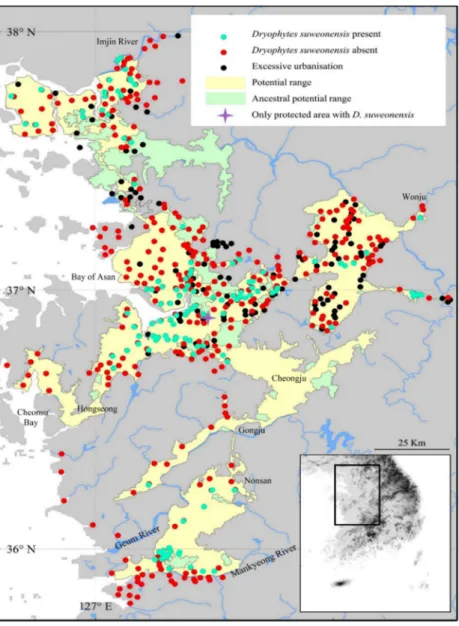
Figure 1.1. Summary of the 890 sites surveyed at least once over the three years of surveys. Dryophytes suweonensis was detected at least once at 114 sites, and 421 sites were too excessively urbanized for the species to occur. Here, potential current range is defined as the range where the species could currently occur, while the potential ancestral range is the range where the species could have occurred before urban development.
Pyeongtaek is the area where the only protected area with D. suweonensisis found
Reclaimed lands and protected area
To correlate the presence of the species with shifting landscape use, we recorded the presence of the D. suweonensis at sites located on reclaimed lands. Here, reclaimed lands used to be mudflats and sea beds, which have been converted into rice-paddy complexes. To record the presence of reclaimed lands, we compared maps from 1950-51 drawn by the US Army (Center of Military History 1990) downloaded in Google Earth and present satellite pictures from Google Earth Pro (Google Earth imagery, 6.2.2.6613, 2016). The 1950-51 maps were selected due to their precision. A land was considered reclaimed if it was not usable for breeding by D. suweonensis in 1950-51, but converted into rice paddies before 2016.
We then compared the presence of protected areas and the localities where D. suweonensis occurred. Data on protected areas were downloaded from the Protected Planet database, set by the IUCN and UNEP-WCMC (2016). We subsequently noted the number of sites within any protected area, as well as “sites that do not meet the standard definition of a protected area but do achieve conservation in the long-term under national and international agreements” (IUCN and UNEP-WCMC 2016).
Origin of agricultural flood waters
To analyse the impact of agricultural flood water on D.
suweonensis distribution, we asked rice farmers for the origin of the water used to flood their rice paddies. This survey was restricted to the general riverine basin surrounding the city of Iksan, south of the Geum River. To be included in the analysis, the origin of the water for a rice paddy complex had to be confirmed by at least two different farmers (Fig. 1.2).
Data collection was limited to sites where surveys for D. suweonensis were conducted. The area surveyed south of the city of Gunsan and the Mankyeong River had to be excluded from the analysis due to lack of traceability of the origin of agricultural flood water (Fig. 1.2).
Data analysis and optimal conservation sites
For subsequent analyses, we binary encoded the presence of the species, the presence of greenhouses and the presence of permanent human infrastructures within the rice-paddy complexes. We first determined the range of the species, based on presence data points (Fig.
1.1). We defined the potential range of the species based on the non- interruption of landscape variables that are within the range used by the species. We also delineated the ancestral range of the species, defined as the potential range of the species before human development. Namely, a site was considered potential for the species if < 120 m of altitude and within the same water basin as a known population, excluding cities and urban area > 1 km2(Fig. 1.1).
We then defined the overlap between species range and reclaimed
area to estimate the land use by the species, and calculated the overlap between species range and protected areas. Descriptive statistics were used to characterise the impact of these landscape variables in both cases.
We hypothesised the origin of the water to be important if linked to the Geum River. This geographic area was chosen due to the clear segregation between areas flooded with water from different origins. We indexed the occurrence of D. suweonensisat the sites surveyed in relation to the binary encoding of the origin of flood water, from the Geum River.
We subsequently assessed whether distribution of D. suweonensis was random in relation to agricultural flood water.
Finally, we developed a plan for an optimal site for the protection of the species. From survey presence data, we calculated averages for water quality (pH and conductivity) as proxies for a larger set of values important for the species (Borzée et al. 2017d), the continuity with rivers and forests, and the sphericity of sites. For sites surveyed over multiple years, the abiotic variables used for the calculation of the species’
preferences were restricted to the latest data point. This choice to restrict the analysis to the survey presence data followed recent documented local extinctions, and the potential for other undocumented local extinction due to water quality, salinity, competition and land-use among others, and because these variables are important to ecological preferences of species.
All analyses were conducted with SPSS (v. 21.0, SPSS, Inc., Chicago, IL,
USA), and maps were generated with ArcMap 9.3 (Environmental Systems Resource Institute, Redlands, California, USA).
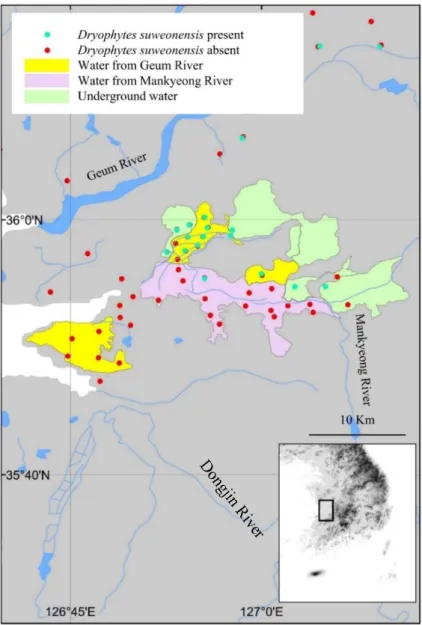
Figure 1.2. Relationship between flood water origin and species presence. Most of the flood water matching with the occurrence of Dryophytes suweonensisoriginated from the Geum River (53.3 %), followed by underground water (40 %), while the remaining 6.7 % of sites were flooded by the Mankyeong river. This analysis is restricted to the area shown on the map.
RESULTS
During the surveys conducted in 2014, only 358 sites out of the 789 sites pre-selected were potentially habitable for the species as urban development and agricultural conversion eliminated the 431 remaining sites. That is, these sites were beyond the ecological requirements of the species as there was no standing water; instead the sites were mostly greenhouses, apartment complexes or dry crops. Within the 358 habitable sites, we found calling Dryophytes suweonensis at 100 sites, while the species was not detected at 258 sites. In 2015, calling D. suweonensis were detected at 106 sites total, from 94 of the 100 sites where the species was detected in 2014, and 12 of the new sites. In 2016, the species was detected at 109 sites total, 94 of the 2014 sites, 12 of the 2015 sites and three of the new sites. The 94 sites originating from the 2014 dataset where the species was detected in 2015 and 2016 were the same. The species was not detected at the five remaining sites where it had been found in 2014. The 12 sites where the species was detected in 2015 were included in the surveys in 2016, and the species was again detected at all 12 sites. For all subsequent analyses, we assess the species to be present at the 114 sites where the species was detected at least once. This includes the 113 sites surveyed over three years and the site behind the CCZ and these sites are distributed over circa 4300 km2 (Fig. 1.1). However, this species is under significant threats of local extinction at the five sites
where the species was detected in 2014 only; a new motorway was built during the study period in the (Fig. 1.1, Bay of Asan).
Range, ancestral range and current optimal range
The southern boundary of D. suweonensis’ distribution was extended 120 km southwards from the previous assessment (Kim et al.
2012b). The distribution of D. suweonensis ranges from the southern banks of the Imjin River to the northern banks of the Mankyeong River, on a 220 km north-south transect. The range of the species spans 95 km longitudinally, with the westernmost known population in Hongseong area and the easternmost in Wonju (Fig. 1.1).
The potential range of the species, defined as the area where ecological preferences of the species are matched, is situated at the same latitude as the one where the species was detected, but extends 25 km further west from the westernmost site where the species was detected, towards the reclaimed Cheonsu bay. In addition, the corridor of low lands between Nonsan, Gongju and Cheongju matches with the habitat required for the species, but no surveys were conducted in that area, as primarily estimated too far and disconnected from the range of the species to be a potential breeding area. When compared with the potential range of the species before human development, referred here as ancestral range, the land surface area usable by the species decreased by 729 km2(Fig. 1.1).
Overlap between reclaimed lands and protected area
Out of the 114 sites where D. suweonensiswas detected, a total of 30 sites were enlarged and 15 sites were created through land reclamation.
The remaining 69 sites were not impacted by land reclamation. When combining all sites impacted by land reclamation, they represent 39.47 % of the sites where D. suweonensis was present. When focusing on the overlap between the occurrence of D. suweonensis and protected areas, only a single site was selected, South of Pyeongtaek, protected under
“Water Source Protection Area”. In this protected site, only the riverine system at the edge of the site is protected, putatively used by D.
suweonensisfor hibernation and not for breeding.
Origin of agricultural flood waters
This analysis is based on a subset of sites in the southern distribution of the species (Fig. 1.2). A total of 53.3 % of sites where D.
suweonensis was present overlapped with agricultural floods originating from the Geum River (Fig. 1.2), highlighting the non-random occurrence of the species in this area. Few sites surveyed in the putatively suitable areas using water from the Mankyeong River had D. suweonensis (1/15 sites; 7%), while those in areas using water from the Geum River had higher presence (8/17 sites; 49%) and an even high proportion of sites showed presence in the areas utilising underground water (6/8 sites; 75%).
Autocorrelation of the origin of flood water is likely, although of minor
importance in this study and unlikely to impact the result of the statistical analyses.
Assessment of optimal conservation site
The environmental variables for D. suweonensis (Table 1.1) showed an average pH of 8.32 and average conductivity of 792.19 μS.
The average sphericity was 1.15, meaning that sites were more round than elongated in general. The majority of sites where D. suweonensisoccurred had permanent man-made infrastructures (52.9 %) and temporary structures (i.e.greenhouses, 68.9 %) within the rice-paddy complexes.
Depiction of the sites adequate for the conservation of D.
suweonensis (Fig. 1.3) was supplemented by vegetation lists from Borzée and Jang (2015), and landscape information matching the current habitat of D. suweonensis. Rice paddies are delimited by levees roughly 40 cm wide and 20 to 60 cm high, covered with grasses, and used by treefrogs for basking, foraging, and sheltering (Borzée et al. 2016a). The overhead view of the designed site highlights the need for continuity with forests and rivers to match the preferences of the species (Fig. 1.3a), while the lateral view (Fig. 1.3b) describes depth and vegetation characteristics required for the species.
DISCUSSION
This study highlights the importance of analysing data on the presence/absence and habitat characteristics of species for their conservation. The known range of Dryophytes suweonensis was doubled by the data collected over this three years study, highlighting the need for a different approach to the selection of sites for the conservation of the species. These new data show that the increase in known range is due to the inclusion of a large number of sites in reclaimed area from post-war agricultural governmental development. The apparent expansion of the species’ known range is, however, countered by several potential local extirpations, such as all the sites in the area of Suweon where the holotype for D. suweonensis was described (Kuramoto 1980; Park et al.
2013).
The species still matches the criteria B1ab(i,ii,iii,iv) for listing as
“endangered” under the criteria of the International Union for Conservation of nature (IUCN) red list of endangered species. It has an extent of occurrence < 5000 km2, a severely fragmented population with a continuing observed decline for extent of occurrence, area of occupancy, quality of habitat and the number of locations or subpopulations. At present, the protection of D. suweonensis is not ensured because no populations are located within a protected area. Only the edges of a single site are overlapping with a protected area, south of Pyeongtaek. A single
protected site is inadequate for the conservation of an endangered species.
The description of the potential range for D. suweonensis shows that an area around Cheongju may be adequate for the species to thrive.
However, that area was not included in the initial surveys, due to the lack of knowledge of such a potential wide range for the species. Similarly, sites such as Baengnyeong or Seogmo Islands may be suitable but could not be accessed due to their limited access to non-military personnel.
Another potential significant range increase would be within the Democratic People’s Republic of Korea, as the species is known to occur around Pyongyang (Chun et al. 2012).
Encroachment on the species’ range by development (431 sites), such as at the sites around the city of Suweon, has been partially counter- balanced by the land reclamation projects for rice agriculture (15 sites) implemented at a very large scale in the Republic of Korea during the second half of the last century. The presence of D. suweonensis on reclaimed land shows that the species possesses the potential for dispersal despite a lower dispersal ability than the sympatric Dryophytes japonicus (Borzée and Jang 2016b). This shift in range is thus linked to rice cultivation and may have been an on-going process since early human agriculture circa5000 years ago (Fuller et al. 2007; Fuller et al. 2008).
Furthermore, numerous D. suweonensis populations are isolated
from each other, with urbanization resulting in multiple landscape barriers within and among potential metapopulations.
Figure 1.3
(A) Overhead view of the site optimally designed to follow ecological preferences demonstrated by Dryophytes suweonensis. The cut AA’ is reported in Fig. 3b. The figure is not to scale. Water depths indicated are matching with the average depth of rice paddies, and therefore acceptable if not optimal for the species, and vegetation data is extracted from Borzée and Jang (2015). (B) Lateral view of the site optimally designed to follow ecological preferences demonstrated by Dryophytes suweonensis. Water level (WL) originates from the only known natural site with Dryophytes suweonensis (Borzée and
Jang 2015).
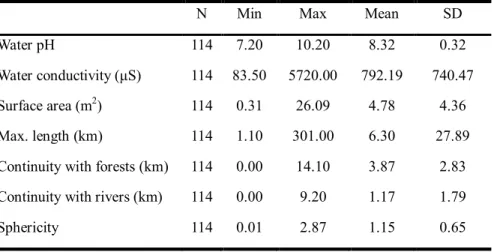
Table 1.1. Descriptive statistics for abiotic variables of interest collected from all sites where Dryophytes suweonensiswas present.
N Min Max Mean SD
Water pH 114 7.20 10.20 8.32 0.32
Water conductivity (μS) 114 83.50 5720.00 792.19 740.47 Surface area (m2) 114 0.31 26.09 4.78 4.36 Max. length (km) 114 1.10 301.00 6.30 27.89 Continuity with forests (km) 114 0.00 14.10 3.87 2.83 Continuity with rivers (km) 114 0.00 9.20 1.17 1.79
Sphericity 114 0.01 2.87 1.15 0.65
This calls for a long-term study of population dynamics and network analysis for the species. We would expect the population to be larger at reclaimed sites, due to lower levels of encroachment and fragmentation.
The water origin analysis showed that frogs occur at sites flooded by water originating from the Geum River and underground water sources. However, the species was not detected at sites flooded by water originating from the Mankyeong River. Thus, water originating from underground water bodies and pumped to the surface for agricultural purposes may be adequate for D. suweonensis. The areas flooded by river water may be the ones that were seasonally flooded before landscape modifications by humans, and the absence of D. suweonensisat some sites could relate to water quality. This idea is potentially supported by the absence of individuals at the only site flooded by water originating from the Geum River south of the Mankyeong River. However, as the water is brought by aerial channels, it is possible that some individuals D.
suweonensis will drift south to this area in the future and establish new colonies, or perhaps hybridise with the D. japonicus present at the site (Borzée et al. 2015b).
Conservation of a species often requires the restoration of the species’ habitat (Rannap et al. 2009). The design of an optimal site for the protection of D. suweonensishighlights the need for very large continuous
flood plains. However, such large plains are becoming frequently uncommon because of encroachment, and management plans have to be set before these sites disappear. Furthermore, the presence of bullfrogs in the southern part of the range, may have a known negative impact on the species (Borzée et al. 2017c), and demonstrates that the first steps of conservation management plans for the species have to be conducted at any site where the species would be protected/re-introduced. Finally, as the species is still present across a range similar to its ancestral range, we do not recommend ex-situ conservation projects at this time, nor translocations to new sites that would be outside of the ancestral range for the species.
Chapter two
POPULATION CONNECTIVITY AS A REQUIREMENT FOR CONSERVATION EFFORT OF ANURANS.
ABSTRACT
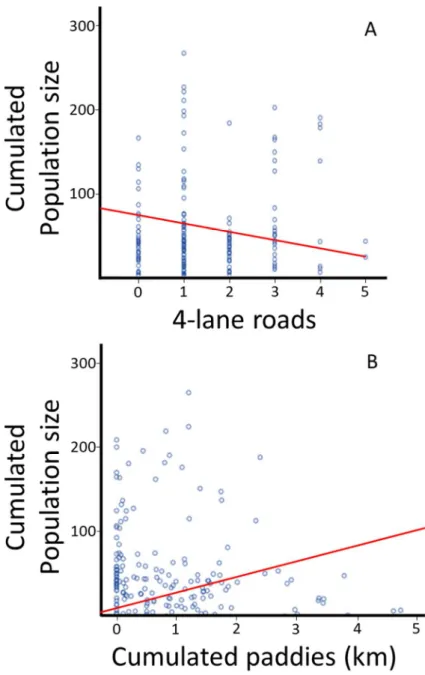
Characterisation, and impact, of landscape elements between populations of the same species, is vital to assess the importance of sites in the frame of population connectivity. Dryophytes suweonensis is an endangered species distributed on the lowlands between the yellow sea and the Baekdu Mountain Range on the Korean peninsula. Following population presence assessments, we assessed the connectivity between sites, and populations, and discriminated between connected and disconnected populations. We subsequently assessed the impact of landscape elements on populations and branches. Finally, we estimated the relation between haplotype diversity and population size for a subset of the sites. Our results revealed the isolation of 95 clusters of individuals, themselves distributed into 14 isolated populations, either through distance or barriers. The number of calling males in clusters was significantly related to the number of linking branches < 2 km long. The cumulated populations of clusters connected by branches was significantly related to the presence of roads with four lanes or more, and the cumulated distance of rice paddies making up the length of the branch.
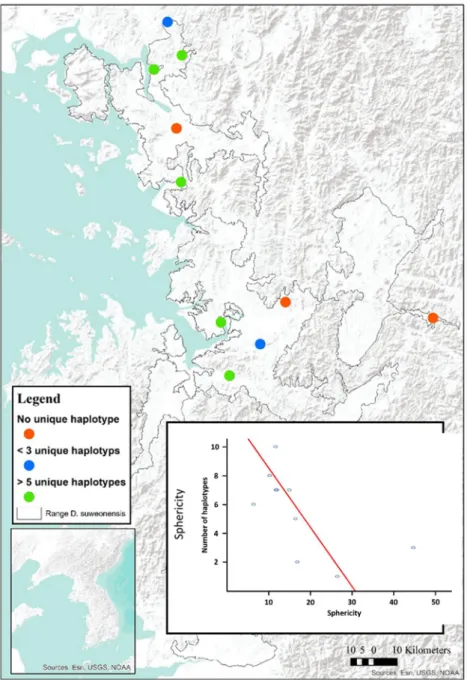
None of the variables recorded was significant towards the population size of populations. Finally, the genetic diversity at a site was significantly explained by landscape factors linked to clusters, such as sphericity. We finally suggest the restauration of connectivity to prevent a drop in fitness for the species.
INTRODUCTION
To be efficient in preserving species and the genetic information they carry, conservation programs need to be implemented at broad a scale (Poiani et al. 2000). Not only the number of individuals surviving is important for conservation, but also the number of populations, the number of individuals for each of these, the effective population size, the connectivity between sites and the potential for gene exchange through individual dispersion (Soulé 1987), as an important but non-exhaustive list. The combination of these factors will be the principal determinant for a species to survive or go to extinction.
A large number of landscape features can have an impact on the connectivity of populations (Forman and Alexander 1998; Geneletti 2004), a principal feature to the survival of species (Fahrig 1997; Dodd Jr 2010). This is especially true for amphibians due to their daily and seasonal displacements (Alford and Richards 1999; Funk et al. 2005;
Cushman 2006; Holderegger and Wagner 2008; Lengagne 2008; Allentoft and O’Brien 2010; Scherer et al. 2012). For instance, two geographically close populations may be separated by a 6-lanes highway, creating a permeable barrier to gene flow (Ashley and Robinson 1996; Trombulak and Frissel 1999). Oppositely, two populations up to ten kilometres apart can still be connected if the landscape feature between the two sites are not preventing dispersion (Smith and Green 2005). Besides, road networks, although crossable individually, can isolate suitable patches of habitat for a species (Bowne and Bowers 2004). Other man-made landscape features such as urban areas wider than 100 m wide (Roh et al.
2014), intensive farming (Forman and Alexander 1998), high speed train tracks (Clauzel et al. 2013) and natural landscape features such as rivers with a breath over 60 m (Angelone and Holderegger 2009; Le Lay et al.
2015) can further increase habitat fragmentation, leading to further genetic partitioning of populations.
The lack of connectivity between populations may results in a loss of genetic diversity, revealed for instance through haplotype networks and comparatively high inbreeding (Allendorf and Luikart 2007; Keyghobadi 2007). Connectivity between populations can be preserved, or improved, through the development of (non-)protected green corridors and ecological buffer zones (Bennett 1998). Landscape connectivity is therefore the result of the interaction between the movement of organisms
and the structure of the landscape (Goodwin 2003), and has functional and structural factors (Brooks 2003; Holderegger and Wagner 2008).
Independently of increased habitat connectivity (i.e.
defragmentation, Holderegger and Wagner 2008), focus on the remaining patches of habitat suitable for a species, and their protection and increase in quality, is the first step towards species conservation (Moilanen et al.
2005). The population of a species is analogue to a network in which the survival of each cluster is dependant from the connected clusters, with the whole assemblage of clusters relying on the branches between each of them (Bennett 1998; Moilanen et al. 2005). Therefore the conservation of each branch, although only travelled and not lived in by the species, is important and includes factors such as the preservation of pioneer conditions and the establishment of stepping stone habitats (Tester and Flory 2004; Angelone and Holderegger 2009).
Amphibians are generally not able to disperse over large distances such as would do bird or mammals (Semlitsch 2000), and network connectivity is a primordial factor for the survival of a population.
Amphibians are constrained by water balance and thermoregulations, and estimated to be able to disperse/migrate a maximum of 15 km if unaided (Sinsch 1990), with the average typically around 2 km (Sinsch 1990;
Sinsch 1992; Miaud et al. 2000; Leskovar and Sinsch 2005; Smith and
Green 2005). Treefrogs, here Hyla arborea, have an inherent higher dispersion rate than other ground dwelling amphibians, without however being able to disperse more than circatwo kilometres per season (Vos et al. 2000; Smith and Green 2005; Arens et al. 2006). For instance, in another study on H. arborea, two-thirds of colonisers originated from less than 500 m, a third from 500 to 2500 m and 4 % from ponds up to 5400 m (Le Lay et al. 2015). Also, Angelone and Holderegger (2009) demonstrated that the establishment of stepping-stone habitats lead to migration between populations and the genetic signature of population expansion for a population of H. arborea, although previously declining over many years (Weidmann and Flory 1991). Oppositely, a population impacted by a less severe decline, but without habitat network connectivity, displayed the genetic signature of a population with less migrations between populations and a genetically homogenous population. This has an important relation with species survival as the loss of genetic variation is often the result of genetic drift and inbreeding, due to population isolation (Allendorf and Luikart 2007).
To be able to design adequate conservation measures it is first required to collect data on population connectivity and gene flow between each of the populations of the target species. Dryophytes suweonensis is an endangered species from the Korean Peninsula (IUCN 2017a; Roh et al. 2014; Borzée et al. 2016c; Borzée et al. 2017b), occurring in sympatry
with the abundant D. japonicuson the totality of its range. Several factors may be involved in the decreasing number of individuals for the species, including the lack of natural habitat (Borzée and Jang 2015) and the strong decrease in surrogate breeding habitat (i.e. rice paddies; Borzée et al. 2017b).
The purpose of this study was first to assess the connectivity between each population for D. suweonensis, through isolation by distance. Second, we aimed at defining population connectivity through the characterisation of natural and artificial landscape elements, thus framing the potential for dispersion between sites. We then correlated landscape variables for a subset of sites with the number of CO1 mtDNA haplotypes to investigate genetic isolation between populations.
MATERIAL AND METHODS.
Species and system description
Dryophytes suweonensis is a small treefrog species solely breeding in rice paddies because of encroachment (Borzée and Jang 2015;
Borzée et al. 2017b). It is sympatric with D. japonicus, ubiquitously present in wetlands. The advertisement calls of the two species are species specific (Jang et al. 2011; Park et al. 2013), even to the naked ear, and make for reliable signals for field surveys (Roh et al. 2014; Borzée and
Jang 2015; Borzée et al. 2015a; Borzée et al. 2017c). In calling Hylids, acoustic monitoring is reliable to estimate population size (Weir et al.
2005; Pellet et al. 2007; Dorcas et al. 2009; Petitot et al. 2014; Moreira et al. 2016), and our aural survey protocol has been determined to be accurate to estimate occurrence for the species (Borzée et al. 2017c;
Borzée et al. 2017b).
The setting of modern rice fields during the last decades lead to a specific geometric grouping of rice paddies, here referred to as rice-paddy complexes. A rice-paddy complex is characterized by a central ditch running mostly straight through the complex for irrigation purposes.
Along this central ditch, and thus along the longest and straightest line available, usually runs a cemented lane, typically following the centre of the valley.
Survey protocol
The occurrence of populations used in this study arise from country wide field surveys conducted to determine the presence of the species (Borzée et al. 2017b). Surveys were phenologically situated after rice plantation and after the beginning of diel calling activity to ensure detection and adequate population estimates (Roh et al. 2014; Borzée et al. 2016b) , and encompassed the totality of the species’ distribution within South Korea. The protocol used here is described in Borzée et al.
(2017b), such as: ”After arrival at a survey site, five minutes were spent
waiting quietly. For each site, aural monitoring was conducted along a single transect along the centre of the rice-paddy complex. A surveyor walked briskly at a maximum speed of circa80 m/min along the transect”, counting the number of D. suweonensiscalling at the rice-paddy complex.
The detection range for advertisement calls of the species had been empirically measured prior to the surveys, resulting in a 250 ± 45 m range (n = 20). All rice paddies within the rice-paddy complex surveyed were typically within the detection range.
Population occurrence and size estimate
Field surveys for occurrence were conducted during the breeding seasons 2014, 2015 and 2016 (Borzée et al. 2017b). The area surveyed was defined based on a priorianalyses of potential breeding sites through Google Earth Pro (Google Earth imagery, v7.1.2.2041, 2013), in relation with the ecological requirements of the species (Roh et al. 2014), identifying 890 potential sites, among which 119 were surveyed for population size estimates. Surveys for population estimates were conducted during the breeding seasons 2015, 2016 and 2017, although only 99 clusters were surveyed for the three years. The species was discovered at 19 sites in Iksan (red site on Fig. 2.1) in 2015 only, and thus were surveyed for population size from 2016. One site was surveyed once only in 2015, due to its location within the Civilian Control Zone (CCZ), adjacent to the border with the Democratic Republic of Korea and the lack
of permits to enter the area in 2016 and 2017. The number of individuals at this site was thus not averaged over three years, and was not comparatively different from the population sizes at close sites. The site was not excluded from the dataset due to the known presence of a population, and because species do not respect political barriers.
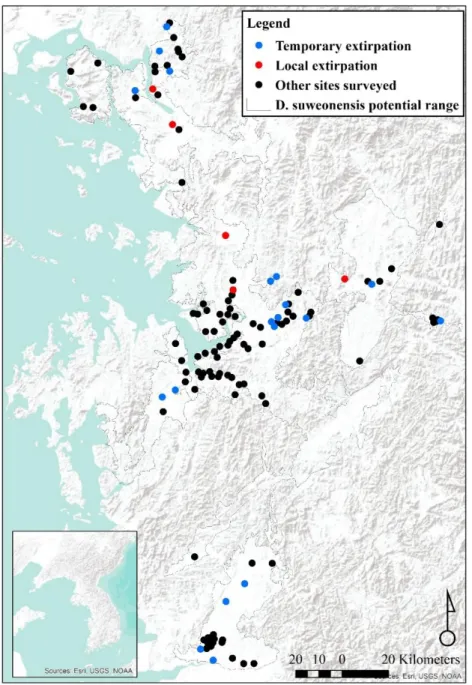
Figure 2.1. Distribution of the 95 clusters of populations. Branches between clusters are in red, and link clusters in 14 populations. In blue are the clusters geographically isolated from others, and the populations are colour-coded such as follow: purple = Paju, orange = Bucheon, yellow = Gimpo, Cyan = Kangwa Island, pink = Icheon, green = Ansan, light green = Chungju, black = Nonsan and red = Iksan. The species range is drawn from Borzée et al. 2017).
Sites were delimited as geographically stopping at the edges of the rice-paddy complexes, and were grouped together in clusters if within daily displacement of an individual (circa 200 m), but were not clustered if isolated by distance or landscape barriers. Clusters were grouped into populations when within dispersion distance of individuals, set at 10 km (Pellet and Schmidt 2005).
Landscape data
For each cluster, we also measured landscape variables. We first determined the sphericity ratio for each cluster, calculated such as surface area divided by longest straight line. We did so because a circular site will better retain genetic diversity compared to a narrow and linear site. We then measured the cumulated length of adjacency with rivers and forests, defined as the continuous line between the edge of a rice-paddy complex (i.e. cluster) and the aforementioned landscape feature. These variables were collected through the drawing of polygons or visual inspection of sites in Google Earth Pro (Google Earth imagery, v7.1.2.2041, 2016) at a 0.01 km resolution, on map dated from 2016.
When clusters were located within the dispersion capacity of D.
suweonensis, represented through the dispersion ability of Hyla arborea, we considered them linked by branches (Angelone and Holderegger 2009). Branches were drawn if the two closest points of the two focal clusters were 10 km apart or closer (Smith and Green 2005), and not
shadowed by another cluster on the shortest line between the two mentioned clusters. The distance of 10 km was arbitrarily chosen for connectivity following data for H. arboreaspecifying that dispersal over 8 km is rare, while dispersion above 12 km is unlikely (Pellet et al. 2004;
Arens et al. 2006; Angelone and Holderegger 2009).
For each branch, we collected additional data: presence of water bodies wider than 60 m (Gibbs 1998; Angelone and Holderegger 2009), presence of urban area wider than 100 m (Ray et al. 2002; Roh et al.
2014) and number of 4-lanes roads, or above (Ashley and Robinson 1996). All these variables are known to be important for dispersion, due to their effect as potential barriers. We then measured the composition of each branch, including the total length from the edge of a cluster to the edge of the next cluster, the total population size of the two clusters connected by the branch, the altitudinal variation between the two clusters, and the potential connectivity between the two clusters linked through continuous rice paddies independently of the sinuosity of the path and distance covered. Finally, we measured the broke-down distance for each branch for the cumulated distances of urban areas, forests, rice paddies and “dry fields”. Golf fields and orchards were a significant part of the landscape variables encountered and were assigned to the “dry field” category, due to the presence of chemicals and their linear structure.
The presence water bodies were subsequently binary encoded, and the
whole length of branches qualified < or ≥ 2 km for statistical analyses (Smith and Green 2005; Angelone and Holderegger 2009).
Genetic analysis
Genetic sampling was conducted in 2013 and 2014 at non- redundant clusters (permits number 2014-04 and 2014-08), for a total of 87 individuals, originating from ten clusters. Each cluster was separated from the next one by more than 12 km and therefore independent. Each individual was orally swabbed (Broquet et al. 2006), and the swabs were subsequently kept at – 20 °C until DNA extraction. DNA was extracted with the Enzynomic® Genomic DNA Tissue Extraction Kit, following the recommendation of the manufacturer (Genomics Extraction Kit protocol V2013-1). PCR and sequencing for the Cytochrome c oxidase subunit I (mtDNA COI) were conducted following the protocol developed by Jang et al. (2011) based on the primers LepF1 (5’-ACC AAT CAT AAA GAT ATT GGT-3’) and LepR1 (5’-CCT CTG GGT GTC CGA AAA ATC A-3’;
Hebert et al. 2004). PCR were carried on a PTC-100, BIO-RAD thermocycler (Biorad; USA), with the initial denaturation at 94°C for 3 min, an annealing temperature of 51°C for 35 cycles and a terminal elongation of 72°C for 5 min. Samples were sent to Macrogen Inc. (Seoul, Republic of Korea) for purification and direct sequencing on an ABI PRISM 3100 automatic sequencer (Applied Biosystem Inc., USA).
The sequences were manually trimmed in Geneious (v9.04,
Biomatters Limited, Auckland, New Zealand) Sequences for all individuals and at least 612 bp long were aligned using the Muscle alignment plug-in in Geneious, with a maximum of ten iterations.
Sequences were then blasted on the Basic Local Alignment Search Tool from the NCBI portal (http://blast.ncbi. nlm.nih.gov/Blast.cgi) to ensure all individuals were D. suweonensis. Haplotype categorisation was conducted with DnaSP (v 5.10 Librado and Rozas 2009), and the number of haplotypes and unique haplotypes were subsequently calculated for each cluster. Due to the low number of individuals sampled in Geumcheon, individuals from clusters 62 and 65 were pooled for the analysis.
Statistical analysis
For ease of redaction, here the number of males producing advertisement calls at a site is summarised by “population size”, despite the obvious lack of non-calling females in the count.
Cluster dataset
We analysed the cluster dataset to determine the factors important to population size through a linear stepwise regression. The variables perimeter and surface area were not entered in the analysis and instead the ratio was used. Finally, the total number of branches was also removed from the analysis because it was correlated with the number of branches <
2 km long (Pearson Correlation; r = 0.76, p < 0.001) and ≥ 2 km long
(Pearson Correlation; r = 0.28, p < 0.001). In the regression model, population size was set as the dependent variable, and the variables ratio, branch < 2 km and branch ≥ 2 km were set as independent variable. The data were entered through a stepwise backward elimination model. All assumptions were met: (1) the dependent variables was a continuous variables, and there were more than two continuous independent variables. (2) All observation were independent, and without first order linear auto-correlation, such as tested through the Durbin-Watson test (d= 1.52, between the critical values 1.5 < d < 2.5). (3) The visual inspection of scatterplots and partial regression plots demonstrated a linear relationship between the dependent variable and each of the independent variables, and between the dependent variable and the independent variables collectively. (4) The data demonstrated homoscedasticity, visually inspected through the scatterplot of regressed standardised predicted values plotted against the regressed standardised residuals, and because the Skewness and Kurtsosis values were below the standard error values. (5) There was no collinearity of variables, with tolerance values between 0.96 and 0.98, and expected to be > 0.1, and VIF values between 1.02 and 1.05 and expected to be < 10. Besides (6), there was only one outlier, although justified and the violation was ignored, and the residuals were normally distributed.
Branch dataset
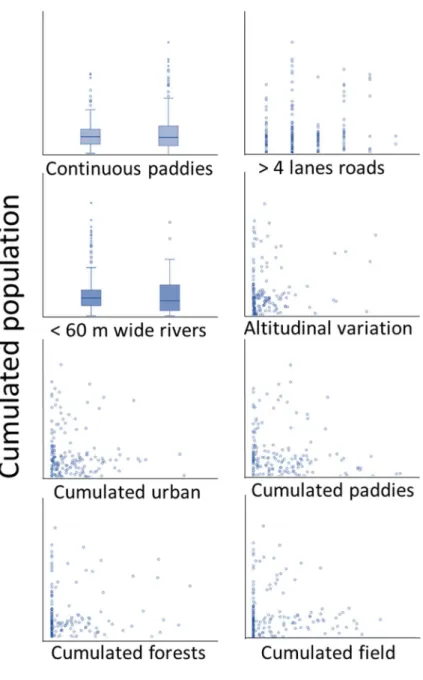
The branch dataset was analysed the same way as the cluster dataset. It was also analysed to determine the factors important to the cumulated population size (i.e. population size cumulated for the two cluster in contact with the focal branch) through a linear stepwise regression. The variable “cumulated distance” was not entered in the analysis because it was correlated with all other factors (Pearson Correlation; 0.22 < r < 0.67, p < 0.003). In the regression model, population size was set as the dependent variable, and the variables contiguous rice paddies, presence of ≥ four-lane roads, presence ≥ 60 m wide rivers, maximum altitudinal variation and cumulated urban, paddy, forest and dry-field distances were set as independent variable. The data were entered through a stepwise backward elimination model. All assumptions were met: (1) the dependent variables was a continuous variables, and there were more than two continuous independent variables. (2) All observation were independent, and without first order linear auto-correlation, such as tested through the Durbin-Watson test (d= 1.74). (3) The visual inspection of scatterplots and partial regression plots demonstrated a linear relationship between the dependent variable and each of the independent variables, and between the dependent variable and the independent variables collectively. (4) The data demonstrated homoscedasticity, visually inspected through the scatterplot of regressed
standardised predicted values plotted against the regressed standardised residuals, and because the Skewness and Kurtsosis values were below the standard error values. (5) There was no collinearity of variables, with tolerance values between 0.19 and 0.78 and VIF values between 1.28 and 5.08. Besides (6), there no outliers and the residuals were normally distributed.
Population dataset
The population dataset (n= 14) was analysed the same way as the two other datasets. It was analysed to determine the factors important to averaged population size per population through a linear stepwise regression. The variables entered in the analysis were the average ratio per population, the average number of branches < 2 km and the average number of branches ≥ 2 km. The other variables were not entered in the regression model to avoid collinearity. In the regression model, the average population size was set as the dependent variable, and the variables average ratio, average number of branches < 2 km and the average number of branches ≥ 2 km were set as independent variable. The data were entered through a stepwise backward elimination model. All assumptions were met: (1) the dependent variables was a continuous variables, and there were more than two continuous independent variables. (2) All observation were independent, and without first order linear auto-correlation, such as tested through the Durbin-Watson test (d=
1.32). (3) The visual inspection of scatterplots and partial regression plots demonstrated a linear relationship between the dependent variable and each of the independent variables, and between the dependent variable and the independent variables collectively. (4) The data demonstrated homoscedasticity, visually inspected through the scatterplot of regressed standardised predicted values by the regressed standardised residuals, and because the Skewness and Kurtsosis values were below the standard error values. (5) There was no collinearity of variables, with tolerance values between 0.77 and 1.00 and VIF values between 1.00 and 1.29. Besides (6), there no outliers and the residuals were normally distributed.
Genetic analyses
Because a large number of variables were correlated, the importance of the landscape and population variables on the total number of haplotypes and the presence of rare haplotype was tested through a Principal Component Analysis. The variables entered in the PCA for factor reduction were population sizes, number of branches < 2 km, number of branches ≥ 2 km, the total number of branches, perimeter and surface area. The linear relationship between all variables was assessed visually though scatterplots. The PCA was based on eigenvalue greater than 1, with varimax orthogonal rotations, and scores were saved as new variables. The new variables were then set as dependent variables in two ANOVAs, once with the total number of haplotypes, and once with the
number of rare haplotypes, set as factor. All statistical analysis were ran through SPSS v21.0 (SPSS, Inc., Chicago, USA).
RESULTS
Geographic connectivity
The clustering of sites based on daily movement patterns leaded to the isolation of 95 clusters, themselves distributed in 14 populations.
Five of the clusters were too isolated to be part of any population, three populations were composed of two clusters, two populations were composed of three clusters and then there was a single population for each of four, 13, 15 and 46 clusters (Fig. 2.1). The largest population was surrounding the bay of Asan (green, 46 clusters), followed by the population around Iksan (red, 16 clusters) and around Paju (purple, 15 clusters). Of smaller sizes, were the populations around Nonsan (black, 4 clusters) south of Icheon (3 clusters, purple) and on Kangwa Island (3 clusters, cyan), followed by the populations of Chungju (light green, 2 clusters) Bucheon (orange, 2 clusters) and Gimpo (yellow, 2 clusters).
Finally, 5 clusters (blue) were not included in any population due to their isolation through distance (Wonju, Eumseong, Buyeo and Iksan) or landscape barriers (Sihung; Fig. 2.1).
Cluster dataset
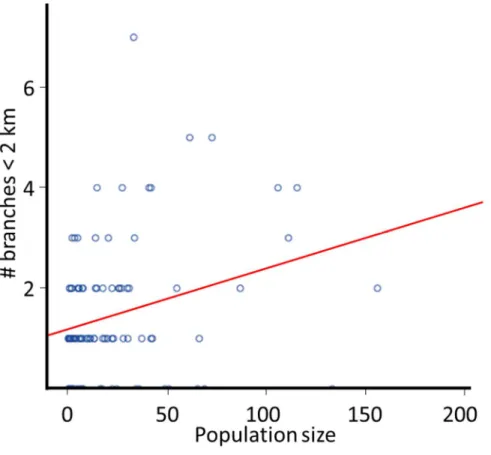
The five clusters with the largest population size had above 100 individuals per site on average over the three years of surveys. Oppositely, there were seven sites with a population of one, or less, in average over the three years of surveys. The average number of individuals at a site was 24.18 ± 13.67 (average ± SD) and the median number of individuals was 30.96. Visual inspection of the dataset highlighted a positive correlation between population size and the number of branches (Pearson correlation;
r= 0.29, n= 94, p= 0.005), already highlighting the important factors. All three variables entered in the linear stepwise regression with backward elimination to assess the variables important for the population size were retained. The regression model was a good fit for the data (F(3, 90) = 3.64,p= 0.016). The prediction of the dependent variable was adequate (R = 0.33), while the variance in population size was only explained at 10.8 % by the independent variables (R2= 0.108). The only variable with a significant model coefficient was the number of branches < 2 km, despite high coefficients values for both the constant and the ratio (Table 2.1). Ad-hoc analysis highlighted an increase in population size with the number of branches < 2 km (Fig. 2.2).
Branch dataset
Before analysis, the landscape variables covered by branches were thought to be important to the combined population size assigned to each