저작자표시-비영리-변경금지 2.0 대한민국 이용자는 아래의 조건을 따르는 경우에 한하여 자유롭게
l 이 저작물을 복제, 배포, 전송, 전시, 공연 및 방송할 수 있습니다. 다음과 같은 조건을 따라야 합니다:
l 귀하는, 이 저작물의 재이용이나 배포의 경우, 이 저작물에 적용된 이용허락조건 을 명확하게 나타내어야 합니다.
l 저작권자로부터 별도의 허가를 받으면 이러한 조건들은 적용되지 않습니다.
저작권법에 따른 이용자의 권리는 위의 내용에 의하여 영향을 받지 않습니다. 이것은 이용허락규약(Legal Code)을 이해하기 쉽게 요약한 것입니다.
Disclaimer
저작자표시. 귀하는 원저작자를 표시하여야 합니다.
비영리. 귀하는 이 저작물을 영리 목적으로 이용할 수 없습니다.
변경금지. 귀하는 이 저작물을 개작, 변형 또는 가공할 수 없습니다.
이학박사 학위논문
Pressure-induced changes in carbon speciation and atomic structures of carbon-bearing silicate glasses and crystals in Earth's mantle up to 14 GPa: Insights from multi-nuclear
solid-state NMR and Raman spectroscopy
지구 맨틀의 최대 14 GPa 까지에서 탄소를 포함하는 비정질
및 결정질 규산염 물질의 압력에 따른 탄소 화학종 및 원자 구조 변화 : 고상 핵자기공명 분석 및 라만 분광분석 연구
A dissertation in partial fulfillment of the requirements for the degree of Doctor of Philosophy
2019 년 2 월
서울대학교 대학원 지구환경과학부
김 은 정
i
Abstract
Pressure-induced changes in carbon speciation and atomic structures of carbon-bearing silicate glasses and crystals in Earth's mantle up to 14 GPa: Insights from multi-nuclear
solid-state NMR and Raman spectroscopy
Eun Jeong Kim School of Earth and Environmental Sciences The Graduate School Seoul National University
Mantle is the largest carbon reservoir in the Earth and the speciation of carbon in the Earth’s interior plays an important role in the geophysical and geochemical properties of silicate melts and overall distribution of carbon in the mantle. Due to its importance, previous researchers have reported the speciation and the solubility of carbon in silicate melts at high pressure up to 4 GPa. Yet the speciation of carbon in silicate melts and the effect of carbon species on silicate melts and crystals at high pressure above 4 GPa up to 14 GPa is not fully understood due to the difficulties in
synthesizing samples and the lack of suitable probes to detect carbon species.
This dissertation is for a systematic exploration of pressure-induced speciation of carbon in silicate glasses and crystals at high pressure up to 14 GPa using multi-nuclear (13C, 27Al, 29Si, 17O, and 7Li) solid-state nuclear
ii
magnetic resonance (NMR) and Raman spectroscopy. The main objective of this thesis is probing and quantifying the carbon species in silicate melts and crystals at high pressure. The pressure-induced structural changes of alkali silicate melts at high pressure is also studied.
The systematic protocols to characterize carbon-bearing fluid inclusions and other carbon-bearing species in enstatite synthesized with
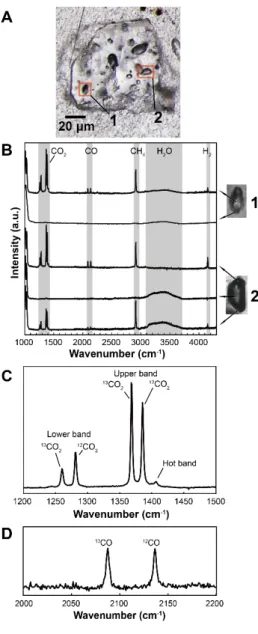
13C-enriched amorphous carbon were established using high-resolution 13C solid-state NMR and Raman spectroscopy. The Raman spectra revealed the presence of various molecular species in fluid inclusion, such as CO2, CO, CH4, H2O, and H2, and their heterogeneous distribution in carbon-bearing fluid inclusion. 13C MAS NMR spectra showed the presence of CO2, CO, and CO32- in enstatite. As the carbonate species is not observed in fluid
inclusions by Raman spectroscopy, the relationship between 13C abundance and peak intensity in the 13C magic angle spinning (MAS) NMR was
established to identify the phase of carbonate species in the carbon-bearing enstatite. The estimated carbonate species is ~28–45 ppm, which is much higher than the solubility of carbon species in enstatite (0.05–4.7 ppm). The current methods to characterize carbon-bearing species in enstatite using Raman and NMR spectroscopy can be used to provide quantitative analysis of carbon species in silicate crystals.
The structural changes of carbon and its effect on the silicate network in binary sodium silicate and ternary sodium aluminosilicate melts at high pressure up to 8 GPa were investigated using multi-nuclear solid-state NMR. In binary sodium silicate melts, only carbonate species are observed, and the formation of bridging carbonates is observed above 6 GPa. In contrast, the presence of CO2, CO, and CO32- is observed in ternary sodium
iii
aluminosilicate melts at high pressure up to 6 GPa, and the fraction of carbonate species gradually increases with increasing pressure. Among four carbonate species, the fraction of Al(CO3)Si increases the most with
increasing pressure which may be related to the topological disorder of Al in 27Al 3QMAS NMR spectra for carbon-bearing sodium aluminosilicate melts. Based on the peak intensity in 13C MAS NMR spectra and the spin- lattice relaxation time of CO2 in carbon-bearing sodium aluminosilicate melts, the total carbon contents gradually increase from ~1 wt% at 1.5 GPa to ~4 wt% at 6 GPa. The current results on the speciation of carbon in silicate melts above 4 GPa give insights into the carbon species and its contents in carbon-bearing silicate melts in the upper mantle.
To identify the structural changes of carbon-free silicate melts at high pressure and the effect of cation mixing in those melts, multi-nuclear solid- state NMR study on the Na-Li silicate glasses quenched from melts at high pressure up to 8 GPa was performed. 29Si MAS NMR spectra of Na-Li silicate glasses show a relatively constant ratio of highly coordinated Si at high pressure regardless of lithium content (XLi). 7Li MAS NMR spectra of Na-Li silicate glasses show continuous changes of peak position and widths with varying XLi and pressure. Based on the spin-spin relaxation of 7Li in Na-Li silicate glasses at high pressure, the cation disorder of Na and Li changes from random distribution to more chemically ordered structure with increasing pressure in XLi = 0.50 and 0.75. This indicates the pressure- induced chemical order in mixed alkali cations in silicate melts at high pressure.
The structural changes of carbon species in silicate melts at high pressure up to 14 GPa were investigated using Raman spectroscopy and
iv
solid-state NMR. In carbon-bearing sodium aluminosilicate glasses, the fraction of bridging carbonates increases with increasing pressure up to 9.2 GPa, which is generally consistent with previous theoretical calculations.
Raman spectra of carbon-bearing sodium aluminosilicate crystals formed at 14 GPa showed the presence of nano-diamonds in the sample and 13C MAS NMR spectra showed the presence of carbonate minerals and nano-
diamonds. In carbon-bearing sodium silicate melts at high pressure up to 14 GPa, the fraction of bridging carbonates [Si(CO3)Si] increases up to ~60 % with increasing pressure up to 14 GPa. The increase of bridging carbonates with pressure may provide insight into the structural proxy of
polymerization of carbon-bearing silicate melts at high pressure and immiscibility of carbonatite and silicate melts in the mantle.
Keywords: carbon species, silicate melts, high pressure, solid-state nuclear magnetic resonance, Raman spectroscopy
Student Number: 2012-30094
v
Table of Contents
Abstract ... i
List of Figures ... x
List of Tables ... xviii
Chapter 1. Introduction ... 1
1.1. Introduction ... 1
1.2. Estimation of carbon budget in the mantle ... 5
1.3. Carbon flux between Earth’s surface and the mantle ... 7
1.4. The speciation of carbon in silicate crystals and glasses at high pressure ... 10
1.5. Pressure-induced structural changes of silicate melts at high pressure ... 14
1.6. Introduction to multi-anvil press ... 16
References ... 20
Chapter 2. Probing carbon-bearing species and CO2 inclusion in amorphous carbon-MgSiO3 enstatite reaction products at 1.5 GPa: Insights from 13C high-resolution solid-state NMR ... 35
Abstract... 35
2.1. Introduction ... 36
2.2. Experimental & computational methods ... 41
2.2.1. Sample preparation ... 41
2.2.2. Raman spectroscopy ... 42
2.2.3. NMR spectroscopy ... 43
2.2.4. Quantum chemical calculations ... 45
2.3. Results ... 45
2.3.1. Probing of CO2 in fluid inclusions in carbon-bearing enstatite: Insights from Raman spectroscopy ... 45
2.3.2. Probing of carbon species and inclusion in carbon-bearing enstatite: 13C MAS NMR results ... 49
vi
2.3.3. Pressure-induced structural changes of amorphous carbon:
Insights from 13C MAS NMR ... 51
2.4. Discussion ... 56
2.4.1. Origin of peak at 125.2 ppm in carbon-bearing enstatite ... 56
2.4.2. 13C NMR chemical shift for orthocarbonate species ([4]C): Insights from quantum chemical calculations ... 58
2.4.3. External vs. structurally-incorporated carbon species in the carbon-bearing enstatite: Insights from quantitative 13C spin counting experiment using ADM-SiO2 mixture ... 60
2.4.4. Sources of 12C contamination... 65
2.5. Implications ... 66
Appendix ... 69
References ... 80
Chapter 3. Effect of pressure on the short-range structure and speciation of carbon in alkali silicate and aluminosilicate glasses and melts at high pressure up to 8 GPa: 13C, 27Al, 17O and 29Si solid-state NMR study ... 94
Abstract... 94
3.1. Introduction ... 96
3.2. Experimental Methods ... 102
3.2.1. Sample preparation ... 102
3.2.2. NMR spectroscopy ... 106
3.3. Results ... 109
3.3.1. 27Al 3QMAS NMR results: Pressure-induced topological disorder in Al in carbon-bearing albite glasses quenched from melts at high pressure up to 6 GPa ... 109
3.3.2. 29Si MAS NMR results: carbon-bearing Na2O-3SiO2 and albite glasses quenched from melts at high pressure ... 111
3.3.3. 17O NMR results: oxygen environments in carbon-bearing Na2O- 3SiO2 glasses quenched from melts at high pressure ... 115
3.3.4. 13C MAS NMR results of carbon-bearing albite glasses quenched from melts at high pressure ... 117
vii
3.3.5. 13C MAS NMR results for carbon-bearing NS3 glasses quenched
from melts at high pressure up to 8 GPa ... 121
3.3.6. Quantitative measurements of the speciation of carbon in albite melts by 13C MAS NMR spectra using 13C spin-lattice (T1) relaxation results and analyses ... 123
3.4. Discussion ... 129
3.4.1. 13C NMR peak assignment of bridging carbonate ions in carbon- bearing albite and NS3 glasses ... 129
3.4.2. 13C NMR peak assignment of free carbonate ions in carbon- bearing NS3 glasses ... 130
3.4.3. Origin of the presence of bridging carbonate ions in NS3 glasses upon compression ... 131
3.4.4. The speciation of carbonates in albite glasses quenched from melt at high pressure ... 132
3.4.5. Presence of CO in albite glasses quenched from melts at high pressure ... 135
3.4.6. Effect of carbon speciation on the properties and isotope composition in silicate melts at high pressure ... 136
3.5. Conclusion ... 140
Appendix ... 142
References ... 151
Chapter 4. Effect of chemical disorder on structural changes in Na-Li silicate glasses quenched from melts at high pressure ... 167
Abstract... 167
4.1. Introduction ... 168
4.2. Experimental methods ... 173
4.2.1. Sample preparation ... 173
4.2.2. NMR spectroscopy ... 174
4.3. Results ... 175
4.3.1. Structural changes in Si in NLS3 glasses: Insights from 29Si MAS NMR ... 175
viii
4.3.2. Structure of Li+ in NLS3 glasses quenched from melts at high
pressures: Insights from 7Li MAS NMR results ... 180
4.3.3. Distribution of 7Li in NLS3 glasses: Insights from spin-spin relaxation of 7Li in NLS3 glasses ... 184
4.3.4. Fraction of non-bridging oxygen in NLS3 glasses at high pressures: Insights from 17O 3QMAS NMR results ... 189
4.3.5. Distribution of mixed cations of different ionic radii in silicate melts at high pressures ... 195
4.4. Conclusion ... 196
Appendix ... 198
References ... 210
Chapter 5. Speciation of carbon in aluminosilicate glasses and crystals at high pressure up to 14 GPa: Insights from 13C solid-state NMR and Raman spectroscopy ... 221
5.1. Introduction ... 221
5.2. Experimental methods ... 225
5.2.1. Sample preparation ... 225
5.2.2. NMR spectroscopy ... 226
5.2.3. Raman spectroscopy ... 227
5.2.4. SEM/EDS analysis ... 228
5.3. Results ... 228
5.3.1. Characterization of C-bearing aluminosilicate crystals at 14 GPa ... 228
5.3.2. Raman spectra ... 230
5.3.3. 13C MAS NMR spectra of C-bearing aluminosilicate glasses and crystals at high pressure ... 233
5.3.4. 27Al 3QMAS NMR spectra and 29Si MAS NMR spectra of C- bearing aluminosilicate glasses and crystals at high pressure ... 237
5.3.5. 13C and 29Si MAS NMR spectra of C-bearing alkali silicate glasses at high pressure ... 241
ix
5.3.6. Quantification of carbon species in albite glasses by 13C MAS
NMR spectra ... 244
5.4. Discussion ... 247
5.4.1. Peak assignment of graphite and nano-diamond quenched from high pressure and high temperature conditions ... 247
5.4.2. Peak broadening of CO2 in C-bearing albite glasses with increasing pressure ... 249
5.4.3. Redox reaction of carbon and the oxygen fugacity of mantle .... 250
5.5. Conclusion ... 253
References ... 254
Appendix. ... 265
A1. Abstract Published in Korean Journal ... 265
A2. Publication list ... 267
요약 (국문초록) ... 272
x
List of Figures
Figure 1.1. (a) A photograph of 1100-ton multi-anvil press equipped in author’s laboratory, Seoul National University. (b) A plan view of the multi-anvil press (open square with label “b”) in Fig. 1.1a. A containment ring, three first-stage anvils (1st anvil) and assembled second-stage anvils (2nd anvil) are shown. (c) A section drawing of the multi-anvil press. Grey, violet, yellow, and green areas represent pistons, a containment ring, first-stage anvils, and second-stage anvils, respectively. The black arrows show the direction of force applied to pistons. (d) Photographs of an octahedral pressure medium and a second-stage anvil. OEL is referred to the octahedral edge lengths the pressure medium and TEL is an abbreviation of truncated edge lengths of the second-stage anvil. (e) A schematic diagram of an assembly set with straight heater (open square with label “e”) in Fig. 1.1c.
Figure 2.1. (A) A stereoscopic micrograph image of one of the grains of carbon-bearing enstatite. The size of the grain is 80 μm (w) × 100 μm (h) and the fluid inclusions are 4 μm (w) × 10 μm (h) (indicated with red rectangles). (B) Raman spectra for carbon-bearing enstatite in the frequency range of 1000–4300 cm-1 and (C) that in the range of 1200–
1500 cm-1 and (D) 2000–2200 cm-1.
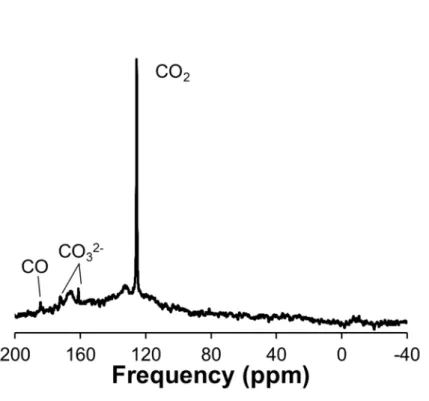
Figure 2.2. 13C NMR spectra for carbon-bearing enstatite and stator and rotor backgrounds at 11 kHz of spinning speed (top), that at 14 kHz of spinning speed (middle), and rotor and stator background at 14 kHz (bottom). The asterisks and dotted arcs denote expected positions of
xi
spinning side bands for background signal at 130 ppm. The spinning sideband of the spectrum for carbon-bearing enstatite at 14 kHz overlaps with a small peak at ~ -9 ppm.
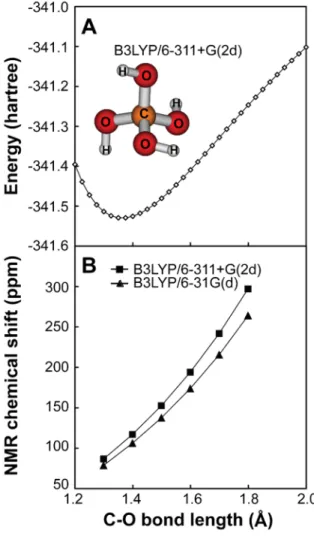
Figure 2.3. (A) Single point energy of C(OH)4 cluster with varying C–O bond length. A model C(OH)4 cluster is also shown in the inset. (B) NMR chemical shift of C(OH)4 cluster with varying C–O bond length.
Figure 2.4. (Top) 13C MAS NMR spectrum for the mixtures of ADM-SiO2 with varying ADM/SiO2 ratio [XADM = 1/4 (25 wt%, 2750 ppm of 13C), 1/8 (12.5 wt%, 1375 ppm of 13C), 1/16 (6.25 wt%, 688 ppm of 13C), 1/50 (2.0 wt%, 220 ppm of 13C), 1/233 (0.43 wt%, 47 ppm of 13C), 1/310 (0.32 wt%, 35 ppm of 13C)].
(Bottom) Variation of peak intensity in the ADM-SiO2 mixture as a function of
13C abundance (in ppm) calculated from nominal XADM ratio and peak area of carbon species in 13C MAS NMR spectra. Diamonds and circles refer to the amounts of 13C estimated from nominal XADM ratio with and without proton decoupling, respectively. Their peak areas were retrieved from 13C MAS NMR results for ADM-SiO2 mixtures. Rectangles refer to the amounts of 13C species in carbon-bearing enstatite estimated from 13C MAS NMR spectra for carbon- bearing enstatite.
Figure 2.A1. 13C MAS NMR spectrum for carbon-bearing enstatite under proton decoupling with an applied Lorentzian broadening factor of 40.
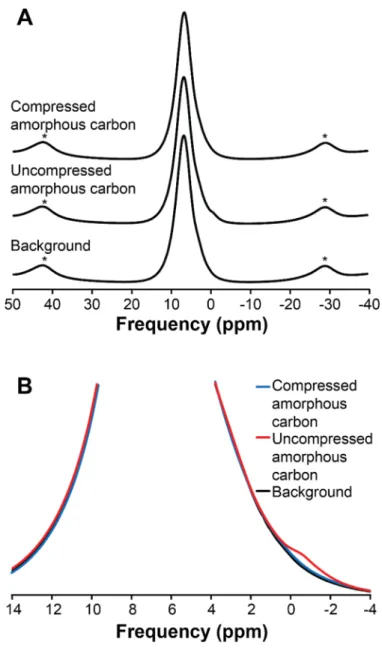
Figure 2.A2. (A) 1H MAS NMR spectra for compressed amorphous carbon, amorphous carbon, and rotor-stator background. Asterisks denote spinning sidebands. (B) Expanded 1H MAS NMR spectra for the samples as labeled.
Figure 2.A3. 13C MAS NMR spectra for ADM-SiO2 mixtures with varying XADM ratio with decoupling power of 33 kHz.
Figure 2.A4. 13C NMR spectra for 1 M Na213CO3(aq), 1 M
xii
(Na213CO3+NaHCO3)(aq), calcite, and natrite with an employed Lorentzian broadening factor of 10.
Figure 2.A5. XRD patterns of enstatite-calcite mixture with varying Xcalcite
from 0 to 1/32. Blue and red lines on the top of the figure refer to XRD patterns of enstatite and calcite, respectively. A red area shows the decrease of calcite intensity with decreasing Xcalcite in the sample.
Figure 3.1. 27Al 3QMAS NMR spectra for carbon-bearing albite glasses quenched from melts at 1.5 and 6 GPa and for carbon-free albite melts at 1 atm and 8 GPa.
Figure 3.2. (A) 29Si MAS NMR spectra for carbon-bearing NS3 (Na2O-3SiO2) glasses quenched from melts at 1 atm, 6, and 8 GPa in the range of -50 – -250 ppm. Inset shows 29Si MAS NMR spectra for carbon-bearing NS3 melts at 1 atm, 6, and 8 GPa in the range of -60 – -130 ppm. (B) 29Si MAS NMR spectra for carbon-bearing albite glasses quenched from melts at 1.5 and 6 GPa.
Figure 3.3. 17O 3QMAS NMR spectrum for carbon-bearing NS3 melts at 6 GPa.
Figure 3.4. (A) Background-included and (B) background-subtracted 13C MAS NMR spectra for carbon-bearing albite melts at 1.5 and 6 GPa. The spectra are normalized with the weight of the samples. Spinning
sidebands are marked with an asterisk. The numbers labeled on the right side of the spectra refer to the amount of input CO2 in the system.
See section 3.2.2 for the measurement of background signal.
Figure 3.5. (A) 13C MAS NMR spectra for carbon-bearing NS3 melts at 4, 6, and 8 GPa (blue) and background (black). (B) background-subtracted
13C MAS NMR spectra for carbon-bearing NS3 melts at 4, 6, and 8 GPa.
xiii
Spinning sidebands are marked with an asterisk. The numbers labeled on the right side of the spectra refer to the amount of input CO2 in the system. See section 2.2 for the measurement of background signal Figure 3.6. Saturation-recovery of CO2 in the carbon-bearing albite melts at
1.5 GPa and 6 GPa. Diamonds and circles refer to the normalized peak intensity of carbon-bearing albite glasses at 1.5 and 6 GPa, respectively, with varying delay time. Solid lines and dashed lines refer to calculated peak intensity, following the spin-lattice relaxation time equation. Error bars represent a 10% error.
Figure 3.7. Carbon contents in the albite melts with increasing pressure.
Black, blue, red, and violet closed circles refer to total carbon content and the amount of CO2, CO32-, and CO species in albite glasses calculated from 13C MAS NMR spectra, respectively. Open triangles and rectangles refer to data from Stolper et al. (1987) and Brooker et al.
(1999), respectively.
Figure 3.8. (Top) Simulation results for 13C MAS NMR spectra for
carbonates in carbon-bearing albite melts with varying pressure at 1.5 and 6 GPa. Green, red, blue, purple, and black lines correspond to
[4]Si(CO3)[4]Si, [4]Si(CO3)[4]Al, [4]Al(CO3)[4]Al, free carbonates (Na··CO32-), and total simulation results, respectively. (Bottom) Variations in the CO32- ion population with pressure in carbon-bearing albite melts. Blue, red, and green circles refer to [4]Al(CO3)[4]Al, [4]Si(CO3)[4]Al, and
[4]Si(CO3)[4]Si, respectively. Violet triangles denote free CO32- ions near the non-bridging oxygen in network polyhedra, charge-balancing with the Na+ ions. Open symbols refer to data from Brooker et al. (1999).
Figure 3.S1. 27Al MAS NMR spectra for carbon-bearing albite glasses at 1.5
xiv
and 6 GPa and that for carbon-free albite glasses at 1 atm.
Figure 3.S2. (Top) 29Si MAS NMR spectra and simulation results for carbon-bearing NS3 glasses with varying pressure up to 8 GPa. Red, green, and blue lines correspond to Q2, Q3, and Q4 species, respectively. (Bottom) Population of Si atom species for carbon-bearing NS3 glasses with varying pressure up to 8 GPa. Red, green, and blue circles correspond to Q2, Q3, and Q4 species, respectively.
Figure 3.S3. 17O MAS NMR spectrum for carbon-bearing NS3 glasses at 6 GPa.
Figure 3.S4. (Top) Simulation results for 13C MAS NMR spectra for carbon- bearing NS3 glasses at high pressure up to 8 GPa. Violet and green lines correspond to free carbonates and bridging carbonates, respectively.
(Bottom) The population of carbon species in carbon-bearing NS3 glasses. Violet and green circles correspond to free carbonates and bridging carbonates, respectively.
Figure 4.1. 29Si MAS NMR spectra of NLS3 glasses with XLi = 0.25 at different pressures
Figure 4.2. 29Si MAS NMR spectra of NLS3 glasses with varying XLi (a) at 1 atm and (b) at 6 GPa.
Figure 4.3. (a) 7Li MAS NMR spectra of NLS3 glasses with varying XLi at 1 atm. (b) 7Li MAS NMR spectra of NLS3 glasses with XLi = 0.25 and at different pressure up to 8 GPa. (c) 7Li MAS NMR spectra of NLS3 glasses with varying XLi at 6 GPa. (d) FWHM of 7Li in NLS3 glasses with different XLi and at different pressures. (e) Peak position of 7Li in NLS3 glasses with varying XLi and pressure.
Figure 4.4. (A) Evolution of the 7Li NMR spectra of NLS3 glasses with different XLi and at pressures up to 8 GPa. The black, blue, and red lines
xv
represent the peak intensity of 7Li NMR spectra at 1 atm, 6 GPa, and 8 GPa, respectively. (B) 7Li T2 curves at XLi = 0.25, 0.50, and 0.75 as functions of pressure up to 8 GPa.
Figure 4.5. (A) 17O 3QMAS NMR spectra of NLS3 glasses with varying XLi
and at different pressures up to 6 GPa. Contour lines are drawn at 5%
increments from 13 to 93% of the relative intensity, with added lines at 5%, 7%, and 10% to show low-intensity peaks better. (B) Total isotropic projection of the 17O 3QMAS NMR spectra of NLS3 glasses at different pressures and XLi values.
Figure 4.6. (Top) Simulation for the total isotropic projection of the 17O 3QMAS NMR spectra of NLS3 glasses at different XLi and pressures.
(Bottom) The estimated oxygen fraction in NLS3 glasses as a function of pressure and XLi.
Figure 4.S1. (Top) Simulation results of the 29Si MAS NMR spectra of NLS3 glasses with varying XLi and at different pressure up to 8 GPa. The thin green, red, blue, and black lines correspond to Q2, Q3, Q4, and total simulation results, respectively. (Bottom) Variations in the Qn fraction with respect to pressure in the NLS3 glasses. The triangles, rectangles, and circles refer to XLi = 0.25, 0.50, and 0.75, respectively. The green, red, and blue colors correspond to Q2, Q3, and Q4, respectively.
Figure 4.S2. 7Li MAS NMR spectra of NLS3 glasses with XLi = 0.25 at 14.1 T.
Figure 4.S3. 17O MAS NMR spectra of NLS3 glasses with varying pressure and XLi at 9.4 T.
Figure 4.S4. Raman spectra of NLS3 glasses with varying XLi and at different pressures up to 6 GPa.
Figure 4.S5. Full-width at half-maximum (FWHM) in 7Li MAS NMR spectra
xvi
(blue) and those derived from T2 of 7Li NMR spectra (black). Triangle, square, and circles refer to XLi = 0.25, 0.50, and 0.75, respectively.
Figure 5.1. Stereoscopic micrographs of (a) C-bearing aluminosilicate
glasses at 9.2 GPa and (b) C-bearing aluminosilicate glasses and crystals at 14 GPa inside and (c) outside. (d) A stereoscopic micrograph of C- bearing aluminosilicate crystals and glasses synthesized at 14 GPa. (e) BSE image of C-bearing aluminosilicate crystals and glasses
synthesized at 14 GPa. (f) Close-up view of transparent particles (5‒15 μm). (g) Close-up view of small white particles in fig. e. (h) BSE image of C-bearing albite glasses at 9.2 GPa. (i-l) EDS patterns of labelled particles in fig. f and h.
Figure 5.2. Raman spectra for C-bearing aluminosilicate crystals and glasses at 14 GPa, C-bearing albite glasses at 9.2 GPa, and Na2CO3 at 1 atm.
Inset images were obtained from C-bearing aluminosilicate crystals and glasses at 14 GPa (left: inside, right: outside). Asterisks refer to central spike in Raman spectra.
Figure 5.3. 13C MAS NMR spectra for C-bearing albite glasses at high pressure up to 9.2 GPa. The data of 1.5 and 6 GPa are from Kim et al.
(2018). The peak intensities are in the absolute value, corrected to the sample weight. The asterisks refer to spinning side bands.
Figure 5.4. 13C MAS NMR spectra for C-bearing aluminosilicate crystals (NaAlSi2O6 + SiO2) at 14 GPa, C-bearing albite glasses at high pressure up to 9.2 GPa, and Na2CO3. The peak intensities are normalized to its highest height. Asterisks refer to spinning side bands.
xvii
Figure 5.5. (A) 27Al MAS and (B) 3QMAS NMR spectra for C-free albite glasses at 1 atm and C-bearing albite glasses at high pressure up to 9 GPa.
Figure 5.6. 29Si MAS NMR spectra for C-bearing aluminosilicate crystals (NaAlSi2O6 + SiO2) at 14 GPa, C-bearing albite glasses at high pressure up to 6 GPa.
Figure 5.7. 13C MAS NMR spectra for C-bearing sodium trisilicate glasses quenched from melts at high pressure up to 14 GPa.
Figure 5.8. 29Si MAS NMR spectra for C-bearing sodium trisilicate (NS3) glasses quenched from melts at high pressure up to 14 GPa.
Figure 5.9. Carbon contents in the C-bearing albite glasses with increasing pressure up to 9.2 GPa. Black, blue, red, and violet closed circles
correspond to total carbon, CO2 CO32-, and CO contents in albite glasses calculated from 13C MAS NMR spectra, respectively. Open triangle, rectangle, and diamonds correspond to previous data from Stolper et al.
(1987), Brooker et al. (1999), and Guillot and Sator (2011), respectively.
xviii
List of Tables
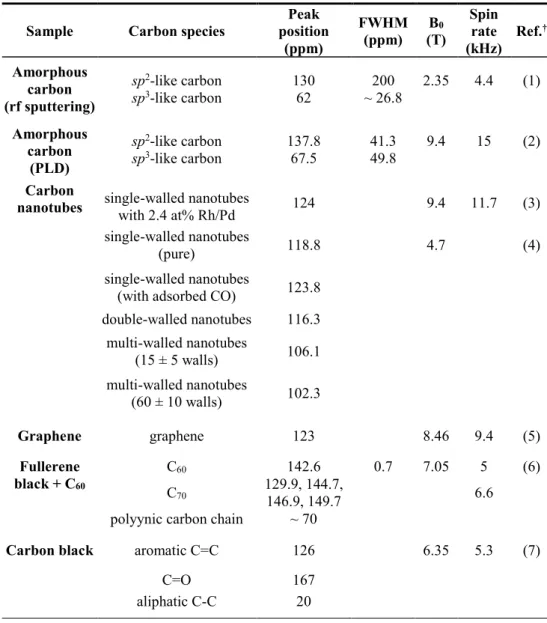
Table 2.1. 13C NMR chemical shift for various crystalline and amorphous carbon materials.
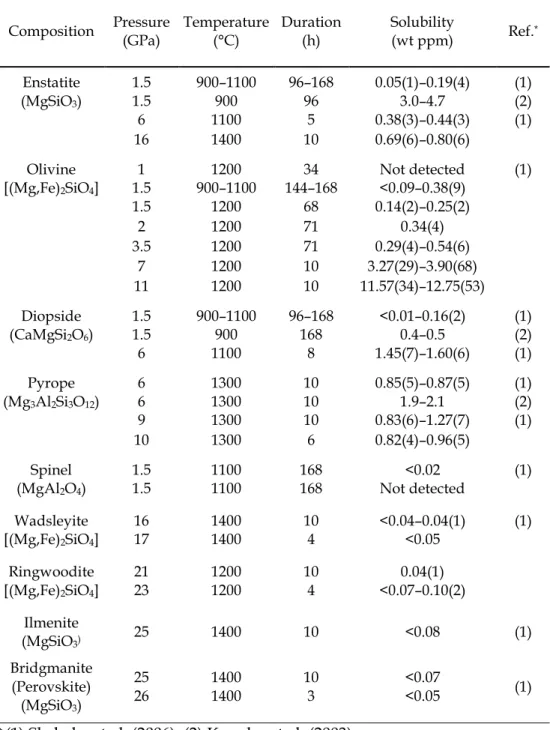
Table 2.A1. Solubility of carbon species in crystalline silicates with varying composition, pressure, and temperature, as reported in previous studies.
Table 3.1. Experimental condition on carbon-bearing silicate glasses quenched from melts at high pressure.
Table 3.S1. Simulation parameters and results for 13C MAS NMR spectra for carbon-bearing NS3 glasses quenched from melts at high pressure up to 8 GPa.
Table 4.1. The estimated fractions of [5]Si and [6]Si in Na-Li trisilicate glasses quenched from melts at high pressures; the fractions are estimated from the peak areas in the 29Si MAS NMR spectra.
Table 4.2. Peak maxima in the 7Li MAS NMR spectra of Na-Li trisilicate glasses with different compositions and at different pressures.
Table 4.3. A simulation parameter for the integrated peak area of the recovered 7Li NMR signal with respect to the echo time (τ).
Table 4.S1. The estimated fraction of Qn species in Na-Li trisilicate glasses quenched from melts at high pressures; the values are obtained by the simulation of peak areas of 29Si MAS NMR spectra.
Table 4.S2. Raman modes corresponding to binary Na- and Li-silicate glasses and SiO2 glasses.
1
Chapter 1. Introduction
1.1. Introduction
Geological processes originated from the Earth’s interior, such as volcanic eruptions and earthquakes, are related to the macroscopic properties of crystalline and amorphous silicates at high pressure, which depend on their microscopic structures. For example, the changes in coordination number of network-former cations and oxygen, and
topological and chemical disorder of silicate melts at high pressure affects the viscosity of silicate melts at high pressure (Lee, 2005, 2010). The presence of volatile species, such as CO2, in silicate melts and crystals changes the viscosity and chemical composition of silicate melts, and the overall carbon flux between the Earth’s surface and interior (Ni and Keppler, 2013 and references therein). Therefore, it is important to understand the atomistic structure of earth materials at high pressure to understand macroscopic properties of silicate crystals and melts and diverse geological processes.
The pressure-induced structural changes of silicate melts with or without the presence of volatile species is one of the importance processes in the Earth’s interior. CO2 is one of the most abundance volatiles in the magma (Hazen et al., 2012), and the presence of carbon species in the diverse earth environments affects the geochemical and geophysical processes. For example, burial of organic carbon in oceanic sediments and its subduction into the mantle by the subducting oceanic crust can change the fraction of O2 in the atmosphere (Duncan and Dasgupta, 2017; Ruhl et al., 2009), and oxidation of reduced carbon species in the mantle would affect the oxygen fugacity in the mantle (Nicholis and Rutherford, 2009;
2
Pawley et al., 1992; Stagno et al., 2013). The decomposition of carbonates within the subduction zone provides CO2 in the mantle, resulting in the volatile-induced formation of silicate melts and recycling of CO2 to the atmosphere by the volcanic eruption (Blundy et al., 2010; Galvez et al., 2016;
Mann and Schmidt, 2015). The volatile-induced formation of silicate melts is one of the several causes to form a low velocity zone at the boundary of upper mantle-transition zone (~410 km depth) (Revenaugh and Sipkin, 1994; Song et al., 2004).
The structural changes of silicate melts at high pressure without volatile species is also important as their structural changes at high pressure give insights into the anomalous changes in the macroscopic properties of the corresponding liquids. For example, diffusivity of oxygen in silicate melts at high pressure showed the non-linear behavior with increasing pressure and this non-linearity is closely related to the fraction of [5]Al and
[5]Si at high pressure (Poe et al., 1997). The changes of viscosity in silicate melts at high pressure is related to the decrease of non-bridging oxygen (NBO) in the silicate melts at high pressure (e.g., Lee, 2004, 2010; Lee et al., 2003). In addition, the diffusivity of cations in silicate melts are closely related to the cation disorder in silicate melts (Ali et al., 1995; Gee and Eckert, 1996), resulting in the distribution of cations during the magma ocean (Lee et al., 2008a; Park and Lee, 2012, 2016).
Revealing the effect of pressure on the speciation of carbon, the distribution of mixed-cations in silicate melts, and the relevant structural changes of silicate melts at high pressure is important to understand the thermodynamic and transport properties of silicate melts at high pressure.
For example, the addition of carbon as CO2 in alkali aluminosilicate melts
3
affects the viscosity of silicate melts at constant pressure (Brearley and Montana, 1989; White and Montana, 1990), and the presence of carbonate species in silicate melts may cause the drastic decrease of viscosity in carbon-bearing silicate melts at high pressure (Kono et al., 2014). As the fraction of carbon species in silicate melts varies with increasing pressure (Brooker et al., 2001a), probing the speciation of carbon in carbon-bearing silicate melts at high pressure can provide insights into the changes in thermodynamic and transport properties of silicate melts, and shed light on the geochemical and geophysical processes in the Earth.
Because of its importance, the solubility and the speciation of carbon in silicate melts at high pressure has been extensively studied at high pressure up to 4 GPa (e.g., Eggler and Kadik, 1979; Eggler and Rosenhauer, 1978; Fine and Stolper, 1985; Kohn et al., 1991; Morizet et al., 2010; Mysen et al., 1975; Nowak et al., 2004). Previous studies revealed that the solubility of carbon increases with increasing the NBO/T ratio, proportion of SiO2 ratio, the fraction of Ca, Mg contents, and the pressure (e.g., Blank and Brooker, 1994; Fine and Stolper, 1985; King and Holloway, 2002; Kohn et al., 1991;
Morizet et al., 2010; Mysen et al., 2009; Nowak et al., 2004; Stolper et al., 1987). However, due to the difficulties in synthesizing the sample above 4 GPa and the lack of suitable probes to detect carbon species in silicate melts at high pressure above 4 GPa, experimental data on the carbon species and its contents in silicate melts at high pressure above 4 GPa has been limited.
Therefore, in this study, I aim to elucidate the speciation of carbon in binary sodium silicate and ternary sodium aluminosilicate melts at high pressure up to 14 GPa.
This thesis consists of six chapters including Introduction (this
4
chapter) and appendix. In chapter 2, protocols to probe carbon-bearing species and CO2 inclusion in the reaction product of amorphous carbon- MgSiO3 enstatite at 1.5 GPa was studied using 13C solid-state NMR and Raman spectroscopy (Kim et al., 2016). In this study, information on the collective vibration of molecules of different isotopes in Raman spectra and element-specific information on the carbon species in silicate crystals in 13C NMR give complementary information on the carbon species in crystalline silicates, such as spatial distribution of carbon species and the total carbon contents. In addition, the calibration of carbon contents and 13C NMR spectra is reported. In chapter 3, the effect of pressure on the short-range structure and speciation of carbon in alkali silicate and aluminosilicate glasses and melts at high pressure up to 8 GPa was explored using multi- nuclear solid-state NMR (Kim et al., 2018). The first experimental data of the speciation of carbon in carbon-bearing silicate glasses at high pressure is reported. The protocol to measure the carbon contents in carbon-bearing silicate glasses at high pressure is provided taking into consideration the pressure-induced changes in spin-lattice relaxation time of carbon species at high pressure. In chapter 4, the effect of pressure on the cation disorder and the relevant structural changes of silicate network in Na-Li silicate melts was studied with varying pressure and the ratio of Li/(Na+Li) (Kim et al., in preparation). The cation disorder of Li is estimated by the 7Li spin-spin relaxation time at high pressure up to 8 GPa. In chapter 5, the speciation of carbon in binary sodium silicate glasses and ternary sodium aluminosilicate melts and crystals at high pressure up to 14 GPa was studied using Raman spectroscopy and multi-nuclear solid-state NMR (Kim and Lee, in
preparation). The presence of hexagonal diamonds was observed inside of
5
the sodium aluminosilicate crystals. As the Na2CO3 is used as a carbon reservoir, the transformation of carbonate into hexagonal diamonds
indicates the changes in oxygen fugacity in the aluminosilicate crystals and glasses. The effect of carbon species in the structural changes of silicate melts at 14 GPa will shed light on understanding the formation of silicate melts and the presence of low velocity zone in upper mantle-transition zone boundaries. Finally, an abstract for a publication in Korean journal,
publication lists, and presentation lists in domestic and international conferences are presented in the appendix.
1.2. Estimation of carbon budget in the mantle
Total carbon contents in the Earth is estimated as 2.1–9.3 × 1024 g (Dasgupta and Hirschmann, 2010; Kelemen and Manning, 2015). While the carbon content in the Earth’s surface including biosphere, hydrosphere, atmosphere, and soil is 4.1 × 10¹⁹ g of C (~0.004%–0.002% of total carbon contents), the amounts of carbon in the crust and mantle are 1.4 × 10²² g and
~0.8–12.5 × 10²³ g, respectively (Dasgupta and Hirschmann, 2010). As the carbon content in the crust and the mantle is 3–5 orders of magnitude higher than that in the Earth’s surface, the sudden increase in the influx of carbon from the mantle and/or crust would cause severe changes in the
environments of the Earth’s surface. Due to its important, previous studies have focused on both the carbon budget and flux between the Earth’s surface and the mantle (e.g., Dasgupta and Hirschmann, 2010; Foley and Fischer, 2017; Kelemen and Manning, 2015; Ruhl and Kürschner, 2011;
Sverjensky et al., 2014).
The total carbon contents in the Earth is estimated from the carbon
6
contents in the meteorites and the partitioning coefficient of carbon between liquid metals and silicate liquids (Dasgupta, 2013). The average carbon contents in the carbonaceous meteorites are 2.7–4.4 wt% (Anders and Grevesse, 1989; Lodders, 2003; Lodders, 2010). The carbon contents in the bulk Earth is estimated as ~730 ppm (Marty, 2012; McDonough, 2003). The relatively low concentration of carbon in the current Earth compared with meteorites is due to the volatility of CO2 and CH4, which can be eliminated from the Earth during the early stage of Earth formation. It is estimated that the core contains 0.4–3.5 wt% of carbon, and the mantle contains ~14.5–50 ppm of carbon (Dasgupta, 2013; McDonough, 2003). Based on the fraction of carbon in each reservoir, the estimated total carbon contents in the Earth are
~3.5 × 1027 g of carbon in the core (with ~0.4 wt% of carbon in the core), and
~0.4 × 1026 g of carbon in the mantle (with ~50 ppm of carbon in the mantle) (Dasgupta, 2013). Together with this rough estimation of total carbon contents in the Earth, experimental data have collected the carbon contents from basaltic rocks and volcanic gases.
Estimation of carbon budget in the mantle needs an assumption that partitioning of CO2 is similar to that of noble gas, such as He, as the CO2
content in the magma varies with the partial melting of the crystalline silicate mantle, crystal fractionation in the magma, and the degassing of gaseous CO2 from the magma (Dasgupta and Hirschmann, 2010; Kelemen and Manning, 2015). In addition, as the degassing process of CO2 is very efficient, the detection of CO2 contents from the fluid inclusion in the basaltic rocks may only indicates the lower bound of CO2 concentration in the primary magma (Wallace, 2005). The carbon budget in the mantle is estimated from basalts and simultaneously emitted fluids (e.g., Bureau et
7
al., 1998; Dixon, 1997), mantle-derived fluids such as trapped fluid inclusions in basalts (e.g., Aubaud et al., 2006), hydrothermal vent fluids (e.g., Sansone et al., 1998), and the ratio of CO2 over incompatible elements, such as CO2/He (e.g., Zhang and Zindler, 1993), CO2/Nb (Cartigny et al., 2008; Saal et al., 2002), CO2/Ar (Cartigny et al., 2001; Tingle and Aines, 1988), and CO2/Cl (Saal et al., 2002).
The distribution of carbon in the mantle, estimated from the mid- ocean-ridge-basalts (MORB) source, is heterogeneous. For example, the measured CO2 from depleted MORB mantle is 20–30 ppm (Hirschmann and Dasgupta, 2009; Saal et al., 2002) while that from enriched MORB is 300–
1300 ppm (Aubaud et al., 2006; Bureau et al., 1998; Dixon, 1997). Therefore, the estimation of total carbon contents in the mantle varies with the mixing ratio of the depleted and enriched mantle sources. Assuming that the carbon content in the whole mantle are only from depleted mantle, the estimated carbon content is 0.8–1.2 × 10²³ g (Dasgupta and Hirschmann, 2010). The carbon budget can be estimated as much as 2.7–12.5 × 10²³ g when the carbon content in the whole mantle is composed of 40% from depleted mantle and 60% from the enriched mantle (Dasgupta and Hirschmann, 2010).
1.3. Carbon flux between Earth’s surface and the mantle
Carbon flux between Earth’s surface and the mantle is estimated from ingassing and outgassing of carbon species in the ocean, subduction zone, oceanic island, mid-ocean ridge, and continental lift zone (e.g., Aubaud et al., 2006; Bureau et al., 1998; Dasgupta, 2018; Dasgupta and Hirschmann, 2010; Foley and Fischer, 2017; Kagoshima et al., 2015; Lee et al., 2016; Luth,
8
2003; Saal et al., 2002). Ingassing of carbon from the Earth’s surface to the mantle includes the precipitation of CaCO3 as sediments in the ocean and the transport of carbon through the oceanic crust, overlying sediments, and underlying mantle lithosphere. The estimated amount of CaCO3
precipitated in the ocean is 2.0 × 10¹⁴ g of C/y and that of carbon species transported through the subduction zone is 4.0–6.6 × 10¹³ g of C/y
(Dasgupta and Hirschmann, 2010; Kelemen and Manning, 2015). The major carbon species carried by the oceanic crust and mantle lithosphere are CO2
in fluid inclusions and/or carbonate minerals within the crust, those carried by the overlying sediments are reduced carbon species, such as remains of organic carbons and precipitated carbonate minerals, and those carried by the mantle lithosphere beneath the oceanic crust are ophicarbonates which are composed of serpentine and carbonates (e.g., Dasgupta and
Hirschmann, 2010; Duncan and Dasgupta, 2017; Kagoshima et al., 2015;
Kelemen and Manning, 2015).
Outgassing process occurs when the carbon-bearing oceanic crust goes into the mantle and the crust experiences the increase of temperature and pressure, resulting in the decomposition of carbonate minerals into CO2
and the formation of silicate melts by the interaction between silicate
minerals and volatile species, such as CO2 and H2O (Grotzinger et al., 2010).
Those gaseous CO2 formed between the mantle wedge and the subducting slab can move along the boundary between mantle wedge and the
subducting slab, incorporate into the mantle wedge, and return to the atmosphere by volcanic eruption while remnant carbonate minerals and reduced carbon species can be transported into the deeper mantle by the subducting slab. The estimated fraction of recycling CO2 to the atmosphere
9
through subduction zone varies from ~1% to 80% depending on the flux models (Bebout, 1995; Dasgupta and Hirschmann, 2010; Gorman et al., 2006;
Johnston et al., 2011; Kelemen and Manning, 2015).
Outgassing of carbon from the mantle to the Earth’s surface, such as atmosphere and hydrosphere, is estimated as 2.2–12.7 × 10¹³ g of C/y, including outgassing from oceanic island basalts (0.8–4.2 × 10¹³ g of C/y), mid-ocean ridge basalts (0.12–3.0 × 10¹³ g of C/y), arc volcanoes (1.8–3.7 × 10¹³ g of C/y), and diffusion outgassing through oceanic crust (0.4–1.2 × 10¹³ g of C/y) (Dasgupta and Hirschmann, 2010; Kelemen and Manning, 2015).
Recent studies on the continental rift zones suggested that the carbon outgassing through the continental rift zone is also significant, as much as 1.9 × 10¹³ g of C/y (Foley and Fischer, 2017; Lee et al., 2016).
The outgassing process inevitably involves changes in speciation of carbon into silicate melts with varying pressure and temperature and the carbon carrying capacity of silicate melts is important to estimate the amount of carbon emitted through the subduction zone. For example, the solubility of CO2 and carbonates into silicate melts is much higher than that of graphite or hydrocarbon species at the same pressure and temperature conditions (e.g., Keppler et al., 2003; Mysen et al., 2011; Shcheka et al., 2006).
Therefore, neutral to reduced carbon species are much easier to remain in the subducting crust and be carried into the deep mantle while CO2 and carbonates are moved with silicate melts formed above the subducting crust (e.g., Duncan and Dasgupta, 2017).
While the current carbon flux between Earth’s surface and the mantle is balanced to move more carbon species into the mantle, sudden changes in volcanic activities can change the carbon flux between two carbon
10
reservoirs. For example, the carbon isotope data of long-change n-alkanes from waxes of land plants showed the sudden decrease of δ13C value (~ -8.5
‰) within 10,000–20,000 years at the end of Triassic (Ruhl et al., 2011). The sudden changes of isotope value are thought to be related to the mass injection of CO2 from volcanic eruption in the Central Atlantic Magmatic Province (Ruhl et al., 2011), which erupted a volume of ~2-3 × 10⁶ km3 of basaltic magma (Balckburn et al., 2013). The estimated carbon contents emitted by the eruption is 8000–9000 Gt of carbon (Ruhl et al., 2011).
Together with the density of basaltic melts, the estimated fraction of carbon in the basaltic magma erupted in the Central Atlantic Magmatic Province is 0.13–0.2 wt%. While the fraction of dissolved CO2 carried by the basaltic magma is relatively low compared with carbon carrying capacity of basaltic melts (~ several wt% of carbon in basaltic melts) (Ni and Keppler, 2013 and references therein), this implies that the flux of total magma and the total eruption time is important for estimating the total carbon contents
outgassed by the volcanic eruption, resulting in the huge changes in carbon isotope values. Therefore, the flux of carbon species between Earth’s surface and the mantle should be considered as a crucial factor for controlling the distribution of carbon in the Earth’s surface and the mantle.
1.4. The speciation of carbon in silicate crystals and glasses at high pressure Previous pioneering researchers have reported the speciation of carbon in silicate crystals and glasses at high pressure using Raman spectroscopy (e.g., Duncan and Dasgupta, 2017; Morizet et al., 2009;
Mposkos and Kostopoulos, 2001; Mysen, 2013, 2017; Pawley et al., 1992;
Rosso and Bodnar, 1995; Sandler et al., 2003; Seitz et al., 1996), FT-IR
11
spectroscopy (e.g., Behrens et al., 2004; Brooker et al., 2001a, b; Fine and Stolper, 1985; Kadik et al., 2004; King and Holloway, 2002; Morizet et al., 2002; Mysen, 2018; Mysen et al., 1975; Pan et al., 1991; Stanley et al., 2012;
Stolper et al., 1987), 13C solid-state NMR (e.g., Brooker et al., 1999; Kohn et al., 1991; Morizet et al., 2002; Morizet et al., 2017; Papenguth et al., 1989; Sen et al., 2013; Xue et al., 2018), in-situ Brillouin scattering spectroscopy
(Murakami and Bass, 2011), and molecular dynamic simulations (Guillot and Sator, 2011; Moussallam et al., 2016; Sarda and Guillot, 2005;
Vuilleumier et al., 2015). The carbon species detected varies with the spectroscopy methods. For example, FT-IR spectroscopy provides
information on molecular CO2 and carbonate species which are detected at
~2349 cm-1 and 1415 cm-1, respectively (Brooker et al., 2001b; Ni and Keppler, 2013) and the degeneration of antisymmetric stretching vibration of carbonates induces a split of carbonate peaks in IR spectra, showing the distortion of carbonate with varying composition (Brooker et al., 2001b; Ni and Keppler, 2013). Raman spectroscopy, on the other hand, provides information on the CO2, carbonate species, CH4, and sp2 and sp3 bonding in graphite and diamonds at ~1337 cm-1, ~1100 cm-1, ~2916 cm-1, ~1360 cm-1 and 1560 cm-1, respectively (Ferrari, 2007; Ni and Keppler, 2013; Seitz et al., 1996). The CO2 in Raman spectroscopy showed Fermi resonance doublet, showing the symmetric bending of ν1 and 2ν2 of 12CO2 at ~1385 cm-1 and
~1285 cm-1, respectively (Rosso and Bodnar, 1995). The frequency difference of ν1 and 2ν2 of CO2 is used to measure the internal pressure of CO2 in fluid inclusion, giving the pressure and temperature condition of trapping of the fluid inclusion (Kim et al., 2016; Rosso and Bodnar, 1995; Seitz et al., 1996).
In addition, isotropic composition of CO2 and CH4 can be identified by the
12
peak position in Raman spectra: 13CO2 at ~1360 and 1260 cm-1, and 12CH4 at 2918 cm-1,13CH4 at 2916 cm-1, respectively (e.g., Dang-Nhu et al., 1979; Kim et al., 2016; Seitz et al., 1996). The changes of chemical bonding of neural carbon species from sp2 to sp3 bonding can also be identified by the Raman spectroscopy (Ferrari and Robertson, 2001; Hanfland et al., 1989; Knight and White, 1989; Kuzmany et al., 2004; Lopez-Rios et al., 1996; Reich and
Thomsen, 2004; Vidano and Fischbach, 1978). 13C NMR spectroscopy is only active for 13C nuclide in the sample and provides the quantitative
information around carbon species. The peaks for CO2, carbonate species, CH4, and sp2 and sp3 bonding in graphite and diamonds are ~125 ppm,
~160–171 ppm, ~-5 ppm, ~110–140 ppm and ~65 ppm, respectively (Kohn et al., 1991; Mysen, 2013; Ni and Keppler, 2013). The area of the NMR peaks are directly proportional to the abundance of carbon species in the bulk sample (Sandler et al., 2003) and the detection limit is estimated as several tens of ppm of 13C carbon species (Kim et al., 2016).
Carbon in the mantle mostly exists as accessory mineral phases, such as graphite, diamond, and carbonate minerals, between grain boundaries of silicate minerals (Hazen and Schiffries, 2013; Keppler et al., 2003; Luth, 2003;
Shcheka et al., 2006). Once those mineral phases of carbon dissolved into silicate melts, the speciation of carbon varies strongly with the composition of silicate melts and oxygen fugacity of the mantle and is independent on the total carbon content (Behrens and Gaillard, 2006; Ni and Keppler, 2013).
In oxidized condition, the dominant carbon species in highly polymerized silicate melts, such as rhyolitic melts, is molecular CO2 weakly bound to the bridging oxygen (BO) in the silicate network, while only dissolved
carbonate species is observed in depolymerized melts, such as basaltic and
13
peridotitic melts (e.g., Blank and Brooker, 1994; Brooker et al., 1999; Morizet et al., 2002). In reduced condition, the dominant carbon species in silicate melts are CO and CH4 (Mysen, 2013; Mysen and Richet, 2005b), and the solubility of those reduced carbon species generally 2–4 times lower than that of oxidized species (Mysen et al., 2011).
The speciation of carbon in silicate melts is closely related to the solubility of carbon in the silicate melts. The formation of carbonates is favored in mafic and ultramafic melts (depolymerized melts) as the following equation:
CO2 + O2- = CO32-
where O2- stands for a non-bridging oxygen (NBO) atom in the silicate network and the solubility of carbon in silicate melts generally increases with increasing the fraction of NBO (Mysen, 2012; Ni and Keppler, 2013).
The relative abundance of CO2/CO32- in silicate melts does not depend significantly on pressure up to 0.8 GPa (Behrens and Gaillard, 2006; Blank and Brooker, 1994; Nowak et al., 2003), and the CO2/CO32- ratio decreases with the further increase of pressure up to 3.5 GPa (e.g., Brooker et al., 1999). However, the experimental data on the speciation of carbon above 4 GPa has not been reported due to the difficulties in synthesizing sample above 4 GPa and the lack of suitable probe to detect carbon species at high pressure. Recent molecular dynamic simulations on the carbon species in rhyolitic melts at high pressure up to 15 GPa predicted that the fraction of CO2/(CO2+CO32-) in rhyolitic melt at 15 GPa would be ~27% (Guillot and Sator, 2011).
The carbonate species in silicate melts can be divided into three: free carbonates charge-balancing with network modifying cations, such as Na+,
14
non-bridging carbonates which are linked to one non-bridging oxygen, such as Si(CO32-)···Na+ or Al(CO32-)···Na+, and bridging carbonates which are linked to two non-bridging oxygen, such as Al(CO3)Si (e.g., Brooker et al., 2001b; Kohn et al., 1991; Tossell, 1995). While the dissolved CO2 seems similar to that of non-bridging carbonates, the dissolved CO2 has weak interaction with BO and non-bridging carbonates are linked to NBO.
Sometimes, the dissolved CO2 which has very short CO2–BO distance (< 1.4 Å) is classified as CO32- although it is linked to BO (e.g., Figure 21 in Ni and Keppler, 2013). Therefore, it is important to check the atomic structures of carbon species that the authors used. Identification of non-bridging carbonates from bridging carbonates has not been made in experimental spectroscopies and carbonates are usually categorized into free carbonates and bridging carbonates in 13C NMR (Brooker et al., 2001b; Brooker et al., 1999; Xue et al., 2018).
1.5. Pressure-induced structural changes of silicate melts at high pressure The structure of silicate melts is very different from that of crystalline silicate. For example, crystalline anorthite (CaAl2Si2O8) is a fully
polymerized silicate, which has NBO/T ratio of 0, while CaAl2Si2O8 glasses quenched from melt at 1 atm shows significant amount of NBO by forming
[5]Al in the system (Stebbins and Xu, 1997). The structural changes of silicate melts from crystalline silicate result in the increase of heat capacity and the entropy of the system, the decrease of viscosity of melts, and changes of diffusion of network modifying cations in the melts (Stebbins, 1995;
Stebbins, 2016; Stebbins and Xu, 1997).
The structure of silicate melts varies with composition, temperature,
15
and pressure. Among those variables, the pressure-induced structural changes of silicate melts are important to understand non-linear changes of viscosity and diffusivity of silicate melts at high pressure (Brearley and Montana, 1989; Poe et al., 1997; Suzuki, 2018; White and Montana, 1990). As glasses preserve the structure of silicate melts near the glass transition temperature (Tg), the structure of silicate melts at high pressure is often deduced from that of silicate glasses quenched from melts at high pressure (Mysen and Richet, 2005a; Stebbins, 2016). The densification of silicate melts at high pressure follows three steps. First, the topological rearrangement of glass network, such as changes in T-O-T angle (where T = Si and/or Al) and changes in T-O bond lengths, occurs below the threshold pressure at which the highly coordinated framework units are formed (Lee, 2010 and
references therein). The increase of topological disorder is observed as the broadening of peak widths in silicate glasses at high pressure without the changes in coordination number (e.g., Allwardt et al., 2004; Kim et al., 2018;
Lee et al., 2004). Above the threshold pressure, the formation of highly coordinated network-former and a decrease of NBO fraction control the overall densification of silicate melts, and the network modifying cations often changes its role from network modifier to charge balancing cations around highly coordinated cations (Allwardt et al., 2004; Lee, 2010; Lee et al., 2004; Lee et al., 2003; Wolf and McMillan, 1995; Xue et al., 1991). At higher pressure, oxygens with three Si frameworks are formed by the twisting of silicate network rings (Lee, 2010; Lee et al., 2008b) and this induces the further densification of silicate melts at high pressure.
The structural changes of silicate melts at high pressure are related to the transport properties of silicate melts at high pressure. The diffusivity of
16
Si4+ and O2- increases with increasing the fraction of highly coordinated Al and Si in the silicate glasses (Poe et al., 1997), implying the lowering of viscosity due to the easier O2- transfer between NBO at high pressure. The fraction of NBO with the same SiO2 ratio at high pressure varies with the mixing of cations, implying the cation-composition dependence on the viscosity (Lee et al., 2008a). Therefore, understanding the structural changes of silicate melts at high pressure would give insights into the macroscopic properties of magma, such as viscosity and diffusivity (e.g., Allwardt et al., 2003; Bottinga and Richet, 1995; Lee, 2011; Poe et al., 1997; Suzuki et al., 2011; Xue et al., 1991).
1.6. Introduction to multi-anvil press
This part includes the study published in Journal of Mineralogical Society of Korea in 2018. A figure shown here is from Kim and Lee (2018).
The high-pressure experimental apparatuses are divided into two categories: apparatuses generating hydrostatic pressure and those generating shear stress. Among those high-pressure apparatuses,
apparatuses generating hydrostatic pressure include piston cylinder, multi- anvil press, and diamond anvil cell (DAC). Multi-anvil press can generate the hydrostatic pressure ranging from 5 to 25 GPa using tungsten carbide cubes and the temperature up to 2300 °C, which can generate the pressure and temperature conditions of upper mantle to the boundary of transition zone and lower mantle. Whereas the sample volume of piston cylinder is 125–180 mm3 and that of DAC is ~0.001 mm3, respectively, the volume of the sample chamber in multi-anvil press varies 2–140 mm3, which is useful to synthesize the ex-situ high pressure samples. The high-pressure glass
17
samples were synthesized by fusing the sample at the target pressure and then by quenching the sample with a turn off of electric power. The initial quench rate was estimated to > 500 °C/s. The high-pressure glass samples were synthesized by fusing the sample at the target pressure and then by quenching the sample with a turn off of electric power. The initial quench rate was estimated to > 500 °C/s.
Multi-anvil press was invented by Bridgman in 1940s with tetrahedral shape press which can generate the pressure up to 10 GPa (Liebermann, 2011). Cubic anvil press was invented in 1950s for reducing the experimental failure on pressuring the tetrahedral cell (Liebermann, 2011) and then multi-anvil press was developed in 1970s by Kawai (Kawai and Endo, 1970), applying six-split first-stage anvils and eight-split second- stage anvils into a uniaxial press and generating hydrostatic pressure on samples through octahedral pressure-medium and the twelve-wings of pyrophyllite sticks (Figure 1.1). As the junction of pyrophyllites does affect the stability of high-pressure experiments (Schwarz, 2010), Walker module was developed in 1990 by simplifying pressure-medium structure, adding pyrophyllite wing to the octahedral structure (Walker et al., 1990).
The pressure limit that can be generated by a multi-anvil press is determined by the limit of shear deformation of the materials of the second- stage anvil. The most common materials used for second-stage anvil is tungsten carbide (WC) which can generate the pressure up to 30 GPa (Leinenweber et al., 2012; Yoneda et al., 1984). Sintered diamonds are recently used as second-stage anvil materials because they can generate the pressure up to 120 GPa (Ito, 2007; Shatskiy et al., 2011; Yamazaki et al., 2018). Recent study reported the addition of two third-stage anvils with a 1-
18
Figure 1.1. (a) A photograph of 1100-ton multi-anvil press equipped in author’s laboratory, Seoul National University. (b) A plan view of the multi-anvil press (open square with label “b”) in Fig. 1.1a. A containment ring, three first-stage anvils (1st anvil) and assembled second-stage anvils (2nd anvil) are shown. (c) A section drawing of the multi-anvil press. Grey, violet, yellow, and green areas represent pistons, a containment ring, first-stage anvils, and second-stage anvils, respectively. The black arrows show the direction of force applied to pistons. (d) Photographs of an octahedral pressure medium and a second-stage anvil. OEL is referred to the octahedral edge lengths the pressure medium and TEL is an abbreviation of truncated edge lengths of the second-stage anvil. (e) A schematic diagram of an assembly set with straight heater (open square with label “e”) in Fig. 1.1c. This figure is from Kim and Lee (2018).
19
mm diameter in a uniaxial direction parallel to the outermost uniaxial press and achieved around 100 GPa of pressure by this method (Kunimoto et al., 2008).
As the multi-anvil press generate the pressure by using oil inside of the press, the calibration of oil pressure and the actual pressure generated on the sample is necessary. This oil load-pressure calibration process includes pressure loss between the containment ring and the first-stage anvils, pressure loss between first-stage anvils and second-stage anvils, press loss due to the frictional force between extruded pressure medium and the second anvils (Ito, 2007; Leinenweber et al., 2012). The load-pressure calibration varies with the truncated edge lengths of second-stage anvils (TEL) over the octahedral edge lengths of pressure medium (OEL), the volume of sample chamber, and the differences due to the temperature. The pressure-load calibration curve for 1100-ton multi-anvil press in Seoul National University is reported in Kim and Lee (2018).