저작자표시-비영리-변경금지 2.0 대한민국 이용자는 아래의 조건을 따르는 경우에 한하여 자유롭게
l 이 저작물을 복제, 배포, 전송, 전시, 공연 및 방송할 수 있습니다. 다음과 같은 조건을 따라야 합니다:
l 귀하는, 이 저작물의 재이용이나 배포의 경우, 이 저작물에 적용된 이용허락조건 을 명확하게 나타내어야 합니다.
l 저작권자로부터 별도의 허가를 받으면 이러한 조건들은 적용되지 않습니다.
저작권법에 따른 이용자의 권리는 위의 내용에 의하여 영향을 받지 않습니다. 이것은 이용허락규약(Legal Code)을 이해하기 쉽게 요약한 것입니다.
Disclaimer
저작자표시. 귀하는 원저작자를 표시하여야 합니다.
비영리. 귀하는 이 저작물을 영리 목적으로 이용할 수 없습니다.
변경금지. 귀하는 이 저작물을 개작, 변형 또는 가공할 수 없습니다.
재료공학 박사학위논문
Computational study of hydrogen evolution reaction on defective two-
dimensional transition metal dichalcogenides
이차원 전이금속 칼코겐 화합물의 음이온 공공 자리에서의 수소 발생 반응에 대한 계산 연구
2017년 8월
서울대학교 대학원
공과대학 재료공학부
이 주 희
Abstract
Computational study of hydrogen evolution reaction on defective two-dimensional transition metal dichalcogenides
Joohee Lee Materials Sciences and Engineering The Graduate School Seoul National University
Hydrogen is a strong contender for a next-generation clean energy source that may replace the current fossil fuels. However, the low-cost and clean production of hydrogen source is a critical issue. In this regard, the hydrogen production by splitting water, the abundant resource on earth, may resolve many of these problems, particularly if it is driven by the solar energy. To split water using solar energy or electricity, catalysts are necessary to reduce the large overpotential during the hydrogen and oxygen evolution. For several decades, Pt is known to be the best catalyst for hydrogen evolution reaction in water splitting, but the material is very expensive and so might not be suitable for large scale applications. As such, numerous studies searched for alternative catalysts that have potential to replace Pt. Especially, transition metal dichalcogenides (TMDs) are receiving much attention as a new class of two-dimensional catalysts for hydrogen evolution reaction (HER). Despite extensive efforts to find highly efficient
catalytic TMD systems, strong candidates to replace Pt have not been suggested yet. In TMD catalysts such as MoS2, edges are believed to be the active sites, but their limited density is a problem. Recently, it was found that the basal plane of MoS2 can also be active for HER by introducing sulfur vacancies in addition to strain.1 Herein, we try to identify the mechanism of HER on sulfur vacancy sites by means of kinetic Monte Carlo simulation using the energetics of first-principles calculations. We find that HER at sulfur vacancy site of MoS2 are dominated by the Volmer-Heyrovsky mechanism, and the vacancy site can be electrically charged, thereby lowering the energy barrier of rate- limiting Heyrovsky step. In addition, when a tensile strain is applied to MoS2, it leads to reaction paths with lower energy barriers in more negatively charged states. We also try to find new defective TMD catalyst for HER by means of computational screening based on the density functional theory. We explore the HER efficiencies of basal planes and anion vacancy sites for various TMD materials by using the hydrogen binding free energy as the descriptor for the HER efficiency.
We find hydrogen binding energy is varied by the concentration of vacancy and discover good TMD candidates which are expected to show high HER performance in proper vacancy concentrations. We suggest ZrSe2 and ZrTe2 for low vacancy concentration, and MoSe2, MoTe2, WSe2, ReTe2, MoS2 and ReSe2 when intermediate or high concentration of vacancy is accessible. We expect that these materials could compete with Pt as HER catalyst even without strain engineering.
formation energies and the electronic structures of anion vacancies strongly affect the hydrogen adsorption energy.
Keywords: first-principles calculation, kinetic Monte Carlo, hydrogen evolution reaction (HER), transition metal dichalcogenides (TMDs), anion vacancy site, mechanism, kinetics, screening
Student Number: 2013-30184
Contents
Abstract ……… 1
Contents ……… 4
List of tables and figures ……… 7
1. Introduction ……… 11
1.1 Hydrogen as a next-generation clean energy source ………… 11
1.2 2D materials as novel catalysts for water splitting ……… 12
1.3 TMD materials for HER ……… 14
1.4 Anion vacancy as a HER active site in TMDs ……… 15
1.5 Goal of the dissertation ……… 17
2. Theoretical backgrounds and methods ……… 18
2.1 Density functional theory (DFT) ……… 1 8 2.1.1 Hohenberg and Kohn theorem ……… 1 8 2.1.2 Kohn-Sham equation ……… 19
2.1.3 Exchange-correlation energy ……… 20
2.2 Gibbs free energy ……… 22
2.2.1 Gibbs free energy of intermediates of HER on VS in MoS2 ……… 22
3
.Mechanism of HER on
VSin MoS
2……… 23
3.1 Introduction: Mechanisms of HER ……… 23 3.1.1. HER on VS in MoS2………
3.2 Theoretical approaches for HER on VS……… 26
3.2.1. Multiscale simulation ……… 26
3.2.2 HER; a stepwise chemical reaction ……… 26
3.2.3 Transition state theory ……… 28
3.2.4 Possible intermediate states of sulfur vacancy in the MoS2 during HER ……… 30 3.2.5 Definition of relative energies of intermediate states …… 31
3.2.6 Reaction energy and kinetic barrier ……… 33
3.2.7 State transition diagrams of intermediate and transition states ……… 35
3.2.8 Algorithm of KMC ……… 39
3.2.7.1 Rate of event 3.2.7.1.1 Reaction barrier 3.2.7.1.2 Pre-exponential factors of rates 3.3 Result and discussion ……… 48
3.3.1 State change over time and turnover frequency ……… 48
3.3.2 Reaction mechanism ……… 51
3.3.3 Bias dependence ……… 53
3.3.4 Simple model ……… 58
3.3.5 Strain effect ……… 59
3.4 Summary: Mechanisms of HER ……… 65
4. Screening active anion vacancy sites of various TMDs for HER ……… 66
4.1 Introduction: Screening HER catalyst ……… 66
4.2 Computational screening of stable TMDs for HER ………… 69
4.2.1 Computational detail ……… 69
4.2.2 Screening for HER on 40 stable TMD phases ………… 69
4.2.3 Anion vacancy formation ……… 73
4.2.4 Hydrogen adsorption free energy ……… 7 5 4.2.5 Hydrogen adsorption on TMD basal plane ……… 76
4.2.6 Hydrogen coverage on vacancies of high concentration … 77 4.2.6.1 Equilibrium coverage model 4.2.6.2 dependence of hydrogen adsorption energy on 4.2.7 Establishing volcano curve ……… 80
4.3 Result and discussion ……… 83
4.3.1 Candidate basal planes of TMD ……… 83
4.3.2 Anion vacancy in TMDs ……… 83
4.3.2.1 Anion vacancy formation energies in TMDs 4.3.2.2 Electronic structures of TMDs with anion vacancy 4.3.3 Hydrogen adsorption on anion vacancy site in TMD …… 88
4.3.3.1 Distribution of hydrogen adsorption energies on basal planes and anion vacancy sites 4.3.3.2 Candidate TMDs with anion vacancy as an active site 4.3.3.3 Classification of candidate TMDs with anion vacancy 4.3.3.4 Key physical quantities that affect hydrogen adsorption energy 4.4 Conclusion: Screening HER catalyst ……… 102
5. Conclusion ……… 104
Bibliography ……… 106
국문 초록 ……… 115
List of tables and figures
Table 3.1 All calculation data. Kim (2016)2 ……… 34 Table 3.2 All calculation data when 2.7 % of compressive strain is
applied. Kim (2016)2 ………
6 0
Table 3.3 All calculation data when 2.7 % of tensile strain is applied.
Kim (2016)2 ……… 61
Table 4.1 Stable phase, band gap, hydrogen adsorption free energy on basal plane, ΔGH (basal), vacancy formation energy, , hydrogen adsorption energy on vacancy site of the system with low vacancy concentration, ΔGH (H/V), and high vacancy concentration, ΔGH
( 4 H / 4 V )
……… 90 Figure 3.1Terminology for stepwise chemical reaction like HER … 29 Figure 3.2 (a) State transition diagrams of intermediate and transition states of Volmer step (b) Minimum adsorption energy and reaction barrier of the Volmer step ……… 37 Figure 3.3 (a) State transition diagrams of intermediate and transition states of Heyrovsky step (b) Minimum reaction barrier of the
H e y r o v s k y s t e p
… … … 3 8 Figure 3.4 Flow chart of our KMC simulation ……… 41 Figure 3.5 Schematic model for the proof for overall reaction rate including fast charging event. ……… 44
Figure 3.6 Schematic event table weighted by rate and the example of a Heyrovsky step and the relevant energy barriers ……… 47 Figure 3.7 State change over time. Green data indicates [H-VS], and purple data indicates a number of H2evolution, respectively ……… 50 Figure 3.8(a) Reaction paths and their proportions. (b) Most dominant reaction path. (c) Second dominant reaction path ………… 52 Figure 3.9 Population of each state ……… 55 Figure 3.10 Polarization curves from our KMC simulation, and from
the experiment1. ………
5 6
Figure 3.11 (a) Tafel plot resolved by the mechanism (b) Three representative dominant mechanisms depending on the external bias.
……… 57 Figure 3.12 Three different dominant mechanisms depending on the applied strain on the system ……… 62 Figure 3.13 Tafel plots of systems with tensile and compressive strain and without strain ……… 63 Figure 3.14 Polarization curves of systems with tensile and c o m p r e s s i v e s t r a i n a n d w i t h o u t s t r a i n
… … … 6 4 Figure 4.1 Classification of TMD materials. (a) The most stable phases from calculations (b) Searching space of structures to find the most stable phases. H phase is the MoS2 type which has octahedral coordination. T phase is the CdI2 type which has trigonal prismatic
coordination. T¢ and T² phases are distorted T phases, WTe2 type, and ReSe2 type, respectively. ……… 72 Figure 4.2 Present GGA calculation data vs reference data with BEEF functional.3 we included data only which the phase and the adsorption site are considered to be the same between two datasets. The d i f f e r e n c e s a r e n o t l a r g e r t h a n 0 . 5 e V .
… … … 7 6
Figure 4.3 Modeling of supercells for examining dependence of hydrogen adsorption energy on . Using 2×2 supercell with the most stable vacancy, we expand 2×2 or √3×√3 to simulate = , and
= ……… 78
Figure 4.4Dependence of hydrogen adsorption energy on . It shows generally linear dependence. ……… 79 Figure 4.5 Present GGA calculation data vs reference data. Reference data of BEEF functional are from C. Tsai et al., Nano Lett. 14, 1381
(2014)4……… 81
Figure 4.6 Volcano plots of expected HER exchange current as a function of hydrogen adsorption energy for basal planes of TMDs.
Shaded region is the range of DGHPt - 0.1 eV < DGH< DGHPt + 0.1 eV.
……… 82 Figure 4.7 Regression result of anion vacancy formation energies in terms of some bulk parameters like ionic interaction energy, band gap, chalcogen p valence level and expected HOMO level. The R2 score of the regression is 0.72. ……… 85
Figure 4.8 Schematic electronic structures of anion vacancy systems classified by a group of the metal atom. Dark color on the bottom part indicates the occupied density of states, and light color on the top part indicates the unoccupied density of states. ……… 87 Figure 4.9 Distributions of hydrogen adsorption energies on (a) basal planes of TMDs, (b) anion vacancy sites in systems with low vacancy concentrations and (c) high vacancy concentrations, respectively. Blue points indicate metallic phases and red points are for semiconducting phases. Distributions are obtained from Gauss sums of the points when sigma is set to be 0.1 eV. ……… 93 Figure 4.10 Candidate TMDs for HER. Volcano plots for anion vacancy sites of TMDs when the vacancy concentrations are (a) 3.125 % a n d ( b ) 1 2 . 5 % , r e s p e c t i v e l y .
… … … 9 5
Figure 4.11 Candidate TMDs for HER. The trend of hydrogen adsorption energy as a function of the vacancy concentration.
Candidate type I is relevant to the high vacancy concentrations, type II indicates the group of materials which might be optimized by controlling the vacancy concentrations, and type III is relevant to the l o w v a c a n c y c o n c e n t r a t i o n s .
… … … 9 8
Figure 4.12 Regression result of hydrogen adsorption free energies on anion vacancy sites in terms of vacancy formation energy, LUMO level, and HOMO level. An R2 score of the regression is 0.86. …… 101
Chapter 1. Introduction
1.1 Hydrogen as a next-generation clean energy source
Hydrogen is a strong contender for a next-generation clean energy source that may replace the current fossil fuels. There are several issues, however, ranging from the hydrogen production and storage to the efficiency of hydrogen fuel cells, which hinders a large-scale hydrogen industry.5 In particular, the low-cost and clean production of hydrogen source is a critical issue. Currently, fossil fuels are still the main resource for the production of hydrogen due to their low costs and applicability for many fossil fuel-based machines, but the fossil fuels are limited resources and possess the problem of CO2 and pollutants emission.5 On the other hand, the hydrogen production by splitting water, the abundant resource on earth, may resolve many of these problems, particularly if it is driven by the solar energy. Therefore, a study on the water splitting is crucial and especially finding efficient catalysts for the oxygen evolution reaction (OER) and the hydrogen evolution reaction (HER) has great importance for the development of solar water splitting systems for the commercial production of the hydrogen fuel to replace the current fossil fuels.
1.2 2D materials as novel catalysts for water splitting
To split water using solar energy or electricity, catalysts are necessary to reduce the large overpotential during the hydrogen and oxygen evolution. For several decades, Pt is known to be the best catalyst for hydrogen evolution reaction in water splitting, but the material is very expensive and so might not be suitable for large scale applications. As such, numerous studies searched for alternative catalysts that have potential to replace Pt.6–8 Recently, it has shown that not only the structures and compositions of the catalyst but also the dimensionality of the material is an important factor for the catalytic activity of the material. For an example, two-dimensional (2D) graphene has exceptional catalytic advantages that are absent in bulk graphite and it has been used as a novel catalyst to facilitate many chemical reactions including HER.9–11Also, methodologies developed by many endeavors to prepare 2D graphene has led the discovery of various other 2D materials,12–21 which is advantageous for catalysis due to following reasons:
- High specific surface area: high density of surface active sites - Increased hopping of electrons from the electrode to 2D
catalyst surface
- Possibility to characterize the active sites on TEM or STM:
good ground to combine theoretical research - Possibility of chemical and structural modification
In addition, many conditions can affect their properties in 2D materials.
There are size effect, layer thickness effect, edge and defect effect, curvature effect, and dopant and functional group effect. Especially, electronic density of states can be strongly enhanced at the edges. In addition, defects such as vacancies and dislocations can induce additional electronic states and also affect the catalytic efficiency.17
1.3 TMD materials for HER
Among various 2D materials, transition metal dichalcogenides (TMDs)
— whose generalized formula is MX2, where M is a transition metal and Xis a chalcogen (S, Se or Te) —, most notably MoS2, are receiving much attention as a catalyst for HER to replace platinum because of several advantages such as earth abundance and stability in the acidic media which is the HER condition.1–4,22–54 Especially in their monolayer form, electronic structure is changed22 and also the catalytic efficiency increases much than their bulk counterpart as the catalytic active sites might be largely exposed on the surface. Also, there is the possibility of chemical and structural modification. For example, edge or defective structure can modulate their properties. In addition, there are so many TMD compounds and their various properties ranging from metals to semiconductors that we have the possibility to choose the adequate TMDs for interested applications.
1.4 Anion vacancy as a HER active site in TMDs
The basal plane of many stable TMD phases including MoS2 is known to be inert. This will disfavor the dissociative adsorption of hydrogen on the TMD surface, which limits HER.55,56 Although edge sites of some TMD phases are catalytically active,4,41,57demands of active basal planes still exist to maximally expose the active sites. In this regard, basal planes of some meta-stable phases such as metallic T-MoS2 are suggested as an efficient catalytic site,3,35,55,58 but for the meta-stable phases, we cannot expect sufficient cyclic properties.
Recently, it was suggested that the basal plane of MoS2 can also be active in the presence of sulfur vacancies.1 It was found that the sulfur vacancies in MoS2 could increase the catalytic activity for HER by enhancing the hydrogen adsorption, and the activity increases even further when the adequate strain was applied on the defective MoS2. This motivated many researches that introduced vacancies, dopants, and other forms of defects in TMDs for using the material as HER catalysts.10,29,33,37,45,47,49,59,60 In particular, Voiry et al reported largely enhanced HER property for MoS2basal plane by improving electronic coupling with substrate, and attribute it to activities of naturally occurring sulfur vacancies.61
While preceding works demonstrated catalytic activity of MoS2 with anion vacancies, a question remains by which mechanism the anion vacancy site of TMDs gets active, how much the activity increases and how is the strain effect, or whether other TMDs may also exhibit the
enhanced HER activity when defects are introduced. Therefore, it would be timely to identify the mechanism and kinetics of HER on the anion vacancy site of TMDs, and extensively study anion vacancies in various TMDs and evaluate them as HER active sites.
1.5 Goal of the dissertation
In this dissertation, we present two different computational studies of hydrogen evolution reaction on defective two-dimensional transition metal dichalcogenides. First, we identify the mechanism of HER on vacancy site. We find out the time limiting step and investigate the overpotential dependence of the kinetics of this step. We also study the strain effect in relation to the mechanism. This study implies that engineering active sites on the inert basal planes of TMD materials would be possible by introducing anion vacancies. While the first work demonstrated catalytic activity of MoS2 with anion vacancies, a question remains whether other TMDs may also exhibit the enhanced HER activity when defects are introduced. Therefore, it would be meaningful to extensively study anion vacancies in various TMDs and evaluate them as HER active sites. So for the second topic, we explore the HER efficiencies of basal planes and anion vacancy sites of various TMD materials by calculating hydrogen binding energy. To screen proper materials, we searched all stable TMD structures. For the screening targets, we investigate how inert basal plane of TMDs turn to be active with the anion vacancies and suggest four different types of candidate materials that are predicted to have good HER efficiencies depending on the range of the vacancy concentration. In addition, we examine the correlation of some relevant physical quantities with hydrogen adsorption energy, the descriptor for HER activity, at the anion vacancy sites.
Chapter 2. Theoretical backgrounds and methods
2.1 Density functional theory (DFT)
2.1.1 Hohenberg and Kohn theorem
Most of the electronic structure calculations of materials have been based on the density functional theory (DFT) since Hohenberg and Kohn theorem62was introduced in 1964. Hohenberg and Kohn theorem implies that the ground state charge density r( )r is the necessary and sufficient information to calculate the electronic structure of materials and corresponding total energies. If the ground state density is known, Hamiltonian H, ground state wave function y , and ground state energy can be defined as a unique functional of r( )r .
The total energy E of the system is defined as ( ) ( ) ( ( ))
E =
ò
v r r r dr F+ r r , (2.1) where ( )v r is the external potential, r( )r is the charge density, and( ( ))
F r r is the universal functional. By the variational principle, we can prove that the total energy given by Eq.(2.1) is minimum when
( )r
r corresponds to the true charge density in the ground state.
To calculate the electronic structures and total energies of the material, the Hamiltonian must be defined. The Hamiltonian of electrons interacting in the ionic potential is shown in Eq.(2.2)
2
2 2
2 2
1 2 , 1
N N N
I
i i
i i I I i i j i j
Z e e
m R r r r
= = >
- Ñ - + Ñ
- -
å
hå
uur urå
ur ur , (2.2)where the first term is kinetic energy, the second term is ion-electron interaction, and the third term is electron-electron interaction. This Hamiltonian is accurate but it gives practically unsolvable Schrodinger equation because of the extremely high degree of freedom.
2.1.2 Kohn-Sham equation
In 1965, Kohn and Sham suggested the effective potential Veff to convert the many-body problem to simple one particle problem. The effective potential is composed of three parts as follow:
1) Ewald energy Vion e- : the ion-electron interaction
2) Hartree energy Ve e- : the electron-electron Coulomb interaction 3) Exchange-correlation energy Vxc.
eff( ) ion e e e xc
V r =V - +V- +V (2.3)
Using the Veff , the Schrodinger equation with complicated many-body interactions becomes simple one particle problem as the following equation:
2
2 ( ( )) ( ) ( ) 2 Veff r i r i i r
m r f e f
é- Ñ + ù =
ê ú
ë û
r r r
h (2.4)
Starting with a trial charge density and wave vectors from the atomic potentials of given system, the effective potential as a functional of the density is calculated and then Schrodinger equation is reduced to single particle equation. This equation is called Kohn-Sham equation. By
solving this equation, the Fermi energy and new charge density can be determined. This calculation process is repeated recursively until the difference between starting charge density and new charge density becomes smaller than given criteria.
2.1.3 Exchange-correlation energy
In the calculation of Kohn-Sham equation, determination of the effective potential is compulsory and very important. The exchange- correlation part of the effective potential Vxc is related to quantum mechanical interactions of the many-body system, and there are two different conventional approximations.
One is local density approximation (LDA) which is first introduced by Kohn and Sham.63 The LDA assumes that the exchange-correlation energy of the system as a functional of charge density function that it is identical to the corresponding value of the homogeneous electron gas which has same local density r everywhere.
[ ( )] ( ( )) ( )
LDA LDA
xc xc
E r r =
ò
e r r r r dr (2.5)where excLDA( ( ))r r is the exchange-correlation energy density of
the homogeneous system as mentioned above. The LDA might be adequate for systems that have smooth electron density such as the free electron like metal or the semiconductor. However, using it to the systems that have rapidly changing electron density such as the transition metal systems which have the localized electrons could
possibly include error. Usually, the bond strength or the lattice parameter is underestimated than experiments.
The LDA could imply large errors for the system where the electron density changes rapidly because LDA sees only local electron density to evaluate the exchange-correlation energy term. Therefore, generalized gradient approximation (GGA) which considers also the gradient of electron density of the local point is introduced later on by Perdew64 and Becke65. GGA is basically similar to LDA except that GGA contains the inhomogeneity of electron density considering the XC energy deviation from the uniform electron gas consumption.
[ ( )] ( ( ) ( ) ) ( )
GGA GGA
xc xc
E r r =
ò
e r r Ñr r r r dr (2.6)In 1996, Perdew-Burke-Ernzerhof improved formal GGA scheme (PW91) and it is called PBE.66 We use PBE for GGA functional in this dissertation. GGA improved the description of the physical properties like bond strength and the cohesive energy of solids compared to LDA.67
2.2 Gibbs free energy.
2.2.1 Gibbs free energy of intermediates of HER on VSin MoS2
To investigate the HER mechanism on the sulfur vacancy (VS) of
MoS2, we refer to Kim (2016)2 about the Gibbs free energy of intermediates which is defined as follows:
+
0
S tot S tot S
sol H
([ H- ] ) ([ H- ] ] ([ ] )
ZPE ( )
q q
e
G n V E n V E V
E nm n q m
D = -
+ + D + - - , (2.7)
where nH- indicates that nH atoms are adsorbed on the sulfur vacancy with the charge state of q. In Eq.(2.7), Etotand Esolare the total energy and the solvation energy, respectively, and ΔZPE is the difference in zero-point energy of the adsorbed H atoms between reactants and products (0.02~0.04 eV). The spurious electrostatic interactions between periodic image charges are neglected owing to high dielectric constant of water. and in Eq.(2.7) are chemical potentials of hydrogen ion and electron, respectively, and they are defined from reference of standard hydrogen electrode. Therefore, sum of and is equal to that is calculated as follows:
H2 Etot(H ) ZPE(H )2 2 H T S
m = + + D - D , (2.8)
where ΔH and ΔS correspond to the enthalpy and entropy changes per H2 molecule between T and 0 K at standard pressure, respectively, and are obtained from thermodynamic tables. In the present work, T is set
Chapter 3. Mechanism of HER on V
Sin MoS
23.1 Introduction: mechanisms of HER
3.1.1 HER on VSin MoS2
MoS2 has several advantages as a HER catalyst such as earth- abundance, stability in acidic media which is the HER condition, and high specific surface area that can give high density of active sites as a 2D material. However, the basal plane of MoS2 in the stable phase (H- MoS2) is known to be catalytically inert. In the seminal paper, Hinnemann et al44 proposed that Mo-edge facets of H-MoS2 would be active for HER because of small hydrogen binding energy (~0.1 eV) that is the value estimated as a descriptor for HER activity following the Sabatier’s principle.44 This theoretical result was confirmed by electrochemical experiments with STM observation.57 Several experiments afterward also confirm the role of edges,58 but when the edge sites are the only active sites, the density of active site is fairly limited. On the other hand, it was also found that metastable T-MoS2
phase shows high catalytic activity during HER. However, we cannot expect long-term stability with the meta-stable phases.
Recently, Li et al reported that the basal plane of H-MoS2 can be activated by introducing the sulfur vacancy (VS) and applying strain.1 By calculating the hydrogen binding energy, they identified the optimal condition of the applied strain depending on the respective vacancy
densities, which is partially confirmed by the accompanied electrochemical experiment. The applied bias to extract 10 mA/cm2of exchange current which is defined as overpotential was 170 mV which is larger than that of Pt, 59 mV, but smaller than 320 mV of edge sites of MoS2 and 187 mV for meta-stable phase of MoS2.1,58 This indicates that the defect-induced MoS2 basal plane is a promising catalytic system that may replace Pt.
The catalytic reaction mechanism at the semiconducting atomic-sized active sites such as VSwould be different from that at the pure metallic or semiconducting surfaces like Pt and basal planes of TMDs due to the localized defect states.68For the rational design of catalysts by inducing atomic-sized defects in material surfaces, it would be necessary to understand the catalytic reaction kinetics in atomistic detail. In this study, we perform multiscale simulation combining ab initio calculation data and kinetic Monte Carlo (KMC) simulation to investigate the HER mechanism on the sulfur defect of H-MoS2 basal plane. We refer to Kim (2016)2 for the Gibbs free energies along various reaction pathways from H+ to H2 by DFT calculations and the favorable reaction path is determined by KMC simulation considering reaction rates of all possible reaction steps. We find that H2 evolves with Volmer-Heyrovsky mechanism at VS site in MoS2and the rate- determining step is the Heyrovsky step. The Heyrovsky barrier is lower when the defect site is more negatively charged. So, when the tensile strain is applied, reaction path with lower energy barrier is more easily accessible with the more negatively charged state. The computed
turnover frequency and overpotential are in good agreement with the experimental value, and also the strain effect is well estimated.
3.2 Theoretical approaches for HER on V
S3.2.1 Multiscale simulation
In material sciences, multiscale simulation is used to calculate material properties that we can model on a certain level of size and time scale by using data from different levels. To study the mechanism of HER on VS
in MoS2, we have to model on the level of hydrogen evolving time scale, and also the atomic level calculation is needed to identify the dominating mechanism, For the time-evolving kinetics study, we use kinetic Monte Carlo (KMC) simulation by using atomic scale energetics based on first-principles calculation. We assume the vacancy is isolated and the interaction between sites are not considered so that we only have to trace one site by KMC.
3.2.2 HER; a stepwise chemical reaction
HER is a stepwise chemical reaction that consists of three elementary steps. Volmer, Heyrovsky, and Tafel.37,69–72 Those steps can be expressed as
(i) H++e-+ * H (Volmer)* (ii) H+ +e- + *H H (Heyrovsky)2 (iii) 2H* H2(g ) (Tafel)
In the above equation, * indicates the active site, H* and 2H* indicate one and two hydrogens adsorbed active sites, respectively. They take more than one elementary step to complete HER. An intermediate state
is the reaction product of each of these steps, except for the last one, which is called the final state. The activated complex at the saddle point of a potential energy surface is called the transition state. (See Figure 3.1)
The Volmer step can occur twice continuously on VS site of MoS2, as the possible number of hydrogen adsorption depends on the electronic structure of the active site. Therefore, [VS], [H-VS] and [2H-VS] states are possible, where [VS] is the hydrogen-free sulfur vacancy, [H-VS] is the one hydrogen adsorbed sulfur vacancy, and [2H-VS] is the two hydrogens adsorbed sulfur vacancy site. We refer the sequential adsorption steps as the first and second Volmer step, respectively.
The Heyrovsky steps are also distinguished as first and second Heyrovsky steps. In Volmer and Heyrovsky steps on MoS2, we consider electron charging and protonation events separately due to the semiconducting material property where various discrete charge states are accessible. So, Volmer and Heyrovsky steps refer the protonation step that delivers H+involving an arbitrary number of electrons.
For each possible chemical state, [VS], [H-VS] and [2H-VS], we can list up the possible next steps. On [VS], hydrogen can be adsorbed by first Volmer step. When the state is [H-VS], desorption of hydrogen is possible, and also the second Volmer step or HER by first Heyrovsky step is possible. When the state is [2H-VS], the second hydrogen can be desorbed, and HER by second Heyrovsky step or Tafel step is also possible.
A great diversity of sequences of these steps has to be considered to estimate overall turnover frequency (TOF) of HER. Instead, we conduct KMC simulation to find TOF that comes from the spontaneously selected sequences of the elementary steps for HER.
3.2.3 Transition state theory
Transition state theory (TST) explains the reaction rates of elementary chemical reactions. The theory assumes a special type of chemical equilibrium (quasi-equilibrium) between reactants and activated transition state complexes. TST is used primarily to understand qualitatively how chemical reactions take place. The basic ideas behind TST are as follows:73
A. Rates of reaction can be studied by examining activated complexes near the saddle point of a potential energy surface.
The details of how these complexes are formed are not important. The saddle point itself is called the transition state.
B. The activated complexes are in a special equilibrium (quasi- equilibrium) with the reactant molecules.
C. The activated complexes can convert into products, and kinetic theory can be used to calculate the rate of this conversion.
The reaction rate is expressed in TST like follows by combining Arrhenius equation and Rice’s idea about pre-exponential factor74–76:
‡ B
B
k Texp G
r h k T
æ-D ö
= ç ÷
è ø (3.1)
Figure 3.1Terminology for stepwise chemical reaction like HER
3.2.4 Possible intermediate states of sulfur vacancy in the MoS2during HER
HER dynamics on the sulfur vacancy of MoS2 is characterized by occasional transitions from one state to another. We also assume the vacancy is isolated that the interaction between sites is not considered.
So, for the isolated vacancy, we investigate the possible chemical state during HER. On sulfur vacancy site, one or two hydrogen atom can be adsorbed by first and second Volmer steps. When the sulfur vacancy site is not terminated by hydrogen ([VS]q), the defect states are comprised of an occupied singlet a1and unoccupied doubly degenerate e states in neutral. So the charge state qof this state can be from -4 to +2. When one hydrogen is adsorbed ([H-VS]q), a1 level is lowered under the valence band forming bonding state with hydrogen and an excess electron is occupied in e states and Jahn-Teller distortion occurs that estates split into e' and e" states, so the charge state qcan be from -3 to +1. When the second hydrogen is adsorbed on this site ([2H-VS]q), e' state is fully occupied and lowered below the valence band as bonding state, and charge state can be from -2 to 0.
We express the chemical state as [nH-VS]qand 15 states are possible.
0 4 2
1 3 1
2 2 0
n q
n q
n q
= ® - £ £ + ìï = ® - £ £ + íï = ® - £ £ î
(3.2)
Note that defect charge state can be changed when Fermi level is changed by external factors.
3.2.5 Definition of relative energies of intermediate states
To represent energetics of all possible reaction pathway, we first define relative energies of intermediate states with respect to the [VS]0. To compare the energies, we define the reaction energies from the system of [VS]0 to the system of [nH-VS]q as ΔG(n,q), where the number of elements and electrons of initial and final states are kept same.
(3.3) [ ] ∆ ( , )⎯⎯⎯ [ ] + 2
[ ] ∆ ( , )⎯⎯⎯ [ ] + [ ] ∆ ( , )⎯⎯⎯ [ ] [ ] + ∆ ( , )⎯⎯⎯⎯⎯ [ ] [ ] + 2 ∆ ( , )⎯⎯⎯⎯⎯ [ ] [ ] + 3 ∆ ( , )⎯⎯⎯⎯⎯ [ ] [ ] + 4 ∆ ( , )⎯⎯⎯⎯⎯ [ ]
[ ] + H ∆ ( , )⎯⎯⎯ [H- ] [ ] + H + ∆ ( , )⎯⎯⎯ [H- ] [ ] + H + 2 ∆ ( , )⎯⎯⎯⎯⎯ [H- ] − [ ] + H + 3 ∆ ( , )⎯⎯⎯⎯⎯ [H- ]2−
[ ] + H + 4 ∆ ( , )⎯⎯⎯⎯⎯ [H- ] −
[ ] + 2H + 2 ∆ ( , )⎯⎯⎯ [2H- ] [ ] + 2H + 3 ∆ ( , )⎯⎯⎯⎯⎯ [2H- ]1−
[ ] + 2H + 4 ∆ ( , )⎯⎯⎯⎯⎯ [2H- ]2−
where ΔG(0,0) = 0, and the general form of the relative energy is as follow:
(3.4) In standard hydrogen electrode (SHE) condition, a redox reaction occurs maintaining the concentration of both the reduced form and oxidized form to unity. The redox half-cell reaction is as below:
+
2H (aq) 2e+ - ®H (g)2
, (3.5)
where is the chemical potential of proton at SHE condition, and is the chemical potential of electron at SHE condition77–79.
So, relative energy of each state is expressed as follows in SHE condition:
(3.6) In general condition, the chemical potentials of electron and proton depend on pH and external biasη.
(3.7) So, the general form of relative energy ΔG(n,q) is represented as follows:
(3.8)
∆ ( , )= ([nH- ] ) − ([ ] ) − − ( − )
=1
2 ° −
= −4.44 eV
∆ ( , )= ([nH- ] ) − ([ ] ) − 2 ° +
= − 0.0591 H
= +
∆ ( , )=∆ ( , )+ 0.0591 + ( − )
We can determine all ∆ by DFT calculation. We refer to Kim (2016)2 on these data. They considered solvation effect, zero-point energy (ZPE) and entropy contribution.
3.2.6 Reaction energy and kinetic barrier
Reaction energy of each elementary step of HER is defined as , and we deal with electron charging separately, so the kinetic barrier is defined as follows by considering transition state of the step where the number of electrons in the system is kept same.
The kinetic barrier has no electrical bias dependence since the initial and transition states maintain the same number of electrons.
∆∆‡ = ∆∆‡ = ∆ (transition state) − ∆ (initial) = transition state − (initial)
We can calculate all ∆∆‡ by NEB or string method with constraint DFT with solvation effect.2
All data we used in this study for reaction energetics are obtained by Kim2, and the data are shown in Table 3.1.
∆∆ (intermediate step)
= ∆ (final) − ∆ (initial)
∆∆‡ (intermediate step)
= ∆ (transition state) − ∆ (initial)
Table3.1All calculation data.Kim (2016)2
3.2.7 State transition diagrams of intermediate and transition states Energies of intermediate states depend on the external bias as shown as in Table 3.1. These data can be plotted as state transition diagrams.
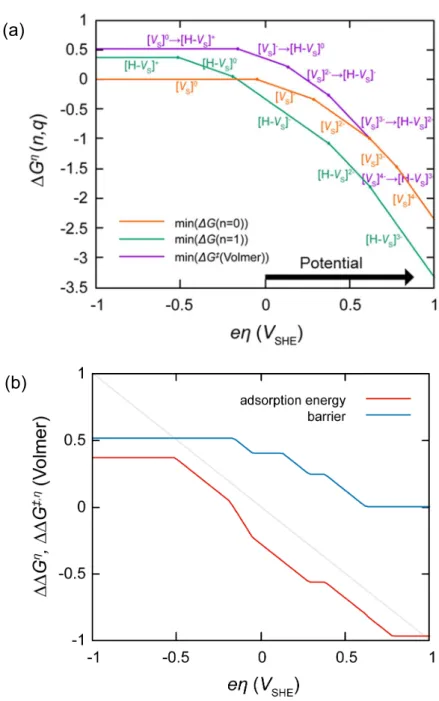
Electron transfer is much faster than the chemical reaction steps, so we assume that the initial state of any elementary step is always in the most stable charge state. State transition diagram for Volmer step is shown in Figure 3.2a. When a negative bias is applied to the cathode of water splitting cell, the defects in cathode catalyst are charged more negatively. The minimum energy of all charge state is shown in this figure, and the energy change from the minimum of ΔG(n=0) to the minimum of ΔG(n=1) is the adsorption energy. The adsorption energy decreases with increasing bias. The energy change from the minimum of ΔG(n=0) to the minimum energy of transition states of Volmer step Δ‡G(Volmer) is the energy barrier of the Volmer step. (See Figure 3.2b) The barrier of the Volmer step depend on the bias, it could be seen that the charge transfer coefficient, α which is defined usually in metallic catalysts corresponds to the positive value (α> 0).
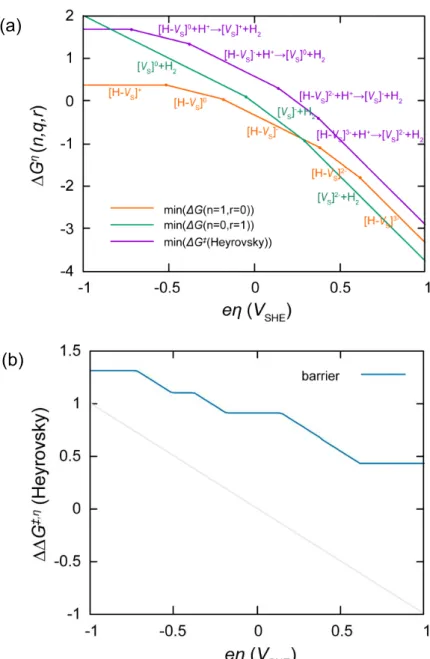
State transition diagram for Heyrovsky step is shown in Figure 3.3a.
When a negative bias is applied, the charge states of the defects in catalyst change more negatively. The minimum energy of all charge state is shown in this figure, and the energy change from the minimum of ΔG(n=1,r=0) to the minimum energy of transition states of Heyrovsky step Δ‡G(Heyrovsky) is the energy barrier of the Heyrovsky step. (See Figure 3.3b) The barrier of the Heyrovsky step depend on the external bias, so the charge transfer coefficient corresponds to the
positive value, α > 0. The Heyrovsky barrier is always higher than Volmer barrier, so the Heyrovsky step is the rate-limiting step. So, the turnover frequency can be approximated as
(3.9) H- ∙ ∑
Figure 3.2 (a) State transition diagrams of intermediate and transition states of Volmer step. (b) Minimum adsorption energy and reaction barrier of the Volmer step.
(a)
(b)
Figure 3.3 (a) State transition diagrams of intermediate and transition states of Heyrovsky step. (b) Minimum reaction barrier of the Heyrovsky step.
(a)
(b)
3.2.8 Algorithm of KMC
We follow the simple residence-time algorithm.80 The general algorithm is as follows:81
1. Set the time t= 0
2. We start from the initial state.
3. Form the list of all Nk possible transition rates at the site rki, from state k into a generic state i. States that do not communicate with k will have rki= 0.
4. Calculate the cumulative function Rki = ∑ for i = 1, ..., Nk. The total rate is Qk= Rk,Nk.
5. Get a uniform random number
6. Find the event to carry out i by finding the i for which
, < ≤ .
7. Carry out event i(update the current state k→i).
8. Get a new uniform random numberu' ∈ (0,1].
9. Update the time with t= t+ Δt, where Δt= ln (1/ ′). 10. Return to step 3.
In addition to the above algorithm, we record the history of the states to identify the reaction path. When a desorption event occurs, we reset the history, and when a hydrogen gas is evolved, pile up the recorded history and start another record. In this way, we can define the simplified paths to HER and gather the reaction paths that are essentially same.
Also, before the step 3, we set the charge state of the state to the most stable charge state, because the electronic stabilization is regarded as faster than chemical reactions.
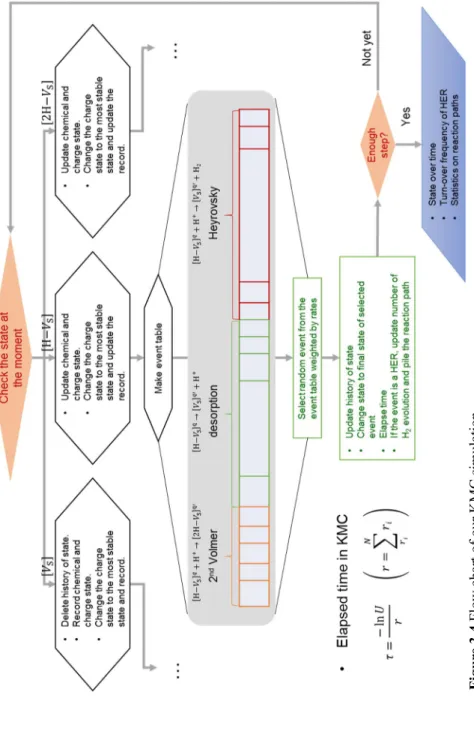
The workflow of our KMC simulation is shown in Figure 3.4. We start from the initial state of [VS]0. When the current state is [VS]0 at step 3, delete the history of the state and record chemical and charge state, change the charge state to the most stable state and record. When the chemical state is [H-VS] or [2H-VS], update chemical and charge state, change the charge state to the most stable state and update the record.
Then, make event table depending on the current state (step 3, 4). The state [VS] have the events of Volmer step, and the state [H-VS] have the events of desorption, second Volmer, and Heyrovsky HER. The state [2H-VS] can have the events of desorption, second Heyrovsky, and Tafel HER. We can select the next event randomly from the event table weighted by rates (step 5, 6). When an event is selected, update history of the state and current state to the final state of the selected event (step 7), then elapse time (step 8, 9), and if the event is a HER, update the number of H2 evolution and pile the reaction path. We return to step 3 and repeat until if enough HER occurs in KMC simulation to obtain macroscopic measures. When we stop the simulation, we obtain the results of state change over time, the turnover frequency of HER, statistics on reaction paths and so on.
Figure 3.4Flow chart of our KMC simulation
3.2.7.1 Rate of event
Since we can say that electron transfer is much faster than the chemical reaction steps, the most stable charge state is only considered for the initial state of each elementary step. On the other hand, we consider all possible charge states as the final state; we only have to consider corresponding energy barriers for evaluating reaction rate.
3.2.7.1.1 Reaction barrier
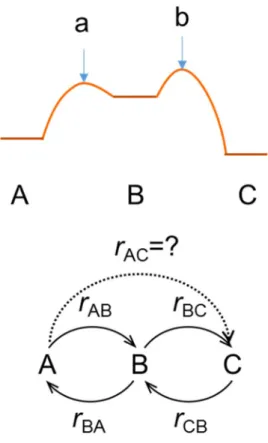
We consider tunneling effect on protonation step (Volmer, Heyrovsky) by scaling the barrier to 80 %82,83. Besides, for evaluating the rate of event where the electron is involved, we can assume that the charging event occurs first. In this case, the overall barrier of the step involves charging energy. (See Figure 3.5) This can be proved as follows.
We consider simple energy space like in Figure 3.5. The rate of reaction from A to B, rAB, is much faster than that of reaction from B to C, rBC. It can be seen in the difference of prefactors. The rate of A to B rAB is
a A
B
( )
exp E E
F k T
æ - ö
ç- ÷
è ø, and BC b B
B
( )
exp E E
r f
k T
æ - ö
= ç- ÷
è ø, where F >> f.
rBA and rCB are as the same way: BA B
B
( )
exp Ea E
r F
k T
æ - ö
= ç- ÷
è ø, and
b C
CB
B
( )
exp E E
r f
k T
æ - ö
= ç- ÷
è ø.
In the steady state, the Boltzmann distribution between two charge states is achieved. Flow from A to B and from B to A are same because
A AB B BA
P r =P r , (3.10)
where Pst is the population of state st. Then, when we define the rate of overall reaction from A to C, following equation comes by considering inflow in state C.
A AC B BC
P r =P r . (3.11)
We combined Eq.(3.10) and Eq.(3.11), and obtain:
a A b B
B B
B BC AB BC AC
A BA a B
B
A B
( ) ( )
exp exp
( )
exp
( )
exp b
E E E E
F f
k T k T
P r r r
r P r E E
F k T
E E
f k T
æ- - ö× æ- - ö
ç ÷ ç ÷
è ø è ø
= = =
æ- - ö
ç ÷
è ø
æ - ö
= ç- ÷
è ø
(3.12)
We can just consider the transition state of the rate-determining reaction, the chemical reaction, and electronic charging energy is just included in the barrier. (See Figure 3.6)
Figure 3.5 Schematic model for the proof for overall reaction rate including fast charging event.
3.2.7.1.2 Pre-exponential factors of rates
Adsorption rate can be defined by multiplying local sticking coefficient and a factor representing the activity of the adsorbing element84.
, (3.13)
here ( ) is the local sticking coefficient which is comprised of exponential term:
, (3.14)
where the factor accounts for a further reduction in the sticking probability. An accurate determination of the factor would require computationally highly demanding dynamical simulations of a statistically relevant number of trajectories for the impinging molecules, but here we can just approximate the factor as 1. is the ratio of effective area and the value is . Rate enhancement over T is slower than simple thermally activated reaction which follows Arrhenius equation.
Desorption rate can be determined by following formula.
(3.15) For the rate of Heyrovsky and Tafel step, we use the pre-exponential factor of , which is an approximation taken from the rate constant
( , )
= ( ) 2
( )
= ( ) exp −0.8 ∙ ∆∆‡
( , ) ( )
= exp ∆∆
of the dissociation of a hydrogen molecule,76 where kB is the Boltzmann constant, h is the Planck constant, T is thermodynamic temperature.
(3.16)
(3.17)
.( )
= ℎ exp −0.8 ∙ ∆∆‡ . ( )
= ℎ exp −∆∆‡
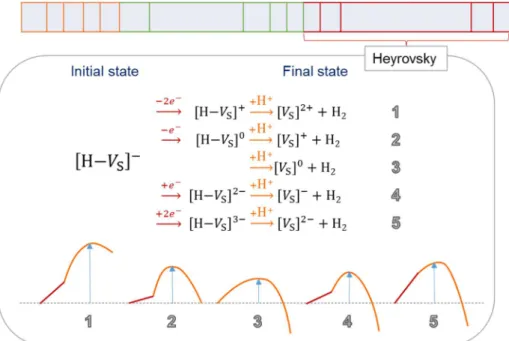
Figure 3.6 Schematic event table weighted by rate and the example of a Heyrovsky step and the relevant energy barriers.
3.3 Result and discussion
We obtain the results of state change over time, the turnover frequency of HER, statistics on reaction paths and so on.
3.3.1 State change over time and turnover frequency
We assume the vacancy is isolated and the interaction between sites are not considered so that we only have to trace one site. The state change of a vacancy site over time is shown in Figure 3.7. The green line in the Figure 3.7b indicates [H-VS] state and purple line in Figure 3.7a,b indicates a total number of H2 evolution at the site. Desorption or Heyrovsky step occurs on the time scale of seconds. In the case of desorption, the number of [H-VS] state, the green data change from 1 to 0 and the number of total H2evolution, the purple value doesn’t change, and in the case of Heyrovsky step, the total number of H2 evolution value also changes from n to n+1. Most of the time, the site is maintaining the state of [H-VS], and [2H-VS] state does not appear.
Turnover frequency (TOF) of H2 evolution on sulfur vacancy site of MoS2is calculated as 1.78 site-1sec-1, and the exchange current density from the TOF is calculated as 0.018 mA/cm2by the following equation.
2 TOF
j= eN´ , (3.18)
where elementary charge constant e= 1.6×10⁻¹⁹C, and Nis the density of sulfur vacancy that we set to the low density of sulfur vacancy, 1.38 %. By tracing the state of the site in time elapsing, we can predict
the population of each state in the sufficiently large catalytic surface with sulfur vacancies. The proportion of the population of each state in the zero biased pH = 0 case is as follows.
(3.19) P([ ] ) = 0.00
P( H- ) = 1.00 P( 2H- ) = 0.00
Figure 3.7 State change over time. Green data indicates [H-VS], and purple data indicates a number of H2evolution, respectively.
(a)
(b)
3.3.2 Reaction mechanism
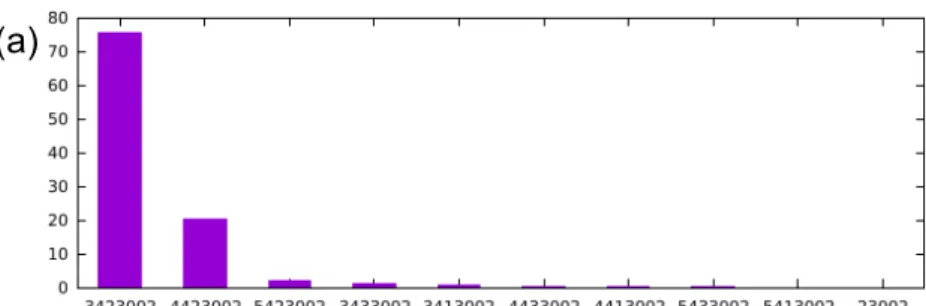
We trace the pathway through which each HER occurs. Figure 3.8a shows the proportion of each individual HER path. Figure 3.8b,c is the first and second dominant pathway. Both paths are the Volmer- Heyrovsky mechanism, and the rate limiting step is the Heyrovsky step.
Two paths differ by whether the charging event occurs before or after the Heyrovsky. The most dominant path is where the charging occurs after the Heyrovsky step due to its lower energy barrier that starts from [H-VS]1- state. The first dominant pathway of HER occurs through reduction-protonation-reduction-protonation, and in the second dominant pathway, HER occurs by the sequence of protonation- reduction-reduction-protonation.
Figure 3.8(a) Reaction paths and their proportions. (b) Most dominant reaction path.
(c) Second dominant reaction path.
(a)
(b)
(c)
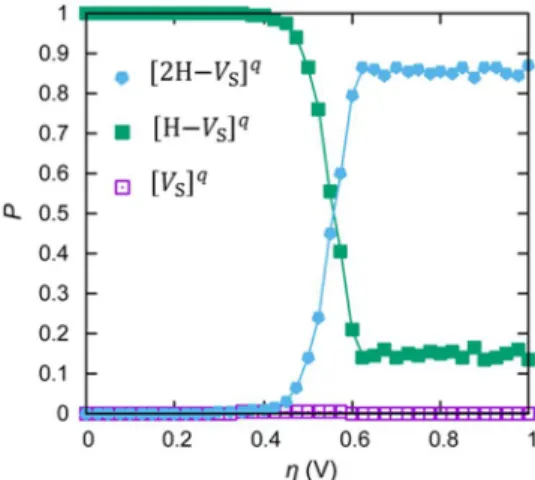
3.3.3 Bias dependence
TOF increases with increasing negative bias because barriers decrease.
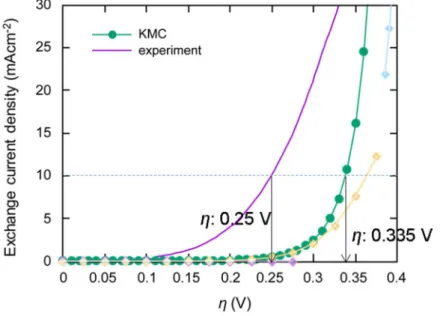
(See Figure 3.2) The population of each state also changes depending on the external bias as shown in Figure 3.9. Plot of exchange current density vs bias is called as polarization curve (Figure 3.10), and the barrier at 10 mA/cm2 of exchange current density is usually called as overpotential, and our calculated value is 0.335 V. At the point, energy barrier of Heyrovsky step is about 0.7 eV which is ~27 times of kBT at room temperature, even though we consider tunneling effect that effective barrier is somewhat lowered. In some past studies, simple approach that pays attention to the bias that makes all the thermodynamic reaction energy zero is used, and in that approach, they consider the bias as overpotential. However, from our observation on KMC results of HER on strained and unstrained VS, HER reaction energy is not important because the Heyrovsky step is the final step of the HER that there cannot be the reverse reaction, but the bias that makes Heyrovsky barrier to certain value (in our approach with tunneling, 0.7 eV) yields 10 mA/cm2 of exchange current density, which is generally considered to be the overpotential.
In a recent study,1 overpotential for the MoS2 system with 12.5 % vacancy is reported as 0.25 V, which is close to our simulation result.
We also provide Tafel plot in Figure 3.11 where the external bias with respect to the logarithm of exchange current density is shown. We can resolve Tafel plot by a mechanism to a mechanism. As negative bias increases, dominant mechanism changes and more negatively charged
states lead HER. Energies that is needed to charge the defects negatively decrease with increasing negative bias, and it leads to a reaction path with a lower energy barrier. If active site density increases, Tafel plot is shifted to the right with same Tafel slope.
Figure 3.9Population of each state.
Figure 3.10Polarization curves from our KMC simulation, and from the experiment.1
Figure 3.11 (a) Tafel plot resolved by the mechanism. (b) Three representative dominant mechanisms depending on the external bias.
(a) (b)
3.3.4 Simple model
On the basis of the observation on KMC results, we have developed a simple model for the TOF of HER on VS in MoS2. The resultant predictions are in good agreement with the KMC results. The ability to predict TOF of HER can be widely used to design a novel catalyst from the first-principles calculation results.
(3.20) Populations in the formula above are obtained by the rates as follows because populations at steady state keep the same inflow and outflow:
( )
( ) ( )
( )
ad des Hey Tafel
des Hey ad(2) ad des(2) Hey(2)
des(2) Hey(2) Tafel ad(2)
( ) (H- ) (2H- )
(H- ) ( ) (2H- )
(2H- ) (H- )
( ) (H- ) (2H- ) 1
S S S
S S S
S S
S S S
P V r P V r r P V r
P V r r r P V r P V r r
P V r r r P V r
P V P V P V
× = + + ×
+ + = × + +
+ + = ×
+ + =
(3.21)
The results from this simple model are consistent with macroscopic measures of KMC simulation.
TOF = ([ ]) ∙
min ∑ , ∑ +
min ∑ , ∑
+ H- ∙ ∑ + min ∑ , ∑
+ 2H- ∙ ∑
3.3.5 Strain effect
We also examine the strain effect by using the additional data set of DFT calculation about the system with applied strain. (Table 3.2, 3.3) When a tensile strain is applied to MoS2, negatively charging energies of defects decrease (green dotted circle in Figure 3.12), and it leads to reaction paths with lower energy barriers. Estimating quantitative enhancement of the activity by applying strain using a descriptor of hydrogen binding energy is failed in the previous study.1 (0.01 eV of hydrogen binding energy difference and 0.08 eV of the overpotential change differ by one order of magnitude.) Here, we could successively estimate the strain effect, quantitatively.
Table3.2All calculation datawhen 2.

![Figure 3.7 State change over time. Green data indicates [H-V S ], and purple data indicates a number of H 2 evolution, respectively.](https://thumb-ap.123doks.com/thumbv2/123dokinfo/11506582.0/56.773.145.572.204.575/figure-state-change-green-indicates-indicates-evolution-respectively.webp)