저작자표시-비영리-변경금지 2.0 대한민국 이용자는 아래의 조건을 따르는 경우에 한하여 자유롭게
l 이 저작물을 복제, 배포, 전송, 전시, 공연 및 방송할 수 있습니다. 다음과 같은 조건을 따라야 합니다:
l 귀하는, 이 저작물의 재이용이나 배포의 경우, 이 저작물에 적용된 이용허락조건 을 명확하게 나타내어야 합니다.
l 저작권자로부터 별도의 허가를 받으면 이러한 조건들은 적용되지 않습니다.
저작권법에 따른 이용자의 권리는 위의 내용에 의하여 영향을 받지 않습니다. 이것은 이용허락규약(Legal Code)을 이해하기 쉽게 요약한 것입니다.
Disclaimer
저작자표시. 귀하는 원저작자를 표시하여야 합니다.
비영리. 귀하는 이 저작물을 영리 목적으로 이용할 수 없습니다.
변경금지. 귀하는 이 저작물을 개작, 변형 또는 가공할 수 없습니다.
i
Abstract
Role of Innate Immunity in Chronic Rhinosinusitis with Nasal Polyp
Dong-Kyu Kim
Department of Otorhinolaryngology-Head and Neck Surgery The Graduate School Seoul National University
Background: Currently, growing evidences suggest that chronic rhinosinusitis with nasal polyp (CRSwNP) in Western patients is characterized by a Th2-based immune response with abundant eosinophilic infiltration, whereas studies of CRSwNP in Asian patients predominantly show non- eosinophilic inflammation with a mixed T cell immune response. However, the precise pathogenesis of CRSwNP in Asian still remains unclear.
Objective: I thought to investigate the role of innate immunity in CRSwNP in Asian population.
Methods: Tissues from uncinate process (UP) were obtained from controls and CRS without nasal polyps (CRSsNP). NP and UP were obtained from CRSwNP. The innate immune cells, interleukin (IL)-25, 33 were evaluated by immunohistochemistry (IHC), quantitative reverse transcription PCR (qRT-PCR), and enzyme-linked immunosorbent assay (ELISA). To confirm the function of IL-25, 33 during nasal polypogenesis, anti-IL-25, -33 neutralizing antibody was administered in a murine model of CRS with polypoid lesions.
Results: In the innate immune cell study, the MBP+ and CD11c+cells were continuously increased during progression of CRS and positively correlated with disease extent of CRS. The distribution of
ii
innate immune cells was remarkably different depending on the allergic status of CRSwNP patients.
In the IL-25 study, I found that epithelial cells and infiltrating mast cells of NPs showed prominent IL-25 expression, which positively correlated with the expression of multiple inflammatory markers, such as T-bet, RORC, GATA3. In addition, I observed the anti-polyp effect obtained by inhibiting IL- 25-responsive innate lymphoid cells and by suppressing the recruitment of effector cells, such as eosinophils and neutrophils in a murine model of CRS with polypoid lesions. In the IL-33 study, I revealed that CRSwNP is characterized by elevated expression of IL-33 in UP tissues, and these levels correlated with levels of Th1/Th17 cytokines, and multiple remodeling markers. In addition, the expression of IL-33 was upregulated and associated with inflammatory markers, which related with tissue remodeling and neutrophil recruitment, in non-eosinophilic NPs. Moreover, anti-IL-33 antibody showed an inhibitory effect on nasal polypogenesis by reducing the recruitment of neutrophils in a murine model of CRS with polypoid lesions.
Conclusions: The infiltration of MBP+ and CD11c+ innate immune cells show a significant association with phenotype of CRS and disease extent of CRSwNP, and allergic status also may influences cellular phenotype in Asian CRSwNP. Moreover, IL-25 and IL-33 expressions are elevated in patients with CRSwNP and the expression of those is associated with other inflammatory markers.
Neutralizing those (IL-25 and IL-33) reduce the nasal polypogenesis in an animal model. Therefore, I propose that the innate immunity is one of the crucial roles of nasal polypogenesis as well as a promising target for the treatment of nasal polyposis in the Asian population.
Key Words: Chronic rhinosinusitis, nasal polyp, innate immunity, interleukin-25, interleukin-33.
Student Number: 2012-31118
iii
Table of Contents
Page
Abstract in English---i
Table of Contents---iii
List of Tables---iv
List of Figures---v
Introduction---1
Materials and Methods---3
Results---10
Discussion---34
Conclusion---37
References---38
Abstract in Korean---43
Acknowledgement---45
iv
List of Tables
Page
Table 1. TaqMan® Gene Expression Assays for Quantitative real-time PCR………...……..9
Table 2. Patient characteristics and type of method in the innate immune cell study………..….12
Table 3. Relationship between immunohistochemistry analysis and clinical parameters……….15
Table 4. Patient characteristics and type of method in the IL-25 study……….20
Table 5. Patient characteristics and study methodology in the IL-33 study………..28
v
List of Figures
Figure 1. Immunohistochemical staining of innate immune cells………..………...………13
Figure 2. Distribution of innate immune cells in different type of CRS………14
Figure 3. Distribution of innate immune cells according to clinicohistologic parameter…………..…16
Figure 4. Expression of innate immune cells between subgroup analyses………17
Figure 5. Expression of IL-25 and IL-17RB in CRS……….21
Figure 6. Correlation between mRNA expression of IL-25 and inflammatory markers………...22
Figure 7. Anti-polyp effect of IL-25 neutralizing antibody in polyp animal models……….23
Figure 8. Changes in cytokine profiles, chemokine and adhesion molecule expression after anti-IL-25 therapy………24
Figure 9. Expression of IL-33 and ST2 in different types of CRS………29
Figure 10. Correlation between IL-33 expression and inflammatory markers in UP tissues from CRS patients………...30
Figure 11. Expression of IL-33 and correlation between IL-33 expression and inflammatory markers according to the endotype of CRSwNP……….31
vi
Figure 12. Anti-polyp effect of IL-33 neutralizing antibody in polyp animal models………...32
Figure 13. Anti-IL-33 therapy suppresses neutrophil infiltration and expression of neutrophil chemotactic cytokines and intercellular adhesion molecules in a murine model………..……33
1
Introduction
Chronic rhinosinusitis (CRS) affects is characterized by accumulation of inflammatory cells with marked tissue remodeling. This disease is currently divided into two categories: CRS without nasal polyps (CRSsNP) and CRS with nasal polyps (CRSwNP) (1). In the past several decades, numerous studies have been performed to investigate nasal polypogenesis in patients from Western countries.
These studies suggest that CRSwNP in Western countries is characterized by a Th2-based immune response with abundant eosinophilic infiltration, high levels of interleukin (IL-5), and low levels of transforming growth factor (TGF)-β1 (2-4). To date, several studies for CRS have been conducted in Asian. In contrast to the findings in Western patients, these studies described a Th1/Th2/Th17 mixed polarization and less eosinophilic inflammation (5-7). Thus, upstream mechanisms that incite the T cell immune response are crucial for understanding the pathogenesis of CRSwNP (8). However, these mechanisms are not thoroughly explored, especially in Asian patients. Recent some studies describe an important role of the innate immunity on the initiation of adaptive immunity and thus, it seems to play an important role in pathogenesis of CRS (9-11). Specifically, the type 2 innate lymphoid cells (ILC2s) which produce IL-5 and IL-13 are responded to exposure of innate cytokines, such as IL-25 and IL-33 (9).
IL-25 (also known as IL-17E), a member of the IL-17 cytokine family, were introduced to play an important function in promoting Th2-mediated inflammation (12). In animal study, intraperitoneal or intranasal administration of IL-25 protein resulted in the production of eosinophils, eotaxin, and Th2 cytokines in the bronchoalveolar lavage and lung tissue (13, 14). Conversely, blocking of IL-25 decreases the production of Th2 cytokines in an asthma animal model (14-16). In addition, IL-25 enhances thymic stromal lymphopoietin-induced Th2 immune response (17). Elevated expression of IL-25 and IL-25R also has been observed in patients with asthma and atopic dermatitis, possibly linking their functions with the exacerbation of allergic disorders (17). Moreover, one study described that an increased IL-25 expression associated with disease severity and increased serum eosinophils
2
levels in patients with CRS (18). Despite the relationship between IL-25 and Th2-dominant diseases, the specific role of IL-25 in CRSwNP remains unclear.
Meanwhile, IL-33 is a novel member of the IL-1 superfamily and is constitutively expressed at high levels in epithelial cells from human and mouse tissues during homeostasis (19). Biologically active full-length IL-33 can be released extracellularly by necrotic cells after tissue damage (20, 21). After release, IL-33 subsequently serves as an “alarmin” by triggering innate immunity by activating various types of immune cells, including mast cells, basophils, eosinophils, and ILC2s (22-25). In addition, endogenous IL-33 induces IL-5 and IL-13 by ILC2s for the initiation of Th2-mediated inflammatory responses in allergic diseases, such as asthma, allergic rhinitis, and atopic dermatitis (26-30). More recently, expression of IL-33 and its receptor ST2 was investigated in CRSwNP patients (31-33), and two of these studies reported elevated expression of ST2 (31, 32), implying that the IL-33/ST2 pathway may function in nasal polypogenesis. Despite these findings, the specific role of IL-33 in the pathophysiology of CRSwNP in Asian patients has not been fully understood.
Furthermore, these innate cytokines are produced by innate immune cells including, eosinophils, mast cells, macrophages, dendrite cells, basophils, and neutrophils (10-12). However, the relationship between innate immune cells and pathogenesis of CRS in Asian patients has not yet been investigated.
Therefore, in this study, I firstly evaluated the distribution of innate immune cells and investigated any differences of its clinical relevance according to the phenotype of CRS in Asian patients. Secondly, I investigated the expression of innate cytokines (IL-25 and IL-33) and the relationship between each innate cytokine and inflammatory markers in sinonasal tissues according to the different phenotypes of Asian patients with CRS. I also evaluated the therapeutic potential of IL-25 or IL-33 blockade on the nasal polypoid mucosa in a murine model.
3
Materials and Methods
Patients and tissue samples
This study was approved by the internal review board of Seoul National University Hospital, Boramae Medical Center (No. 06-2012-109). CRS was diagnosed according to the 2012 European position paper on rhinosinusitis and nasal polyps (EPOS) guidelines (1). Exclusion criteria were as follows: younger than 18 years of age, prior treatment with antibiotics, systemic or topical corticosteroids, or other immune-modulating drugs for 4 weeks before surgery, and unilateral rhinosinusitis, antrochoanal polyp, allergic fungal sinusitis, cystic fibrosis, or immotile ciliary disease.
In this study, I obtained in uncinate process (UP) tissue from control and CRS patients, including those with CRSsNP or CRSwNP. I also evaluated NP tissue in patients with CRSwNP. When NPs originated from UPs, only NPs were obtained during routine functional endoscopic sinus surgery in CRSwNP patients. Each sample obtained was divided into three parts: one third was fixed in 10%
formaldehyde and embedded in paraffin for histological analysis, another third was immediately frozen and stored at -80ºC for subsequent isolation of mRNA and proteins, and the final third of the tissue was submersed in 1 mL phosphate-buffered saline (PBS) supplemented with 0.05% Tween-20 (Sigma-Aldrich, St Louis, MO) and 1% PIC (Sigma-Aldrich) per 0.1g of tissue. This tissue was homogenized with a mechanical homogenizer at 1,000 rpm for 5 min on ice. After homogenization, the suspensions were centrifuged at 3,000 rpm for 10 min at 4ºC. The supernatants were separated and stored at -80ºC for further analysis of cytokines and other inflammatory mediators. The atopic status of study patients was evaluated using the ImmunoCAP® assay (Phadia, Uppsala, Sweden). NPs were classified into two groups: eosinophilic NP, which was defined as having an eosinophil count of more than 10% of the inflammatory cell population, and non-eosinophilic NP, which did not fulfill this criterion (34). Allergic CRSwNP were defined as NP tissues from patients who had allergic symptoms and positive results on the ImmunoCAP assay (35).
4
Immunohistochemistry (IHC)
IHC staining was performed with Polink-2, polymerized horseradish peroxidase (HRP), and broad DAB Detection System (Golden Bridge International Labs., WA, USA). To identify cellular sources of IL-25, sequential IHC was employed using polymer-HRP and alkaline phosphatase kits to detect mouse and rabbit primary antibodies for human tissue with permanent-Red and Emerald (Polink DS- MR-Hu C2 Kit; Golden Bridge International Labs). The primary antibodies were mouse anti-human eosinophil major basic protein (MBP) (1:50; Santa Cruz Biotech., California, USA), mouse anti- human CD11c (1:5; BD Pharmingen, California, USA), mouse anti-mast-cell tryptase (1:500; Abcam, Cambridge, UK), mouse anti-CD68 (1:250; Abcam), mouse anti-CD163 (1:25; Abcam), mouse anti- basophils (2D7) (1:10; Abcam), anti-human neutrophil elastase (HNE) (1:100; Abcam), rabbit anti- human IL-25 (1:500; Abcam), goat anti-human IL-17RB (1:50; R&D systems, MN, USA), rabbit anti- human IL-33 (1:250; Abcam), rabbit anti-human ST2 (1:100; Millipore, Darmstadt, Germany), and rabbit anti-human collagen (1:1000; Abcam). For quantification of positive collagen content, image analysis was performed using ImageJ software. The total collagen amount was calculated for each image after subtraction of background, and this value was expressed as a percentage of the total area.
Quantitative real-time PCR (qRT-PCR)
The qRT-PCR was performed with a LightCycler® 480 SYBR Green I Master (Roche, Mannheim, Germany). Total RNA was extracted from tissue samples using the TRI reagent (Invitrogen, Carlsbad, CA). One microgram total RNA was reverse transcribed to cDNA using the cDNA Synthesis Kit (amfiRivert Platinum cDNA Synthesis Master Mix, GenDEPOT). Primer sequences are as follows:
GAPDH, 5´-CATGGGTGTGAACCATGAGAA-3´ for the forward primer and 5´-
GGTCATGAGTCCTTCCACGAT-3´ for the reverse primer; T-bet, 5´-
GTCAATTCCTTGGGGGAGAT-3´ for the forward primer and 5´-TCATGCTGACTGCTCGAAAC- 3´ for the reverse primer; GATA3, 5´-ACCACAACC ACACTCTGGAGGA-3´ for the forward primer and 5´-TCGGTTTCTGGTCTGGATGCCT-3´ for the reverse primer; RORC, 5´-
5
GCTGTGATCTTGCCCAGAACC-3´ for the forward primer and 5´-
CTGCCCATCATTGCTGTTAATCC-3´ for the reverse primer; TGF-β1, 5´- TGAACCGGCCTTTCCTGCTTCTCATG-3´ for the forward primer and 5´- GCGGAAGTCAATGTACAGCTGCCGC-3´ for the reverse primer; TGF-β2, 5´-
TGGATGCGGCCTATTGCT TTA-3´ for the forward primer and 5´-
GCGGAAGTCAATGTACAGCTGCCGC-3´ for the reverse primer; TGF-β3, 5´-
GTGAGTGGCTGTTGAGAAGAGA-3´ for the forward primer and 5´-
GAGGATTAGAGGGTTGTGG-3´ for the reverse primer; and ECP, 5´-
TCGGAGTAGATTCCGGGTG-3´ for the forward primer and 5´-GAACCA
CAGGATACCGTGGAG-3´ for the reverse primer. In addition, primer for IL-25 and COL1A1 (#QT00037793) were purchased from Qiagen (Qiagen Korea Ltd., Seoul, Korea). TaqMan® Gene Expression Assay kits (Life Technologies Korea, Seoul, Korea) were also purchased and used for measuring mRNA levels from human and animal samples (Table 1). Pre-developed assay reagent kits containing primers and probes were purchased from Applied Biosystems (Foster City, CA).
Expression of GAPDH (Human; Hs02758991_g1 and Mouse; Mm99999915_g1) was used as an internal control for normalization. Cycling conditions were as follows: 95°C for 5 min followed by 60 cycles at 95°C for 15 sec, 60°C for 20 sec, and 72°C for 20 sec. To analyze the data, I used Sequence Detection Software version 1.9.1 (Applied Biosystems). Relative gene expression was calculated using the comparative 2-ΔΔCT method.
Enzyme-linked immunosorbent assay (ELISA)
Before ELISA, the protein concentrations for tissue extracts were determined using the Quick Start Bradford Protein Assay Kit (BIO-RAD, Seoul, Korea). Samples were thawed at room temperature and vortexed to ensure well-mixed sample. And then, tissue homogenates were assayed for IL-25, IL- 17RB, and IL-33 proteins by using commercially available ELISA kits (R&D systems) in accordance with the manufacturer’s instructions. The minimal detection limit for these kits is 62.5, 156, and
6
23.4pg/mL, respectively. All procedures followed the information of the manufacturer. Concentrations of IL-25, IL-17RB, and IL-33 were normalized to the concentration of total protein.
Murine model of allergic chronic rhinosinusitis with polypoid lesions
All animal experiments were approved by the IACUC of Boramae Medical Center (No.2013-0001) and were performed under strict governmental and international guidelines on animal experimentation.
The murine models of allergic CRS with polypoid lesions was induced according to the previously established protocol (36), which has been confirmed by multiple studies (37-39). Thirty-two female BALB/c mice (4 weeks of age, 20-25 g) were purchased from Koatech Laboratory Animals, Inc.
(Pyeongtaek, Korea). The mice were maintained under specific pathogen-free conditions with a 12/12-hour light/dark cycle. Briefly, mice in the experimental groups were systemically sensitized with 25 µg of ovalbumin (OVA; Sigma-Aldrich, St. Louis, MO, USA) dissolved in 300 µl of PBS in the presence of 2 mg of aluminum hydroxide gel as an adjuvant by intraperitoneal injection on days 0 and 5. One week after the second intraperitoneal injection, mice were challenged intranasally with 3%
OVA diluted in 40 µl of PBS daily for 1 week. Thereafter, continual local stimulation was maintained by the same procedure three times per week for 12 consecutive weeks. During the last eight consecutive weeks, 20 ng of Staphylococcal enterotoxin B (SEB) diluted in 20 mL of PBS was used as a challenge immediately after the administration of 3% OVA weekly. In the IL-25 study, mice were categorized into one control and three experimental groups: PBS-instilled (PBS, n=10), NP model group (POLYP, n=10), NP model group treated with anti-IL-25 (R&D systems, Minneapolis, MN;
POLYP+IL-25, n=8), and NP model group treated with dexamethasone (POLYP+steroid, n=8).
POLYP group, POLYP+αIL-25 group and POLYP+steroid group were weekly administered intraperitoneal isotype IgG (300 μg per a mouse), anti-IL-25 (300 μg per a mouse) and dexamethasone (1mg/kg) from day 49 through day 102 before OVA instillation, respectively. Mice in control (PBS) were not sensitized but weekly administered intraperitoneal isotype IgG (300 μg per a mouse) from day 49 through day 102 before OVA instillation. Mice were sacrificed on day 103. Mice
7
were sacrificed 24 hours after the last OVA challenge. In the IL-33 study, mice were categorized into one control and two experimental groups: PBS control group (n=10), SEB-induced nasal polyp model group (POLYP, n=12), and polyp model group treated with anti-IL-33 (R&D systems, Minneapolis, MN, USA; POLYP+αIL-33, n=10). The POLYP group and POLYP+αIL-33 group were administered isotype IgG (purified normal rabbit IgG; R&D Systems; 30 µg per mouse) and anti-IL-33 (R&D Systems; 30 µg per a mouse) intraperitoneally each week from 5 to 12 weeks before OVA and SEB administration, respectively. Mice in the control group (PBS) were not sensitized but were given intraperitoneal isotype IgG (30 µg per a mouse) weekly from day 49 through day 102 before OVA instillation. Mice were sacrificed 24 hours after the last OVA challenge.
Histopathological analysis of animal tissues
Twenty-four hours after the final OVA challenge, the heads of 5 mice from the PBS and POLYP+αIL-33 groups and those of 7 mice from the POLYP group were removed en bloc and then fixed in 4% paraformaldehyde for histopathology analysis. After exposing the nasal cavity from the heads of the other mice, the nasal mucosa was removed meticulously using a small curette and micro- forceps under the microscopic (n=5 for each group). For evaluation of nasal histopathology, nasal tissues were decalcified, embedded in paraffin, and sectioned coronally (4µm thickness) approximately 5 mm from the nasal vestibule. Samples were stained with the following stains to compare the characteristics between groups: hematoxylin and eosin (H&E) for polyp-like lesions, Sirius red for eosinophils, anti-neutrophilic antibody (1:50; Abcam) for neutrophils, Alcian blue for goblet cells, and Masson’s trichrome staining for collagen fibers in the subepithelial layer. Ten areas from nasal mucosal sections were chosen randomly for evaluation under high-power magnification (x400). Polyp-like lesions were defined as distinct mucosal elevations with eosinophilic infiltration and microcavity formation. The thickness of the subepithelial collagen was measure using an image analysis system (DP2-BSW software; Olympus, Tokyo, Japan). The mucosal thickness was measured as the distance between the apex of the epithelial cells and the upper border of the subepithelial glands
8
zone using an image analysis system. For the assessment of mucosal thickness, at least three measurements at random points with a minimum distance of 20 µm between the points were made in the appropriate area of each high power field (HPF), and the mean from four different HPFs was recorded for comparison.
Cytokines from nasal lavage fluid in murine model
After partial tracheal resection under deep anesthesia, a micropipette was inserted into the posterior choana through the tracheal opening in the direction of the upper airway. Each nasal cavity was gently perfused with 200μL PBS, and the fluid from the nostril was collected and centrifuged. Supernatants were stored at -80ºC. Levels of cytokines in the nasal lavage fluids were measured using ELISA kits purchased from BioLegend (San Diego, CA). The lower detection limits of these ELISA kits were 8pg/mL for IFN-γ, 0.5pg/mL for IL-4, 2.7pg/mL for IL-17A, and 2.3pg/mL for TGF-β1.
Statistical analysis
Statistical analyses were performed using IBM SPSS 21 (SPSS, Inc., Chicago, IL) and GraphPad Prism software 6.0 (GraphPad software Inc, La Jolla, CA). In this study, the Kruskal-Wallis test and the Mann-Whitney U-test with a 2-tailed test for unpaired comparisons were used. The Pearson correlation test was also used to determine variable relationships. If the data was not normally distributed, the Spearman correlation coefficient was utilized (*P<0.05, **P<0.010, and ***P<0.001).
9 Table 1. TaqMan® Gene Expression Assays.
Gene of Interest Sample Primer
IL-33 Human Hs00369211_m1
IL1RL1 (ST2) Human Hs00545033_M1
IL-4 Human Hs00174122_m1
IL-5 Human Hs01548712_g1
IL-13 Human Hs00174379_m1
IL-17A Human Hs00174383_m1
IL-22 Human Hs01574154_m1
IL-23p19 Human Hs00900828_g1
IFN-γ Human Hs00989291_m1
TNF-α Human Hs01113624_g1
CXCL1 Human Hs00236937_m1
CXCL2 Human Hs00601975_m1
MPO Human Hs00924296_m1
IL-4 Mouse Mm00445259_m1
IL-5 Mouse Mm00439646_m1
IL-17A Mouse Mm00439618_m1
IFN-γ Mouse Mm01168134_m1
ICAM 1 Mouse Mm00516023_m1
VCAM 1 Mouse Mm01320970_m1
CCL11 Mouse Mm00441238_m1
CCL24 Mouse Mm00444701_m1
CXCL1 Mouse Mm04207460_m1
CXCL2 Mouse Mm00436450_m1
10
Results
Role of Innate immune in Chronic Rhinosinusitis
1. Distribution of innate immune cell in different types of CRS
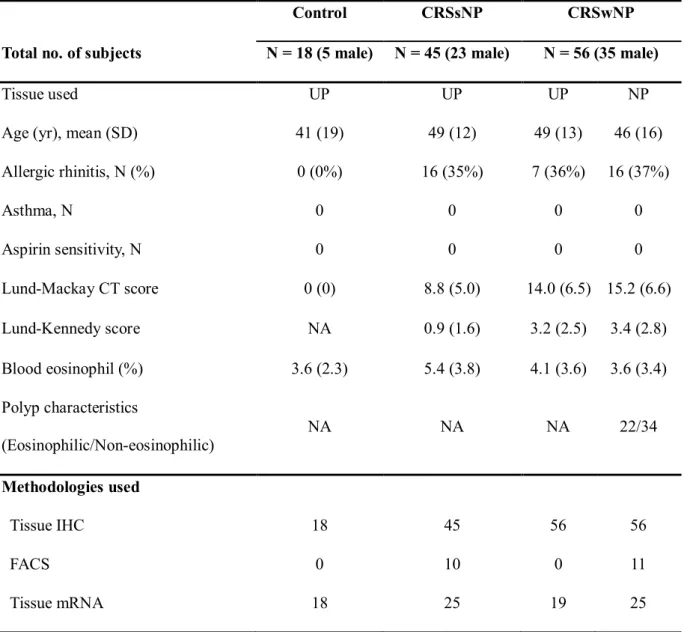
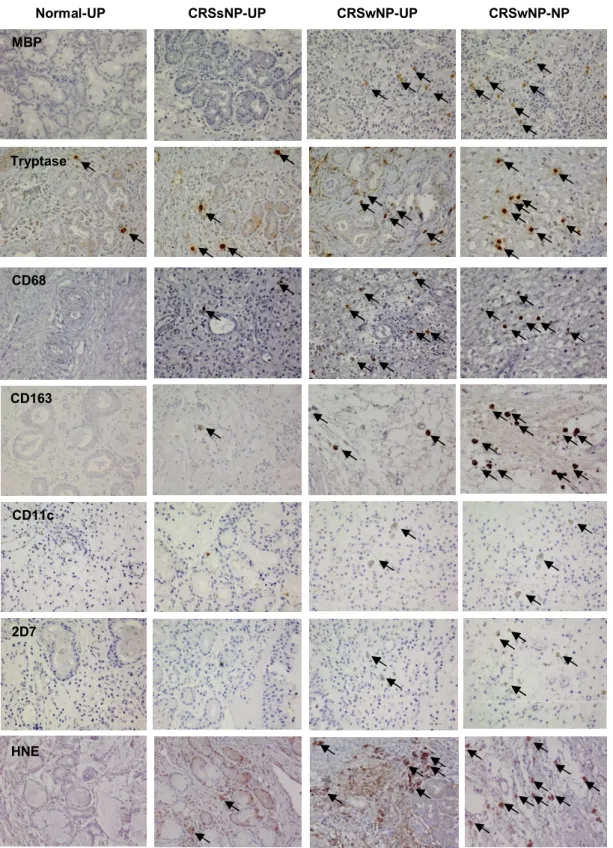
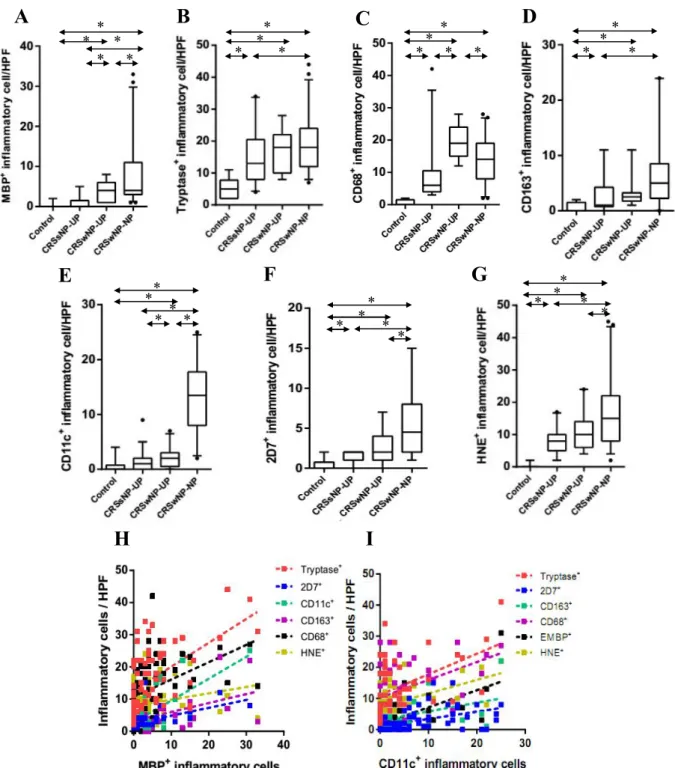
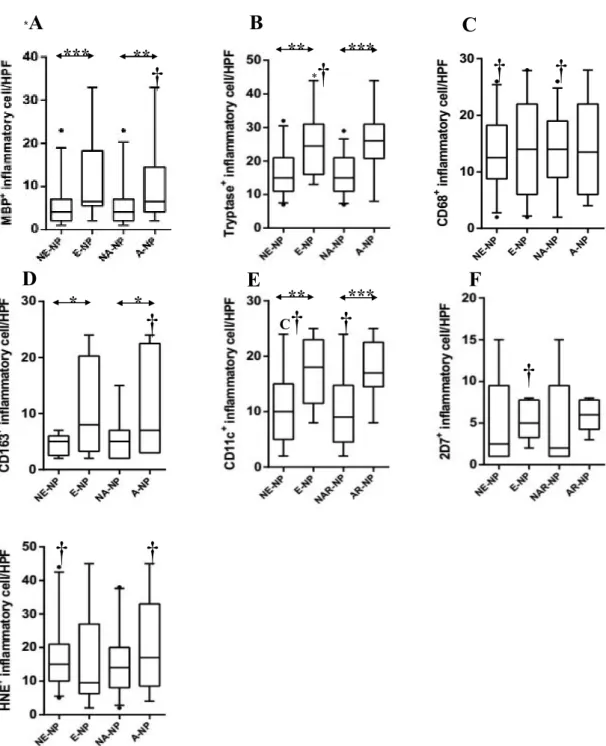
Patient characteristics and type of method in this study was presented in Table 2. To investigate the cellular distribution of innate immune cells, I performed IHC on UP tissues from controls, CRSsNP, and CRSwNP, and on NPs from CRSwNP (Fig 1). Figure 2 shows the comparison of cellular distribution in nasal mucosal tissues according to different types of CRS. UP tissues from those with CRSsNP showed a significantly greater number of tryptase+ cells, CD68+ cells, CD163+ cells, 2D7+ cells, and HNE+ cells compared to those from the controls. In contrast, UP tissues from patients with CRSwNP had increased numbers of MBP+ cells, CD68+ cells, and CD11c+ cells compared to the UP tissues from the CRSsNP group. Examination of the cell populations in UP and NP tissues from the CRSwNP group showed that greater numbers of MBP+ cells, CD11c+ cells, 2D7+ cells,and HNE+ cells were present in NP tissues, whereas the number of CD68+ cells were decreased in NP tissues. In addition, the MBP+ and CD11c+ cells were increased from UP of CRSsNP, to UP of CRSwNP, and to NP of CRSwNP (Fig 2A and 2E). On analyzing the relationship between the distribution of innate immune cells (Fig. 2H and 2I), I found that the number of MBP+ cells was strongly correlated with other immune cells (r=0.417***, MBP vs. CD68; r=0.618***, MBP vs. CD11c; r=0.543***, MBP vs.
tryptase; r=0.557**, MBP vs. 2D7; r=0.380*, MBP vs. CD163). In addition, the number of CD11c+ cells also showed strong correlation with several immune cells (r=0.618***, CD11c vs. MBP;
r=0.357*, CD11c vs. tryptase; r=0.490***, CD11c vs. 2D7; r=0.427**, CD11c vs. CD163).
2. Correlation of innate immune cells and clinical implications in CRSwNP
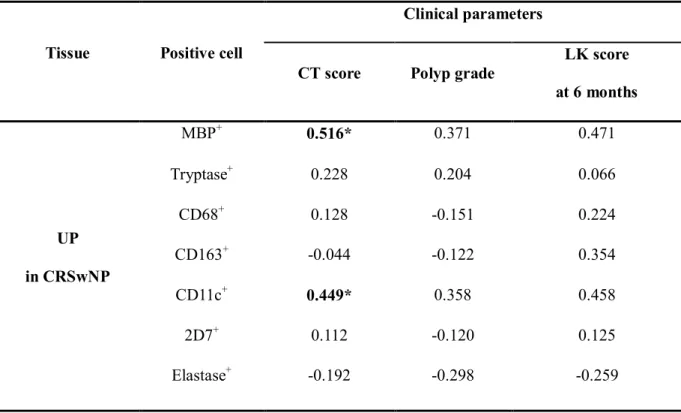
The relationships between innate immune cells and clinical parameters of CRSwNP are shown in Table 3. Interestingly, the disease extent of CRSwNP was positively correlated with the number of
11
MBP+ cells (r=0.516, P<.05) and CD11c+ cells (r=0.449, P<.05) in UPs from CRSwNP. Meanwhile, polyp grade and postoperative findings was not significantly correlated with all innate immune cells.
3. Cellular pattern of innate immune cells according to clinicohistologic parameters in CRSwNP
I evaluated the distribution patterns of innate immune cells in different types of CRSwNP. As illustrated in Figure 3, there was a significant higher count of MBP+, tryptase+, CD163+, and CD11c+ cells in eosinophilic NP compared with non-eosinophilic NP. Compared with non-allergic NP, the numbers of MBP+, tryptase+, CD163+, and CD11c+ cells were also significantly increased in allergic NP. Meanwhile, in non-eosinophilic NP, overall innate immune cells were decreased compared with eosinophilic or allergic NP. Furthermore, in comparison between UP from CRSwNP and NP from non-eosinophilic NP, the number of HNE+ cells and CD11c+ cells were significantly higher in NP tissues and UP tissues. However, I found that less number of CD68+ cells was present in NP tissues.
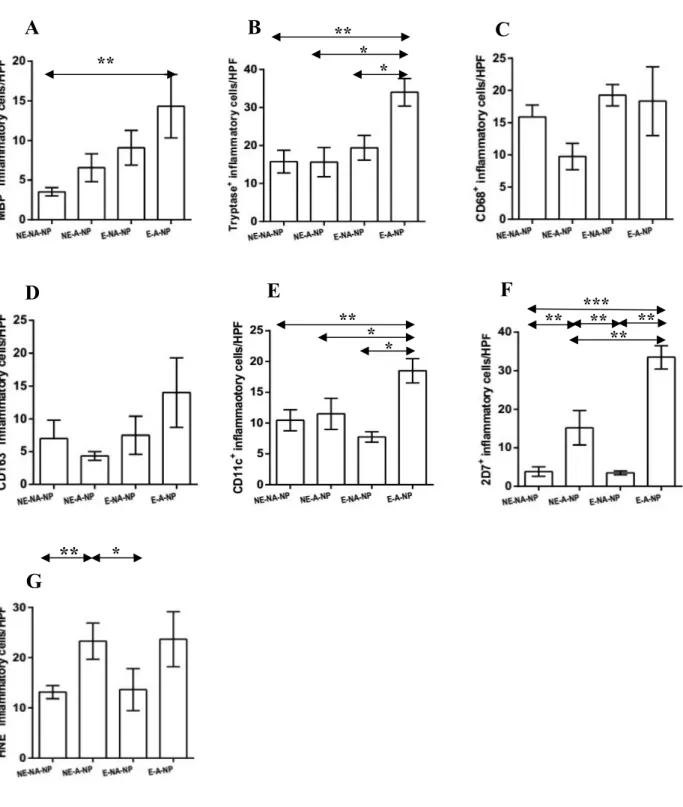
Based on the above results, I classified NP samples into four groups: non-eosinophilic non-allergic, non-eosinophilic allergic, eosinophilic non-allergic or eosinophilic allergic (Fig 4). The frequency of MBP+ cell infiltration was higher in eosinophilic allergic NP than in non-eosinophilic non-allergic NP (Fig 4A). Moreover, eosinophilic allergic NP had more tryptase+ cells, CD11c+ cells, and 2D7+ cells than observed in other types of CRSwNP (Fig 4B, 4E, and 4F). In addition, compared with non- eosinophilic non-allergic NP and eosinophilic non-allergic NP, significantly increased numbers of 2D7+ cells and HNE+ cells were found in non-eosinophilic allergic NP (Fig 4F and 4G). These data imply that allergic status influence cellular distribution in eosinophilic or non-eosinophilic NP.
4. T cell differentiation in different types of non-asthmatic CRS
I investigated the expression levels of mRNAs for T-bet, GATA-3, and RORC in UP tissues from non-asthmatic patients with CRSsNP, patients with CRSwNP, and controls. Interestingly, the mRNA levels of T-bet, GATA-3, and RORC were significantly up-regulated in CRSwNP compared with those in controls (P=.020, P=.029, P=.041). Moreover, T-bet and RORC mRNA expression levels were significantly increased in CRSwNP compared with those in CRSsNP (P=.038, P=.030). However,
12
there were no differences in the levels of T-bet, GATA-3, and RORC3 in the CRSsNP group and control group, although differences in T-bet expression approached significance (P=.065).
Table 2. Patient characteristics and type of method in the innate immue cell study
Control CRSsNP CRSwNP
Total no. of subjects N = 18 (5 male) N = 45 (23 male) N = 56 (35 male)
Tissue used UP UP UP NP
Age (yr), mean (SD) 41 (19) 49 (12) 49 (13) 46 (16)
Allergic rhinitis, N (%) 0 (0%) 16 (35%) 7 (36%) 16 (37%)
Asthma, N 0 0 0 0
Aspirin sensitivity, N 0 0 0 0
Lund-Mackay CT score 0 (0) 8.8 (5.0) 14.0 (6.5) 15.2 (6.6)
Lund-Kennedy score NA 0.9 (1.6) 3.2 (2.5) 3.4 (2.8)
Blood eosinophil (%) 3.6 (2.3) 5.4 (3.8) 4.1 (3.6) 3.6 (3.4) Polyp characteristics
(Eosinophilic/Non-eosinophilic)
NA NA NA 22/34
Methodologies used
Tissue IHC 18 45 56 56
FACS 0 10 0 11
Tissue mRNA 18 25 19 25
Lund-Kennedy score was evaluated at postoperative 6 months.
13
Figure 1. Representative photographs of the immunohistochemical detection of innate immune cells. UP, uncinate process tissue; NP, nasal polyp tissue; CRSsNP, chronic rhinosinusitis without nasal polyps; CRSwNP, chronic rhinosinusitis with nasal polyps; MBP, anti-human eosinophil major basic protein; HNE, anti-human neutrophil elastase (magnification x400).
Normal-UP CRSsNP-UP CRSwNP-UP CRSwNP-NP
CD68
HNE MBP
Tryptase
CD163
CD11c
2D7
14
Figure 2. Distribution of innate immune cells in different type of CRS. The number of (A) MBP+ (B) tryptase+ (C) CD68+ (D) CD163+ (E) CD11c+ (F), 2D7+ (G) HNE+ cells in nasal mucosal tissues was compared according to different types of chronic rhinosinusitis. Correlation between innate immune cells was analyzed; in terms of (H) MBP+ cell and (I) CD11c+ cell. UP, uncinate process tissue; NP, nasal polyp tissue; CRSsNP, chronic rhinosinusitis without nasal polyps; CRSwNP, chronic rhinosinusitis with nasal polyps (*P <.05).
*
* *
H I
A B C D
E F G
* * *
* *
**
* *
* *
* *
* * * * *
**
* * * *
* * *
*
**
15
Table 3. Relationship between immunohistochemistry analysis and clinical parameters
Tissue Positive cell
Clinical parameters
CT score Polyp grade
LK score at 6 months
UP in CRSwNP
MBP+ 0.516* 0.371 0.471
Tryptase+ 0.228 0.204 0.066
CD68+ 0.128 -0.151 0.224
CD163+ -0.044 -0.122 0.354
CD11c+ 0.449* 0.358 0.458
2D7+ 0.112 -0.120 0.125
Elastase+ -0.192 -0.298 -0.259
LK score means Lund-Kennedy score. *P<.05
16
Figure 3. Distribution of innate immune cells according to clinicohistologic parameter. The number of (A) MBP+ (B) tryptase+ (C) CD68+ (D) CD163+ (E) CD11c+ (F) 2D7+ (G) HNE+ cells in nasal mucosal tissues was compared according to clinicohistologic parameter: NE-NP, non- eosinophilic CRSwNP; E-NP, eosinophilic CRSwNP; NA-NP, non-allergic CRSwNP; A-NP, allergic CRSwNP (*P<.05, **P<.01, ***P<.001). †symbol means statistical significance when it compared with uncinate process tissue from CRSwNP.
*** ** ** ***
* * ** ***
*
A B C
D E F
†
*† † †
†
C† †
†
†
†
17
Figure 4. Expression of innate immune cells between subgroup analyses. Comparison of (A) MBP+ (B) tryptase+ (C) CD68+ (D) CD163+ (E) CD11c+ (F) 2D7+ (G) HNE+ cells were performed in nasal polyp tissues among four groups: non-eosinophilic non-allergic (NE-NA-NP), non-eosinophilic allergic (NE-A-NP), eosinophilic allergic (E-NA-NP), eosinophilic allergic NP (E-A-NP) (*P<.05,
**P<.01, ***P<.001).
A B C
**
** *
*
**
** *
*
** *****
** **
D E F
G
*
18
Role of Interleukin-25 in Chronic Rhinosinusitis
1. Interleukin-25 expression and cellular origin in CRSwNP
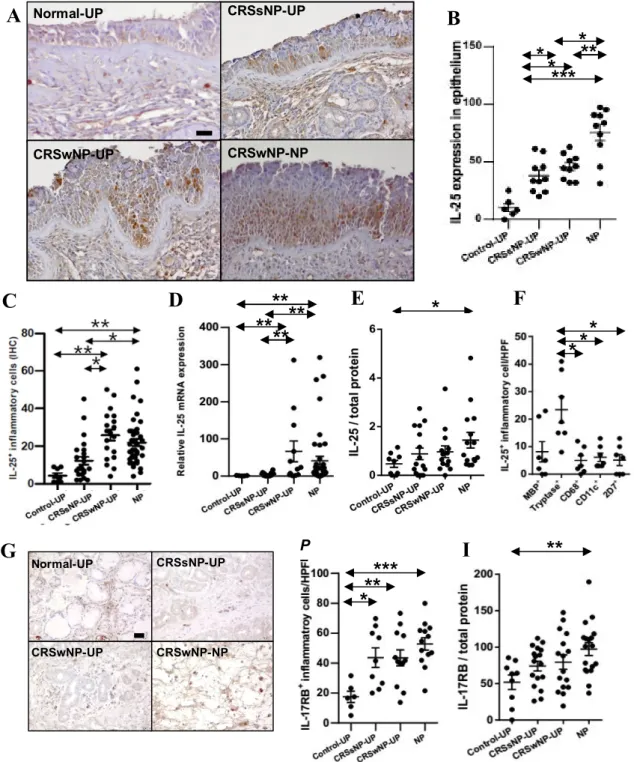
Patient characteristics and type of method in this study was presented in Table 4. To measure expression of IL-25 in patients with CRSwNP, tissues were collected from patients with CRSsNP (UP), patients with CRSwNP (NP and UP), and control subjects (UP). Expression was higher in epithelial cells of NPs than in those of UPs in CRSsNP patients and controls (Fig. 5A and 5B). I documented a significant increase in IL-25-positive inflammatory cells in NPs and UPs of CRSwNP patients compared with UPs from control and CRSsNP subjects (Fig. 5C). I also examined the expression of IL-25 mRNA in each tissue and found that IL-25 mRNAs levels were significantly higher in NP and UP tissues from patients with CRSwNP than UP tissues from other patient groups (Fig. 5D). To examine this observation at the protein level, the concentration of IL-25 was measured using ELISA. These data demonstrated that IL-25 protein levels were significantly increased in NP tissue homogenates from patients with CRSwNP compared with control tissues (Fig. 5E). I used double IHC staining to identify IL-25 positive cells in the subepithelial layer, (Fig. 5F), and the number of double-positive IL-25 and tryptase cells ranged from 1 to 41/HPF (median 19/HPF, n=7) in NPs, whereas the number of double-positive cells for IL-25 and other immune cells, such as MBP+, CD68+, CD11c+ and 2D7+ cells, was 0-23 (median 5/HPF, n=7), 0-12 (median 3/HPF, n=7), 3-13 (median 4/HPF, n=7), and 0-13 (median 6/HPF, n=7), respectively.
2. Interleukin-17RB expression in CRSwNP
IL-25 has been reported to bind and signal through IL-17RB (also known as IL-17BR or IL-17Rh1), a member of the IL-17R family of cytokine receptors. Therefore, I measured expression levels of IL- 17RB in nasal tissues from control, CRSsNP, and CRSwNP patients. IL-17RB-positive inflammatory cells were significantly increased in both CRSsNP and CRSwNP patients compared with controls (Fig.
5G and 5H), and IL-17RB protein levels were significantly higher in NP tissue homogenates from patients with CRSwNP compared with controls (Fig. 5I).
19
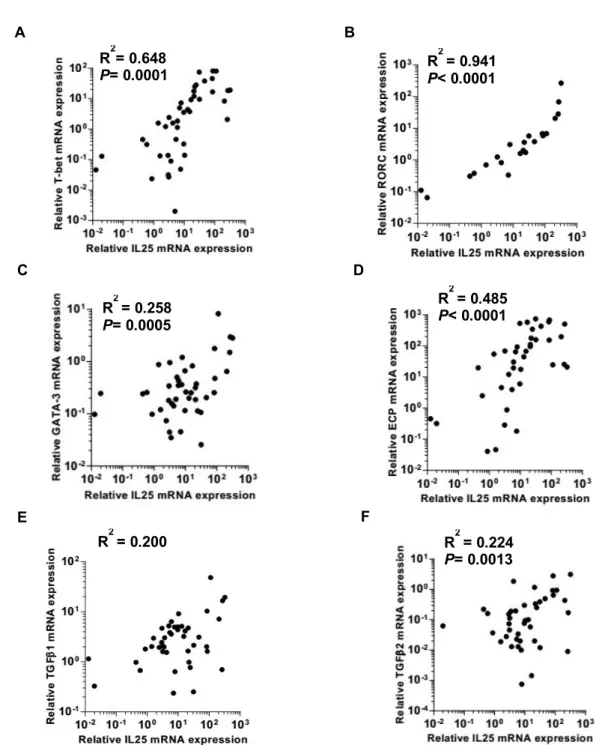
3. Correlations between interleukin-25 mRNA expression and other inflammatory markers
To investigate the implication of upregulated IL-25 in CRSwNP, I examined if IL-25 expression correlated with inflammatory markers, such as T-bet, RORC, GATA3, ECP, TGF-β1, and TGF-β2.
Figure 6 shows IL-25 expression positively correlated with all inflammatory markers tested: T-bet (r=0.805, P=0.001), RORC (r=0.970, P<0.001), GATA3 (r=0.508, P=0.007), ECP (r=0.696, P=0.010), TGF-β1 (r=0.447, P<0.001), and TGF-β2 (r=0.473, P=0.009).
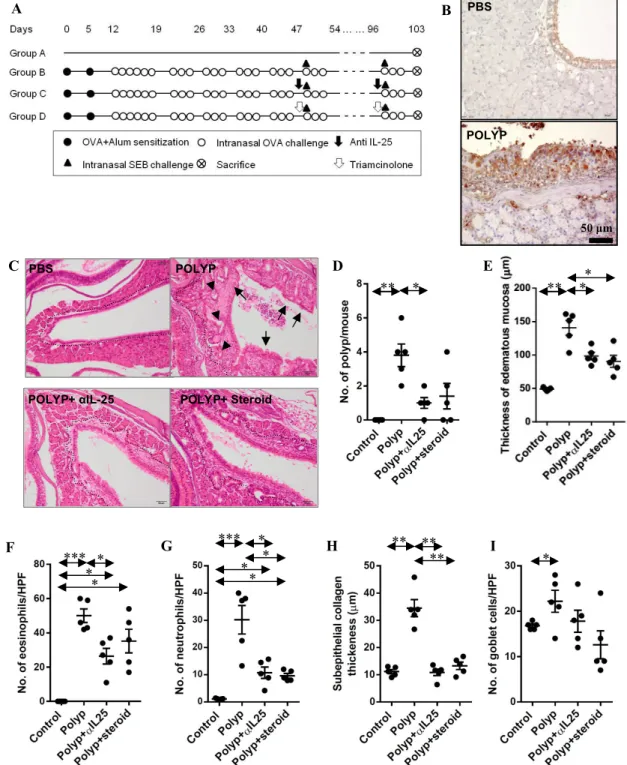
4. Anti-polyp effect of interleukin-25 neutralizing antibody in polyp animal models
To investigate the role of IL-25 in nasal polypogenesis, I used an NP mouse model and confirmed its IL-25 expression. Nasal polyp models showed higher IL-25 expression in NP mice compared to control mice (Fig. 7A and 7B). Both anti-IL-25 (POLYP+αIL-25) and steroid (POLYP+steroid) treatment reduced the number of nasal polyps, and mucosal thickness in NP mice (Fig. 7C-E). I also observed the decreased numbers of eosinophils, neutrophils and the thickness of subepithelium in the POLYP+αIL-25 group compared to the untreated POLYP group (Fig. 7F-H). However, the anti-IL-25 antibody had no inhibitory effect on goblet cell hyperplasia (Fig. 7I).
5. Changes in cytokines, chemokines, and adhesion molecules after interleukin-25 inhibition
Both anti-IL-25 and steroid therapy suppressed IL-25 expression in the mouse model (Fig. 8A), and also cytokine profiles of nasal lavage fluid samples reflected the histological findings. Anti-IL-25 treatment reduced levels of IL-4, INF-γ, and TGF-β1 in POLYP+αIL-25 mice were suppressed but similar to control mice (Fig. 8B-D). However, I observed no significant difference of IL-17A between POLYP and POLYP+αIL-25 groups (Fig. 8E). To verify inflammatory cell recruitment was inhibited by anti-IL-25 treatment, eosinophil chemotactic cytokines (CCL11 and CCL24), neutrophil-recruiting chemokines (CXCL1 and CXCL2), and recruitment adhesion molecules (E-selectin, ICAM-1, and VCAM-1) were assessed in NP mice. These chemokines and adhesion molecules were upregulated when NPs were induced in mice (Fig. 8F-9L), but IL-25 inhibition led to the downregulation of CCL11, CXCL2, ICAM-1 and VCAM-1.
20
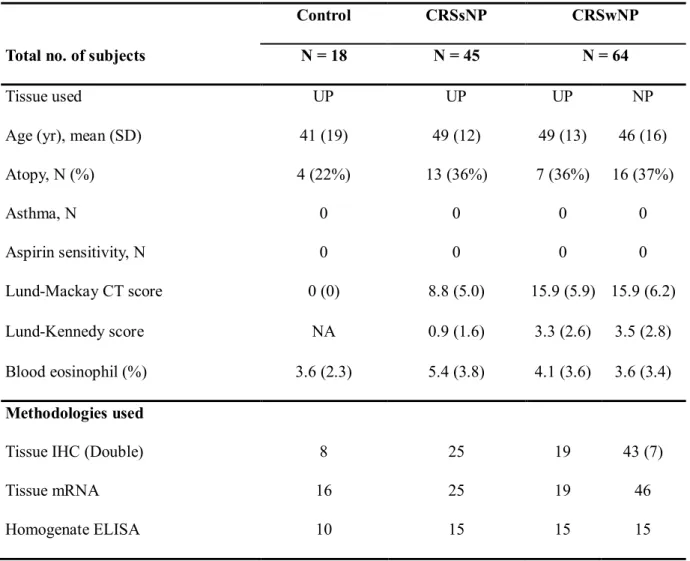
Table 4. Patient characteristics and type of method in the IL-25 study
Control CRSsNP CRSwNP
Total no. of subjects N = 18 N = 45 N = 64
Tissue used UP UP UP NP
Age (yr), mean (SD) 41 (19) 49 (12) 49 (13) 46 (16)
Atopy, N (%) 4 (22%) 13 (36%) 7 (36%) 16 (37%)
Asthma, N 0 0 0 0
Aspirin sensitivity, N 0 0 0 0
Lund-Mackay CT score 0 (0) 8.8 (5.0) 15.9 (5.9) 15.9 (6.2)
Lund-Kennedy score NA 0.9 (1.6) 3.3 (2.6) 3.5 (2.8)
Blood eosinophil (%) 3.6 (2.3) 5.4 (3.8) 4.1 (3.6) 3.6 (3.4) Methodologies used
Tissue IHC (Double) 8 25 19 43 (7)
Tissue mRNA 16 25 19 46
Homogenate ELISA 10 15 15 15
Lund-Kennedy score was evaluated at postoperative 6 months.
21
Figure 5. Expression of IL-25 and IL-17RB in CRS. (A) Representative immunostaining for IL-25 (B) Number of IL-25+ epithelial cells per 100 cells (C) Number of IL-25+ inflammatory cells (HPF;
x400) (D) Relative IL-25 mRNA expression (E) Protein levels of IL-25 (F) Double immunohistochemical stain for MBP, Tryptase, CD68, CD11c or 2D7, and IL-25 (G) Representative photos for IL-17RB immunostaining (H) Number of IL-17RB+ inflammatory cells (I) Protein level of IL-17RB (*P<.05, **P<.01, ***P<.001).
C **
** **
**
A
Normal-UP CRSsNP-UPCRSwNP-NP CRSwNP-UP
* *
*
*
* **
* * ***
D E
G
* ** *** I **
F B
P
=
Normal-UP CRSsNP-UP
CRSwNP-NP CRSwNP-UP
22
Figure 6. Correlation between mRNA expression of IL-25 and inflammatory markers. The mRNA expression levels of T-bet, RORC, GATA-3, ECP, TGF-β1, and TGF-β2 were measured in nasal polyps (n=43), and correlations between IL-25 and each inflammatory markers were investigated. Pearson’s correlation test was used and R-square values indicate the coefficient of determination.
R2 = 0.258 P= 0.0005 C
R2 = 0.485 P< 0.0001 D
R2 = 0.200 R2 = 0.224
P= 0.0013
E F
R2 = 0.941 P< 0.0001 R2= 0.648
P= 0.0001
A B
23
Figure 7. Anti-polyp effect of IL-25 neutralizing antibody in animal models. (A) Protocol for the murine model of allergic CRS with polypoid lesions. (B) Representative images in control (PBS) and polyp model (POLYP). (C) Dotted lines represent the border between glandular structure and maxillary sinus mucosa. Arrows and arrowheads indicate polypoid lesions and epithelial ingrowth. (D) The number of polypoid lesion (E) mucosal thickness (F) number of eosinophils (G) number of neutrophils (H) subepithelial collagen deposition (I) number of goblet cells were counted.
A
50 μm POLYP
B PBS
C D
*
E
G H
POLYP
POLYP+ αIL-25 POLYP+ Steroid PBS
I
**
*** *
**
*** *
**
* ** **
** *
*
** *
F
24
Figure 8. Changes in cytokine profiles, chemokine and adhesion molecule expression after anti- IL-25 therapy. (A) The number of IL-25-positive epithelial cells was counted. (B-E) Cytokine profile from nasal lavage fluid (n=8 for each group). (F-I) Relative mRNA expression levels of leukocyte- recruiting cytokines from each group were compared. (J-L) Relative mRNA expression levels of intercellular adhesion molecules from each group were compared.
A
*
*
B * *
* * *
P=0.054
*
** **
**
**
C D E
**
*
*
* **
*
**
** *
F G H I
* P=0.07 ** * ** *
*
J K L
25
Role of Interleukin-33 in Chronic Rhinosinusitis
1. Interleukin-33 expression and ST2 expression in CRS
Patient characteristics and type of method in this study was presented in Table 5. To examine expression of IL-33, UP tissue was collected from control subjects (Control-UP), patients with CRSsNP (C-UP), and patients with CRSwNP (P-UP) and NP tissues were obtained from patients with CRSwNP (NP). IHC revealed that the expression of IL-33 was higher in epithelial cells of C-UP and P-UP than in Control-UP or NP (Fig. 9A). IL-33-positive inflammatory cells were significantly increased in P-UP compared with Control-UP or C-UP (Fig. 9B). I also examined the expression of IL-33 mRNA in each tissue and found that IL-33 mRNAs levels were significantly increased in P-UP compared to Control-UP (Fig. 9C). Moreover, UP tissues from CRSwNP patients had greater expression of IL-33 mRNA than NP tissues from CRSwNP patients (Fig. 9C). To confirm these findings at the protein level, the concentration of IL-33 was measured using ELISA and normalized to total protein concentration. These data demonstrated that IL-33 protein levels were significantly increased in C-UP and P-UP homogenates compared to those in Control-UP and NP homogenates (Fig.
9D). IL-33 has been reported to function via binding to the ST2 receptor complex. Therefore, I measured expression levels of ST2 in nasal tissues from control, CRSsNP, and CRSwNP patients. By IHC and qRT-PCR, the number of ST2-positive cells and the expression level of ST2 were significantly higher in C-UP and P-UP tissues than in Control-UP and NP tissues (Fig. 9E-G).
2. Correlations between IL-33 mRNA expression and inflammatory markers in UP from CRS
Because I previously identified elevated expression of IL-33 in UPs but not in NPs from patients with CRSwNP, I next sought to elucidate the role of IL-33 in the development of CRS. I examined the relationship between IL-33 expression and inflammatory markers, namely IL-4, IL-5, IL-13, IFN-γ, TNF-α, IL-17A, IL-22, IL-23p19, ECP, and MPO in UP from CRS patients. Expression of mRNA of IFN-γ (r=0.4892**), IL-17A (r=0.4298**), IL-22 (r=0.3020*), and IL-23p19 (r=0.3237*) were positively correlated with IL-33 mRNA expression (Fig. 10A-D); however, the level of IL-33 mRNA
26
was not correlated with that of IL-4, IL-5, IL-13, TNF-α, ECP, or MPO mRNA. Interestingly, in UP from CRS, a significant correlation between CXCL1 and IL-33 mRNA expression was observed (Fig.
10E). I also investigated whether IL-33 expression was associated with remodeling of inflammatory markers such as TGF-β1,-2,-3, and COL1A. Expression of IL-33 mRNA was correlated with the remodeling markers TGF-β1 (r=0.3739*; Fig 10F) and COL1A1 (r=0.3215*; Fig. 10G). In addition, using a semi-quantitative method, I found that total collagen protein levels were positively correlated with the numbers of IL-33-positive inflammatory cells (r=0.4401*; Fig. 10H).
3. Differences in IL-33 expression between eosinophilic and non-eosinophilic CRSwNP
Previous studies demonstrated that non-eosinophilic NPs is usually characterized by glandular hypertrophy and fibrosis rather than edema, similarly to UPs, as well as increased neutrophilic infiltration compared to eosinophilic NPs (6, 7, 40). Thus, I investigated the difference in IL-33 expression between patients with eosinophilic and non-eosinophilic NPs (Fig 11A-C). The expression of IL-33 in epithelial cells was significantly higher in non-eosinophilic NPs than in eosinophilic NPs.
IL-33 protein levels and IL-33 mRNA expression were also significantly higher in non-eosinophilic NPs. Next line, to analyze the role of IL-33 in non-eosinophilic NPs, I investigated the relationship between IL-33 expression and expression of other inflammatory markers according to the endotypes of CRSwNP. Using qRT-PCR, I found that the expression of IL-33 mRNA in non-eosinophilic NPs was correlated with mRNA expression of IFN-γ, TNF-α, and TGF-β1 (r=0.4780**, r=0.4118*, and r=0.4231*, respectively; Fig. 11D-F). To determine whether IL-33 was associated with recruitment of neutrophils, human neutrophil marker (MPO) and neutrophil-recruiting chemokines (CXCL1 and CXCL2) were assessed in NP tissues. In non-eosinophilic NPs, MPO and CXCL1 and CXCL2 mRNA levels were correlated with IL-33 expression (r=0.4826*, r=0.5421**, and r=0.5186**, respectively;
Fig. 11G-I). In addition, mRNA expression of IFN-γ, TNF-α, CXCL1 and CXCL2 in eosinophilic NPs, which was though expressed at lower levels, also associated with IL-33 expression (r=0.6217*, r=0.5239*, r=0.4521* and r=0.6121**, respectively). Collectively, these findings indicate that non- eosinophilic NPs exhibits increased IL-33 expression and that IL-33 is involved in remodeling in non-
27 eosinophilic NPs, depending on recruitment of neutrophils.
4. Anti-polyp effect of IL-33 neutralizing antibody in murine models
To investigate the therapeutic potential of IL-33 blockade in nasal polypogenesis, I used a murine model of CRS with polypoid lesions (Fig. 12A). This murine model showed higher expression of IL- 33 in the epithelial layer and in inflammatory cells than the control mice (Fig. 12B). The mucosal thickness was apparently more severe in NP mice than in control mice. Significantly, treatment with anti-IL-33 (POLYP+αIL-33 group) reduced the number of NP-like lesions, edematous mucosal thickness, thickness of the subepithelial collagen layer, and number of goblet cells in the NP models (Fig. 12C-F). The cytokine profiles of the nasal lavage fluid from treatment samples were also in accordance with histological findings (Fig. 12G-J). After treatment with anti-IL-33 antibody, the protein levels of IFN-γ, IL-17A, and TGF-β1 were significantly decreased compared with those of the POLYP group; however, no statistical differences in the titers of IL-4 between two groups.
5. Changes in neutrophil recruitment after IL-33 inhibition
To verify the change of cytokines IL-33 inhibition, I investigated the infiltration of inflammatory cells. The degree of neutrophilic infiltration in POLYP+αIL-33 group was decreased compared to that in POLYP group, whereas the anti-IL-33 treatment had no inhibitory effect on the number of eosinophils in these mice (Fig. 13A and 13B). To verify that the inflammatory cell recruitment was inhibited by anti-IL-33 treatment, qRT-PCR was used to assess the levels of recruitment adhesion molecules (ICAM-1 and VCAM-1), eosinophil chemotactic cytokines (CCL11 and CCL24), and neutrophil-recruiting chemokines (CXCL1 and CXCL2) in this experimental model (Fig. 13C-H).
These adhesion molecules and chemokines were upregulated in POLYP group compared with control mice, while the anti-IL-33 treatment led to the downregulation of ICAM-1, VCAM-1, and CXCL2.
28
Table 5. Patient characteristics and study methodology in the IL-33 study
Control CRSsNP CRSwNP
Total no. of subjects N = 19 N = 46 N = 41 N = 68
Tissue used UP UP UP NP
Age (yr), mean (SD) 45 (19) 49 (13) 48 (14) 49 (14)
Atopy, N (%) 6 (31%) 18 (39%) 14 (34%) 26 (38%)
Asthma, N 0 3 5 5
Lund-Mackay CT score 0 (0) 8.9 (5.3) 15.3 (6.1) 15.6 (5.1)
Blood eosinophil number (/mm3) 86.9 (53.7) 172.9 (112.3) 162.8 (132.9) 139.1 (118.5) Methodologies used
Tissue IHC 9 25 24 58
Tissue mRNA 19 42 41 68
Homogenate ELISA 9 18 16 31
29
Figure 9. Expression of IL-33 and ST2 in different types of CRS. (A) IHC detection of IL-33 (B) Number of IL-33-positive inflammatory cells (HPF; x400) (C) Relative IL-33 mRNA expression (D) Protein levels of IL-33 (E) IHC detection of ST2 (F) Number of ST2-positive inflammatory cells (HPF; x400) (G) Relative ST-2 mRNA expression (*P<0.05, **P<0.01, and ***P<0.001).
** P=0.057
B *
** **
** **
* **
C D
Control-UP CRSsNP-UP
CRSwNP-NP CRSwNP-UP
50 μm
A
Control-UP CRSsNP-UP
CRSwNP-NP CRSwNP-UP
** **
* **
F G
** *
** *
E **
30
Figure 10. Correlation between IL-33 expression and inflammatory markers in UP tissues from CRS patients. The correlation of mRNA expression of IL-33 and inflammatory markers: (A) IFN-γ (n=41) (B) IL-17A (n=49) (C) IL-22 (n=56) (D) IL-23p19 (n=54) (E) CXCL1 (n=43) (F) TGF-β-1 (n=41) (G) COL1A1 (n=56). (H) The correlation between the number of IL-33-positive cells and quantification of collagen using image analysis were investigated in UPs from patients with CRS.
G H
A B
E
C
D F
31
Figure 11. Expression of IL-33 and correlation between IL-33 expression and inflammatory markers according to the endotype of CRSwNP. (A) Number of IL-33-positive epithelial cells per 100 cells (B) Protein levels of IL-33 (C) Relative IL-33 mRNA expression The correlations of mRNA expression levels between IL-33 and inflammatory markers, including (D) IFN-γ (E) TNF-α (F) TGF- β-1 (G) MPO (H) CXCL1,and (I) CXCL2 were investigated in NPs.
B
* **
C A
***
*** P=0.058
E
D F
G H I
32
Figure 12. Anti-polyp effect of IL-33 neutralizing antibody in polyp animal models. (A) Protocol for the murine model of allergic CRS with polypoid lesions (B) IL-33 was strongly expressed in the nuclei of epithelial cells from NP model. (C) The number of NP lesions (D) edematous mucosal thickness (E) subepithelial collagen deposition (F) the number of goblet cells were compared. (G-J) Cytokine profile from nasal lavage fluids were compared (*P<0.05, **P<0.01, and ***P<0.001).
B
50 μm
PBS
Polyp model A
** * ** ** * ** ** * **
G
***
**
** ***
* *
H I J
** ***
C D E F
33
Figure 13. Anti-IL-33 therapy suppresses neutrophil infiltration and expression of neutrophil chemotactic cytokines and intercellular adhesion molecules in a murine model. (A) The number of infiltrated neutrophils and (B) eosinophils were counted and compared among groups. Relative mRNA expression levels of (C) ICAM-1 (D) VCAM-1 (E) CCL11 (F) CCL24 (G) CXCL1 (H) CXCL2 were compared among groups (*P<0.05, **P<0.01, and ***P<0.001).
** *
** * ** **
** **
** ** **
** ** ** * ** *
A B C D
E F G H
34
DISCUSSION
In the present study, firstly, I evaluated the role of innate immune cells in different type of CRS in Asian patients. Several stains were conducted in order to compare the innate immune cells according to the phenotype of CRS: MBP for eosinophils, tryptase for mast cells, CD68 for M1 polarized macrophages, CD163 for M2 polarized macrophages, CD11c for dendritic cells, 2D7 for basophils, and HNE for neutrophils. To my knowledge, this is the first study to investigate immunohistologic features of innate immunity according to the phenotype of CRS in Asian patients. Importantly, in the immunohistochemical study of UP tissues, I found that patients with CRSwNP had a higher infiltrate of all kinds of innate immune cells in UP tissues than that of normal controls, whereas other cells except for MBP+ and CD11c+ cells were increased in UP tissues from CRSsNP compared to controls.
In addition, CRSwNP showed more severe MBP+ cells, CD68+ cells, and CD11c+ cells infiltration than CRSsNP. This is consistent with evidence that various innate immune cells are associated with the pathogenesis of CRS (11, 35). In this study, I also evaluated the effector cells that considered to contribute for nasal polypogenesis using comparison of UP and NP from CRSwNP. I found that NP tissues showed excessive accumulation of MBP+ cells, CD11c+ cells, 2D7+ cells,and HNE+ cells compared to UP tissues from CRSsNP or CRSwNP. Although CD11c is not exclusively as marker for dendritic cell, these data are in agreement with previously reported elevated eosinophils, dendritic cells, basophils, and neutrophils in CRSwNP (41-45). In addition, the infiltration of MBP+ and CD11c+ cells increased gradually with the disease progression and I found a positive correlation between these and disease extent in UP tissues from CRSwNP. Thus, these results suggest that MBP+ cells and CD11c+ cells may be major effector cells for nasal polypogenesis in Asian CRSwNP.
Secondly, I evaluated the role of innate cytokines (IL-25 and IL-33) in different type of CRS in Asian patients. Innate cytokines are produced and secreted from epithelial cells in response to external stimuli, such as pollutants, allergens, and microbes (46). IL-25 and IL-33 are both produced in sinonasal epithelial cells and may play an important role in promoting Th2 inflammation in CRSwNP
35
(8, 12). Although innate cytokine-responsive ILC2s have been identified in NPs (12), the specific role of IL-25 in NP pathogenesis has not been fully understood. Interestingly, the present study showed IL- 25 expression levels increased in NP tissues and correlated with T-bet, RORC and GATA3 upregulation in CRSwNP, suggesting IL-25 may be involved in diverse inflammatory pathways. The mixed phenotypes of Th1/Th2/Th17 pathways observed in Asian NP patients indicates a causal factor superior to final effector cells or cytokines in the inflammatory hierarchy may exist, such as the innate cytokine IL-25. NP tissues from this study were characterized by non-asthmatic and lower eosinophilic patient features, in contrast with NP tissues often found in Western groups. The expression of typical transcriptional factors involved in Th1/Th2/Th17 cell responses was elevated simultaneously in NP tissues from this study. Thus, the significant correlations between IL-25, T-bet, RORC, and GATA3 expression implies IL-25 may affect NP pathogenesis in Asian individuals by inducing mixed inflammatory reactions. I also observed mast cells were more abundant among infiltrated inflammatory IL-25+ cells than in eosinophils. Considering NPs of Asian patients are often less eosinophilic, mast cells may play a protective role in mucosal maintenance when the epithelium is injured or inflamed. Mast cells can produce diverse cytokines related to Th1 and Th2, which could contribute to the heterogeneous inflammatory responses, observed in Asian patients with CRSwNP.
However, my study shows only the potential engagement of mast cells in NP pathogenesis, and their exact role during nasal polypogenesis should be further explored. Moreover, treatment with anti-IL-25 neutralizing antibody or steroid therapy equally suppressed polyp formation in the animal model.
Anti-IL-25 treatment also suppressed IL-4 and IFN-γ expression in nasal lavage fluids from mice and downregulated mRNA expression of CCL11, CXCL2, ICAM-1, and VCAM-1. I concluded the anti- polyp effect could be obtained by suppressing the recruitment of effector cells.
Apart from IL-25, I also investigated the role of IL-33 in the pathophysiology of CRS in Asian patients and report differences in IL-33 expression according to the phenotype and endotype of CRS patients. These data indicated that the concentration of IL-33 expression in NP tissues was not significantly different than that in Control-UP tissues; however, I found a significant difference in IL- 33 expression in UP tissues according to the phenotype of CRS. My results showed elevated
36
expression of IL-33 in UP tissues, but not in NP tissues, from CRS patients compared with healthy control subjects. Moreover, analysis of the correlation between IL-33 and inflammatory markers indicated that expression of IL-33 in UPs correlated with expression of the Th1 (IFN-γ) and Th17 (IL- 17A, IL-22, and IL-23p19) cytokines as well as with the multiple remodeling markers, such as TGF- β1 and collagen type I. These results suggest that IL-33 may play a crucial role in nasal mucosa inflammation and tissue remodeling in CRS in Asian patients. To date, the non-eosinophilic type has been distinguished as the predominant endotype of CRSwNP in Asians. Interestingly, I found a difference in IL-33 expression between eosinophilic and non-eosinophilic NPs. The expression of IL- 33 levels was significantly increased in non-eosinophilic NPs compared to those in eosinophilic NPs.
Non-eosinophilic NPs also exhibited increased numbers of HNE+ cells, and the expression of typical cytokines (IFN-γ/TNF-α) involved in the Th1 immune response was elevated in those. In addition, we observed that in non-eosinophilic NPs, IL-33 levels were correlated with IFN-γ and TNF-α, which serve as markers for Th1 cytokines, with TGF-β1, which serves as a marker for tissue remodeling, and MPO, which serves as a marker for neutrophil infiltration, and with CXCL1/CXCL2, which serve as chemokines for neutrophil recruitment. Collectively, these data suggest a role of IL-33 in non- eosinophilic NPs and indicate an association between inflammation and remodeling via neutrophil recruitment. Moreover, in animal study, I detected the expression of IL-33 in epithelial and inflammatory cells in nasal polypoid mice. In addition, I found that the formation of nasal polypoid lesions and the degree of average mucosal thickness were diminished by administration of anti-IL-33.
Similarly, the POLYP+αIL-33 group showed a significant decrease in the thickness of the subepithelial collagen and in the number of goblet cells compared to the POLYP group. Interestingly, I observed that the infiltration of neutrophils was decreased in the POLYP+αIL-33 group compared with levels in the POLYP group; yet, no significant differences in the infiltration of eosinophils were observed between these groups. Furthermore, I demonstrated decreased expression of cytokines (IFN- γ/IL-17A/TGF-β1), adhesion molecules (ICAM-1/VCAM-1), and neutrophil-recruiting chemokine (CXCL2) in the POLYP+αIL-33 group compared to that in the POLYP group. Considering these results, the anti-polyp effect of IL-33 inhibition may stem from suppression of neutrophil recruitment.
37
Conclusion
In the present study, firstly, I found that infiltration of MBP+ and CD11c+ innate immune cells show a significant association with phenotype and disease extent of CRS and allergic status also may influences cellular phenotype in Asian patients with CRSwNP. Secondly, IL-25 and IL-33, secreted from the sinonasal epithelia, plays a crucial role in the pathogenesis of Asian patients with CRSwNP.
In addition, these results demonstrate the novel possibility of treating nasal polyposis with anti-IL-25 or IL-33 therapy.
38
References
1. Fokkens WJ, Lund VJ, Mullol J, Bachert C, Alobid I, Baroody F, et al. EPOS 2012: European position paper on rhinosinusitis and nasal polyps 2012. A summary for otorhinolaryngologists.
Rhinology. 2012 Mar;50(1):1-12.
2. Van Zele T, Claeys S, Gevaert P, Van Maele G, Holtappels G, Van Cauwenberge P, et al.
Differentiation of chronic sinus diseases by measurement of inflammatory mediators. Allergy. 2006 Nov;61(11):1280-9.
3. Van Bruaene N, Derycke L, Perez-Novo CA, Gevaert P, Holtappels G, De Ruyck N, et al. TGF-beta signaling and collagen deposition in chronic rhinosinusitis. Journal of allergy and clinical immunology. 2009 Aug;124(2):253-9, 9 e1-2.
4. Polzehl D, Moeller P, Riechelmann H, Perner S. Distinct features of chronic rhinosinusitis with and without nasal polyps. Allergy. 2006 Nov;61(11):1275-9.
5. Zhang N, Van Zele T, Perez-Novo C, Van Bruaene N, Holtappels G, DeRuyck N, et al. Different types of T-effector cells orchestrate mucosal inflammation in chronic sinus disease. Journal of allergy and clinical immunology. 2008 Nov;122(5):961-8.
6. Cao PP, Li HB, Wang BF, Wang SB, You XJ, Cui YH, et al. Distinct immunopathologic characteristics of various types of chronic rhinosinusitis in adult Chinese. Journal of allergy and clinical immunology. 2009 Sep;124(3):478-84, 84 e1-2.
7. Shi LL, Xiong P, Zhang L, Cao PP, Liao B, Lu X, et al. Features of airway remodeling in different types of Chinese chronic rhinosinusitis are associated with inflammation patterns. Allergy. 2013 Jan;68(1):101-9.
8. Chin D, Harvey RJ. Nasal polyposis: an inflammatory condition requiring effective anti- inflammatory treatment. Current opinion in otolaryngology & head and neck surgery. 2013 Feb;21(1):23-30.
9. Kim HY, DeKruyff RH, Umetsu DT. The many paths to asthma: phenotype shaped by innate and
39
adaptive immunity. Nature immunology. 2010 Jul;11(7):577-84.
10. Spits H, Di Santo JP. The expanding family of innate lymphoid cells: regulators and effectors of immunity and tissue remodeling. Nature immunology