Gender Differences in Relationship between Fat-Free Mass Index and Fat Mass Index among Korean Children Using
Body Composition Chart
HyeongGeun Park,
1KeeHo Park,
2Myung Hyun Kim,
2Gyo Sun Kim,
3and Sochung Chung
31Shine Pediatric Clinic, Seoul;
2Cancer Information and Education Branch, National Cancer Control Research Institute, Goyang;
3Department of Pediatrics, Konkuk University Medical Center, Konkuk University School of Medicine, Seoul, Korea.
Received: February 25, 2011 Revised: July 11, 2011 Accepted: July 11, 2011
Corresponding author: Dr. Sochung Chung, Department of Pediatrics,
Konkuk University Medical Center, Konkuk University School of Medicine, 4-12 Hwayang-dong, Gwangjin-gu, Seoul 143-729, Korea.
Tel: 86-2-2030-7553, Fax: 86-2-2030-7748 E-mail: [email protected]
∙ The authors have no financial conflicts of interest.
© Copyright:
Yonsei University College of Medicine 2011 This is an Open Access article distributed under the terms of the Creative Commons Attribution Non- Commercial License (http://creativecommons.org/
licenses/by-nc/3.0) which permits unrestricted non- commercial use, distribution, and reproduction in any medium, provided the original work is properly cited.
Purpose: This study aimed to investigate gender differences in the relationship be- tween fat-free mass index (FFMI) and fat mass index (FMI) by applying body composition chart on Korean elementary students. Materials and Methods: Data from 965 healthy Korean children of 8 to 12 years of age (501 boys, 464 girls) were obtained. FFMI and FMI were plotted on the body composition chart, and the dif- ferences in the relationships between FFMI and FMI were separately evaluated by gender or grade. Results: Weight was heavier and BMI was higher in 3rd and 4th grade boys compare to girls. The value of FFM was higher in boys, but FM was not different. In subgroup analysis by grade, significant gender by FFMI interac- tion (p=0.015) was found, indicating that the slope of the lines for FMI vs. FFMI was different between boys and girls (Figure was not shown). In subgroup analysis by gender, grade by FFMI interaction was significant in boys, indicating that FMI vs. FFMI relationship differed according to grade only in boys. Conclusion: Boys are leaner than girls, despite having similar BMI. Gender difference in the direc- tion of the change of the FFMI and FMI relationship is evident in children.
Key Words: Obesity, child, Korea
INTRODUCTION
The recent increase in the prevalence of childhood obesity has been well-estab- lished around the world, including South Korea and concerns about the excess adi- posity in childhood are increasing.1-3
Body mass index (BMI) is widely used as a surrogate marker of fatness.4,5 The sta- tistical definition of BMI is that it adjusts weight (WT) for variability in height (HT)6:
BMI = WT/HT2 (equation 1)
However, it has limitations and should be used with caution when assessing chil- dren as the change in BMI does not reflect the change in adiposity during child-
digital electric scale. Height was measured to the nearest 0.1 with barefoot, using stadiometer.
FM (kg) and FFM (kg) were measured with bioelectrical impedance analysis (BIA) using multi frequency bioelectri- cal impedance analyzer (InBody J10, Biospace, Seoul, Ko- rea). Subjects emptied their bladders first to minimize mea- surement errors and were asked to stand barefoot, facing forward. Anthropometric measurements and BIA were con- ducted in the morning on the same day.
The values of body compartment of FM (kg) and FFM (kg) measured with BIA were used for FMI and FFMI.
FFMI and FMI were plotted on the body composition chart, and the relationships between FFMI and FMI were explored on the body composition chart in common units (kg/m2).
Statistical analysis
All data were analyzed using software version 11.0 for win- dows (SPSS Inc., Chicago, IL, USA), and p value of less than 0.05 was considered to be statistically significant. T-test was used to test for gender differences. Analysis of variance was conducted for grade differences separately in both gen- ders. The relationship between FMI and FFMI was as- sessed by multiple regression analysis. The differences in the relationships between FFMI and FMI by gender and grade were evaluated. Regression analysis was conducted separately in each gender, also. In multiple regression anal- ysis, grade and FFMI by grade interaction were the final in- dependent variables.
RESULTS
Subject characteristics
The characteristics of the subjects are provided in Table 1, as well as the various body components. Weight was heavier and BMI was higher in 3rd and 4th grade boys compare to girls. The value of FFM was higher in boys, but FM was not different. FFMI was higher in boys. In terms of body fat per- cent and FMI were not different in boys and girls.
Gender difference in relationship between FFMI and FMI
Gender difference was demonstrated in the relationship be- tween FFMI and FMI using body composition chart (Fig. 1).
In subgroup analysis by grade, significant gender by FFMI interaction (p=0.015) was found, indicating that the slope of the lines for FMI vs. FFMI differed between boys and hood.7-9 The simplest model of body composition divides
WT into fat mass (FM) and lean mass (LM) components:
WT=LM+FM (equation 2)
VanItallie, et al.10 proposed that equations 1 and 2 could be combined in order to divide BMI into its fat and lean components:
BMI=fat-free mass index (FFMI)+fat mass index (FMI) (equation 3)
In general, lean mass index (LMI) and FFMI can be used to mean the same thing. Body composition is difficult to measure in children because accurate techniques require participant compliance and are only available in specialized research institutions. Recently, more practical methods such as bioelectrical impedance analysis (BIA) for epidemiolog- ic studies and clinical practice are available.11 Although in- creases in FM are generally observed in boys and girls, in- creases in BMI throughout childhood are driven primarily by increases in FFM, particularly in boys.12 The relation- ships between FFMI and fat mass index (FMI) can be de- lineated on the body composition chart. Hattori13 have de- vised a chart, based on FFMI and FMI on the x and y axes, respectively. It has advantage of expressing both aspects of body composition in common units.14 The effects of varia- tion in FFM and FM on BMI can be explored using body composition chart, and various combinations of FFMI and FMI can result in a similar BMI.15
The objective of this study was to determine the gender difference in the relationship between FFMI and FMI with increasing age by applying body composition chart analysis on Korean elementary school children.
MATERIALS AND METHODS
Subjects
Data from 965 healthy Korean children of 8 to 12 years of age (501 boys, 464 girls) were obtained from the annual school health examination at a primary school, located in Seoul, South Korea.
Measurements
While subjects were dressed in light sports attire, body weight was measured to the nearest 0.1 kg on a calibrated
pectation, however, this study proved to be not always true, especially in children. Girls did not have higher levels of fat mass or percentage body fat than boys did.
Although boys showed higher BMI, FM was not differ- ent between boys and girls. The higher values of FFM in boys could explain the difference of BMI in this age group.
Even though body fat percent, FFMI and FMI were not dif- ferent between boys and girls, the relationships between FFMI and FMI were different by gender using body com- position chart (Fig. 1).
In subgroup analysis by grade, there was a significant girls (Figure was not shown). In subgroup analysis by gen-
der, grade by FFMI interaction was significant in boys indi- cating that FMI vs. FFMI relationship differed according to grade only in boys (Table 2).
DISCUSSION
The gender difference in the relationship between FFMI and FMI was demonstrated in this study. Girls are generally known to have relatively more fat. In contrary to such ex-
Table 1. Characteristics in Girls (a) and Boys (b) by Grade in School
(a) 3rd (n=114) 4th (n=129) 5th (n=103) 6th (n=118)
Age (yrs)‡ 8.75 (8.17-9.34) 9.59 (8.83-10.25) 10.59 (9.42-11.25) 11.67 (10.83-12.17)
Height (m) 1.30±0.06 1.37±0.06 1.44±0.06 1.50±0.06
Weight (kg) 29.5±5.1 33.9±6.9 39.7±8.4 44.2±10.2
BMI (kg/m²) 17.4±2.3 17.9±2.7 19.1±3.0 19.6±3.5
Fat free mass (kg) 22.1±2.5 25.1±3.4 28.7±4.1 31.9±5.1
Fat mass (kg) 7.4±3.4 8.8±4.2 11.1±5.1 12.3±5.8
Body fat percent (%) 24.2±7.2 24.9±6.9 26.6±7.2 26.5±7.2
FFMI (kg/m²) 13.0±0.8 13.3±1.0 13.9±1.1 14.2±1.4
FMI (kg/m²) 4.3±1.9 4.6±2.0 5.3±2.2 5.4±2.3
(b) 3rd (n=142) 4th (n=129) 5th (n=120) 6th (n=110)
Age (yrs)‡ 8.75 (7.34-9.92) 9.67 (9.17-10.25) 10.67 (10.17-11.25) 11.59 (11.17-12.25)
Height (m) 1.31±0.06 1.37±0.06 1.42±0.06* 1.49±0.07
Weight (kg) 31.9±7.4† 36.5±7.6† 39.4±8.9 45.3±10.3
BMI (kg/m²) * 18.5±3.3† 19.4±3.3† 19.6±3.4 20.4±3.5
Fat free mass (kg) * 23.9±3.2† 26.5±3.3† 28.8±4.2 33.2±5.6
Fat mass (kg) 8.1±4.9 10.1±5.2* 10.7±5.6 12.1±6.3
Body fat percent (%) 23.5±8.9 26.1±8.4 25.7±8.0 25.6±8.2
FFMI (kg/m²) * 13.9±0.9† 14.1±1.1* 14.3±1.2* 14.9±1.4†
FMI (kg/m²) 4.6±2.7 5.3±2.6† 5.3±2.5 5.5±2.6
BMI, body mass index; FFMI, fat free mass index; FMI, fat mass index.
*p<0.05; †p<0.01 for boys compare to girls.
‡Data are presented as median (range), others data are presented as mean±standard deviation.
Fig. 1. Fat mass index (FMI) versus fat free mass index (FFMI) in girls (A) and boys (B). Solid and dashed lines represent 6th graders and 3rd to 5th graders respectively.
FFMI FFMI
FMI FMI
0 0
2 2
4 4
6 6
8 8
10 10
12 12
14 14
16 16
10 12 14 16 18 20 22 24 26 10 12 14 16 18 20 22 24 26
3rd grader 4th grader 5th grader 6th grader
3rd grader 4th grader 5th grader 6th grader
A B
grade boys (Table 2).
Our results have several limitations. In the result of this research, difference by the grade was marked and as the Ta- ble 1 suggests average grade age rarely goes out the actual school year age. Moreover, in order to find the overall gen- eral differences between children, pubertal stage should be included, however, the present study was limited within a single elementary school.
In summary, this study demonstrates that body composi- tion chart containing FFMI and FMI is appropriate for ex- pressing both aspects of body composition in children. Gen- der difference in the direction of change of FFMI and FMI relationship is evident in children. Thus, the use of this chart should highly be encouraged, and extensive studies to establish gender and age specific cut-off values that are val- id for the health risk-based definitions of pediatric obesity should follow. This task is important not only for the re- search/public health, but also imperative in clinical settings.
ACKNOWLEDGEMENTS
This paper was supported by Konkuk University in 2006.
REFERENCES
1. Obesity: preventing and managing the global epidemic. Report of a WHO consultation. World Health Organ Tech Rep Ser 2000;894:i-xii, 1-253.
2. Park YS, Lee DH, Choi JM, Kang YJ, Kim CH. Trend of obesity in school age children in Seoul over the past 23 years. Korean J Pediatr 2004;47:247-57.
3. Kim HM, Park J, Kim HS, Kim DH, Park SH. Obesity and cardio- vascular risk factors in Korean children and adolescents aged 10- 18 years from the Korean National Health and Nutrition Examina-
gender by FFMI interaction, indicating that the boys gain FFM more rapidly compared to girls during 6th grade peri- od. In subgroup analysis by gender, grade by FFMI interac- tion was significant in boys, indicating that FMI vs. FFMI relationship differed according to the grade of the boys. FFM gain was more accelerated in 6th grade boys, indicating that the magnitude of this gender difference in elementary school children increased with grade.
This study result also showed the limitation of BMI in children, that has already been known,7-9 and the needs for FMI and FFMI chart plotting.
Over the last two decades, the importance of body compo- sition measurement according to nutritional status has in- creasingly been recognized, especially in pediatric age group.15 Tracing body composition in children is not only to detect excessive fatness but also concerns in the acquisition of FFM. FFMI and FMI are used to express both aspects of body composition in common units. It should be kept in mind that the same BMI value can result from various com- binations of FMI and FFMI, and the range of variability in the levels of both FM and FFM is wide in growing chil- dren.12,16 The accuracy of BMI among children varies, de- pending on according to the degree of fatness: BMI fits for relatively heavy weight children (e.g., BMI-for-age≥85th P) but it does not for light weight children.17
Previous studies indicated the importance of FMI and FFMI, however, there was no result on the difference be- tween boys and girls.18,19 FFMI in boys and girls, gender difference and year in year out these were very diverse be- tween childhood and adolescent.20-22
In the present study, we found definite differences in FFMI and FMI relationship between boys and girls as they grew.
We also found the time of change in body composition through slope variation, a marked change occurring in 6th
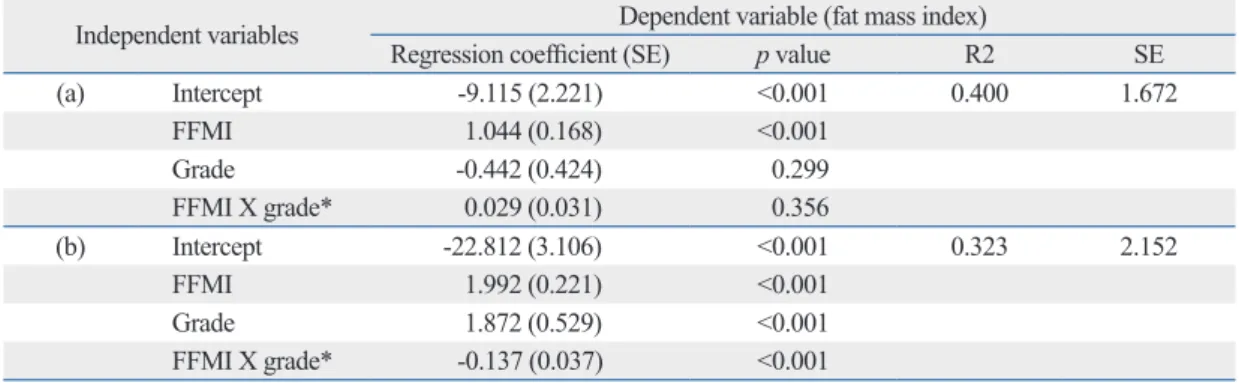
Table 2. Relationship between FMI and FFMI in Girls (a) and Boys (b) by Grade in School Independent variables Dependent variable (fat mass index)
Regression coefficient (SE) p value R2 SE
(a) Intercept -9.115 (2.221) <0.001 0.400 1.672
FFMI 1.044 (0.168) <0.001
Grade -0.442 (0.424) 0.299
FFMI X grade* 0.029 (0.031) 0.356
(b) Intercept -22.812 (3.106) <0.001 0.323 2.152
FFMI 1.992 (0.221) <0.001
Grade 1.872 (0.529) <0.001
FFMI X grade* -0.137 (0.037) <0.001
FFMI, fat free mass index.
*Interaction variable between FFMI and grade.
nese college students. J Anthropol Soc Nippon 1991;99:141-8.
14. Hattori K, Tatsumi N, Tanaka S. Assessment of body composition by using a new chart method. Am J Hum Biol 1997;9:573-8.
15. Demerath EW, Schubert CM, Maynard LM, Sun SS, Chumlea WC, Pickoff A, et al. Do changes in body mass index percentile reflect changes in body composition in children? Data from the Fels Longitudinal Study. Pediatrics 2006;117:e487-95.
16. Maynard LM, Wisemandle W, Roche AF, Chumlea WC, Guo SS, Siervogel RM. Childhood body composition in relation to body mass index. Pediatrics 2001;107:344-50.
17. Freedman DS, Wang J, Maynard LM, Thornton JC, Mei Z, Pier- son RN, et al. Relation of BMI to fat and fat-free mass among children and adolescents. Int J Obes (Lond) 2005;29:1-8.
18. Nakao T, Komiya S. Reference norms for a fat-free mass index and fat mass index in the Japanese child population. J Physiol An- thropol Appl Human Sci 2003;22:293-8.
19. Wells JC. A Hattori chart analysis of body mass index in infants and children. Int J Obes Relat Metab Disord 2000;24:325-9.
20. Buyken AE, Bolzenius K, Karaolis-Danckert N, Günther AL, Kroke A. Body composition trajectories into adolescence according to age at pubertal growth spurt. Am J Hum Biol 2011;23:216-24.
21. Eissa MA, Dai S, Mihalopoulos NL, Day RS, Harrist RB, Lab- arthe DR. Trajectories of fat mass index, fat free-mass index, and waist circumference in children: Project HeartBeat! Am J Prev Med 2009;37:S34-9.
22. Castilho SD, Cocetti M, de Azevedo Barros Filho A. Body mass index and body composition in relation to sexual maturation. J Pe- diatr Endocrinol Metab 2008;21:127-33.
tion Survey, 1998 and 2001. Am J Epidemiol 2006;164:787-93.
4. Poskitt EM. Defining childhood obesity: the relative body mass index (BMI). European Childhood Obesity group. Acta Paediatr 1995;84:961-3.
5. Dietz WH, Robinson TN. Use of the body mass index (BMI) as a measure of overweight in children and adolescents. J Pediatr 1998;132:191-3.
6. Quetelet LAJ. A treatise on man and the development of his facul- ties. In: Comparative statistics in the 19th century. Edinburgh:
William and Robert Chambers; 1842.
7. Gallagher D, Visser M, Sepúlveda D, Pierson RN, Harris T, Heymsfield SB. How useful is body mass index for comparison of body fatness across age, sex, and ethnic groups? Am J Epidemiol 1996;143:228-39.
8. Horlick M. Body mass index in childhood--measuring a moving target. J Clin Endocrinol Metab 2001;86:4059-60.
9. Franklin MF. Comparison of weight and height relations in boys from 4 countries. Am J Clin Nutr 1999;70:157S-62S.
10. VanItallie TB, Yang MU, Heymsfield SB, Funk RC, Boileau RA.
Height-normalized indices of the body’s fat-free mass and fat mass: potentially useful indicators of nutritional status. Am J Clin Nutr 1990;52:953-9.
11. Van Itallie TB, Segal KR. Nutritional assessment of hospital pa- tients: new methods and new opportunities. Am J Hum Biol 1989;1:205-8.
12. Bell W. Fat-free mass and fat mass in active boys during adoles- cence. Am J Hum Biol 1997;9:617-27.
13. Hattori K. Body composition and lean body mass index for Japa-