Cutoff Values of Body Mass Index and Body Fat Measures for Metabolic Syndrome in Korean Population
Hyun Jae Lee, Byoung Gwon Kim
1, Joon Youn Kim
1, Jung Man Kim
1, Byung Chul Yoo
2, Eun Jeong Kim
1,3and Young Seoub Hong
1,3*
Department of Occupational and Environmental Medicine, College of Medicine, Dong-A University, Busan, Korea
1
Department of Preventive Medicine, College of Medicine, Dong-A University, Busan, Korea
2
Department of Preventive Medicine, College of Medicine, Kosin University, Busan, Korea
3
Department of Biochemistry, Medical Research Center for Cancer Molecular Therapy, Busan, Korea
Received October 15, 2009 /Accepted November 19, 2009This study investigated cut-off values of body mass index (BMI) and body fat measures for metabolic syndrome (MS) in elderly Koreas. Questionnaire surveys, anthropometric measurements, medical ex- aminations, and body composition analyses were conducted for 10,077 subjects aged 40-65 years in the health examinee cohort in Korea between 2004 and 2006. Cut-off values were identified using re- ceiver-operating characteristic (ROC) curve analysis for both men and women. Stratified analyses by weight range (<60, 60-69, 70-79, and 80-89, ≥90 kg for men; <50, 50-59, 60-69, 70-79, ≥80 kg for women) were conducted. Among male subjects, the cut-off points were 25.5 kg/m
2for BMI with a sensitivity of 70.0% and a specificity of 72.0%, and 26.1% for body fat percentage with a sensitivity of 60.6% and a specificity of 76.4%. Among female subjects, the cutoff points were 24.1 kg/m
2for BMI with a sensitivity of 73.3% and a specificity of 68.8%, and 31.5% for body fat percentage with a sensi- tivity of 76.7% and a specificity of 65.6%. Stratified analysis by weight range showed that the cutoff points of BMI and body fat measures tended to higher as weight level increased. The results of our study suggest cut-off values of BMI and body fat measure for MS were similar to the general obesity criteria in Korea.
Key words : Metabolic syndrome, body mass index, body fat, cut-off
*Corresponding author
*Tel:+82-51-240-2888, Fax:+82-51-253-5729
*E-mail : [email protected]
Introduction
Metabolic syndrome is a group of diseases including obe- sity, abnormal lipid metabolism, diabetes or glucose intoler- ance, and hypertension. With the common characteristic of insulin resistance, they are closely associated with the occur- rence of cardiovascular diseases [5,8,19]. Third Report of the National Cholesterol Education Program Adults Treatment Panel (NCEP-ATP III) [16] states that in order to treat hyper- lipidemia for the prevention of cardiovascular diseases, the first goal is to lower LDL (Low-density lipoprotein)-cholesterol and the second goal is to treat metabolic syndrome.
Obesity is an independent risk factor of cardiovascular diseases. In particular, abdominal obesity is a component of criteria in diagnosing metabolic syndrome. Obesity is de- fined as a state of excessive body fat, and is diagnosed when body fat percentage is 25% and higher for males and 30%
and higher for females [4]. In practice, BMI is primarily used
to diagnose obesity. But, many studies [6,11,20], have re- vealed that the prevalence of risk factors for cardiovascular diseases increases for Asians who are not categorized as obese on the basis of BMI criteria. One of the methods to analyze body composition, body impedance analysis (BIA), is also a means of diagnosing obesity. It is possible to use BIA to measure fat-free mass and body fat is can be meas- ured by subtracting the fat-free mass from the weight [22].
BIA uses a simple device and quickly produces objective;
hence, it is used in a range of areas. However, it has not been used as a standard measurement of obesity due to con- troversial opinions regarding its clinical significance for body fat measurement.
This study presents cut-offs for the BMI and body compo- sition by BIA according to weight range to identify the meta- bolic syndrome compared with the general obesity criteria in 10,077 subjects aged 40-65 years old using a ROC curve.
The study attempts to contribute to the establishment of clin-
ical indexes for identifying metabolic syndrome for many
Asians, especially Koreans who are not categorized as obese
on the basis of as BMI and body composition criteria having
risk factors of cardiovascular disease.
Materials and Methods Study subjects
Adults aged 40 and older who had health examinations in the 10 hospitals in Korea from 2004 to 2006. A total of 13,910 subjects were recruited into the study after obtaining informed consent. Data that was missing one out of the five diagnostic criteria of metabolic syndrome were excluded and also subjects who have over 65 years old were excluded, leaving the 10,077 subjects that were included in the final analysis. The study design was approved by the committee on human research of the participating hospital.
Questionnaire
Questionnaires included basic demographic character- istics regarding the age, sex, marital status, and educational attainments of the subjects. Marital status was divided into married and not married; and educational attainment was divided according to the level of higher education. A history of alcohol consumption was divided according to current, past, and none. Classification and definition of smokers were
‘non-smokers’ who have never smoked cigarettes, ‘ex-smok- ers’ who smoked sometimes or regularly in the past but no longer smoked at the time of the survey, and ‘current smok- ers’ who smoked sometimes or regularly at the time of survey. In terms of exercise, people were divided into those who exercise regularly and those who do not.
Anthropometric measurement
Height and weight were measured by using a height- weight automatic scale; height was measured in units of 0.1 cm, and weight in units of 0.1 Kg. BMI was calculated by dividing subject’s weight (kg) by the square of their height (m
2).
Waist circumference measurements were made when sub- ject is stood erect with his or her arms on either side with the feet together. A measuring tape was wrapped horizon- tally around the waist, and the narrowest part of the upper body was measured when the subject exhaled while breath- ing normally with no excess pressure on the skin, in units of 0.1 cm. Occasionally in the case of obese subjects whose narrowest part of the waist was difficult to discriminate, the smallest girth was measured between the ribs and the iliac crest. The waist circumferences defining abdominal obesity
were 90 cm for men and 80 cm for women [22].
Clinical examination
Blood pressure was measured twice while a subject sat after a 10-minute rest by a mercury sphygmomanometer (Baumanometer, USA). The appearance of the first sound (phase 1 Korotkoff sound) was used to define systolic pres- sure and the disappearance of sound (phase 5 Korotkoff sound) was used to define diastolic blood pressure. When the two measures differed by more than 5 mmHg, another measurement was taken. Subjects were instructed not to smoke and to limit caffeine intake prior to the measure- ments.
Blood was drawn from a vein after subjects had fasted for more than 12 hours. After centrifugation, triglycerides, HDL (High-density lipoprotein)-cholesterol, and fasting glu- cose were measured by an auto-analyzer (Hitachi 7600-020 auto-analyzer, Japan).
Body composition analysis
Body composition analysis was done with a body compo- sition analyzer (Zeus 9.9, Jawon, Korea) using bioelectrical impedance analysis. Subjects were instructed to urinate prior to the measurements, and body fat weight (kg), body fat percentage (%), visceral fat (kg), and muscle mass (kg) were measured.
Diagnostic criteria of metabolic syndrome
Diagnostic criteria of metabolic syndrome were defined based on NCEP-ATP III. When three out of five items in the diagnostic criteria were positive, metabolic syndrome was diagnosed. The cut-off of waist circumference was based not on NCEP-ATP III which is the western criteria but on that of the WHO Western Pacific Region. Thus when the waist circumference for a man was more than 90 cm and that for a woman was more than 80 cm, subjects were con- sidered abdominally obese.
(a) Abdominal obesity: waist circumference - man ≥90 cm, waist circumference - woman ≥80 cm (b) Triglyceride: ≥150 mg/dl
(c) HDL-cholesterol: men <40 mg/dl, women <50 mg/dl
(d) Blood pressure: systolic ≥130 mmHg or diastolic ≥85 mmHg or anti-hypertensive medication
(e) Fasting glucose: >110 mg/dl
Statistical analysis
The data for this study was analyzed by using the stat- istical software program SPSS Version 12.0. Frequency, mean, and the standard deviation of subjects’ general charac- teristics, lifestyles, and anthropometric measurements were obtained by using descriptive statistics. From the result of the body composition analysis, the mean differences be- tween men and women were analyzed by using the Student's t-test, and the mean differences in the weight of men and women were analyzed by using ANOVA. For all men and women subjects by weight, when the area under the curve on a coordinate with the x-axis as ‘1- specificity' and the y-axis as ‘sensitivity’ was more than 0.5, the results of BMI and body composition analysis were considered to have diagnostic value. Of those with diagnostic value, the points with the largest sum of sensitivity and specificity were identified as cut-off points. Age, sex, height, weight and lifestyle variables that could affect the results of the BMI and body composition were analyzed in terms of their de- gree of contribution through multiple logistic regression analysis.
Results Demographic characteristics
The 10,077 subjects included 2,935 men and 7,142 women.
The mean ages for the men and women were 51.15±6.9 and 49.34±6.3, respectively, and the percentages of married sub- jects were 92.7% for men and 87.4% for women. The percen- tages of men and women who had attained a higher level of education were 38.3% and 20.9%, respectively.
72.1% of male participants and 29.0% of female partic- ipants reported that they consumed alcohol at the time of the study, showing a percentage for men that was 2.5 times that for women. Additionally, 33.6% of men and 2.0% of women were current smokers with the percentage of men nearly 15 times that of women. It was found that similar percentages of men (55.3%) and women (55.4%) exercised regularly (Table 1).
Anthropometric measurement
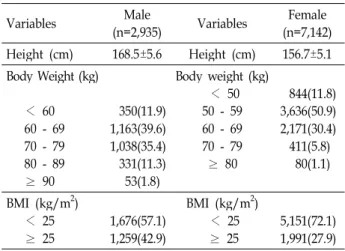
The average height of the male subjects was 168.5±5.6 cm and their distribution by weight was in the order of 39.6%
between 60-69 kg, 35.4% between 70-79 kg. The average height of the women was 156.7±5.1 cm and their distribution by weight was 50.9% between 50-59 kg, 30.4% between 60-69
Table 1. Demographic characteristics of study subjects Variables Male (n=2,935) Female (n=7,142)
Age (years) 51.1±6.9 49.3±6.3
Marital status Married Others Unknown
2,722 195 18
(92.7) (6.7) (0.6)
6,241 859 42
(87.4) (12.0) (0.6) Education
< 12 years
≥ 12 years Unchecked
1,745 1,115 65
(59.5) (38.3) (2.2)
5,495 1,495 152
(77.0) (20.9) (2.1) Alcohol drinking
Current PastNon Unchecked
2,115 281527 12
(72.0) (9.6) (18.0) (0.4)
2,074 4,620289 159
(29.0) (4.1) (64.7) (2.2) Smoking
Current smoker Ex-smoker Non-smoker Unchecked
987 1,146 785 17
(33.6) (39.0) (26.8) (0.6)
144 6,640116 242
(2.0) (1.6) (93.0) (3.4) Exercise, regularly
YesNo Unchecked
1,624 1,288 23
(55.3) (43.9) (0.8)
3,959 3,124 59
(55.4) (43.8) (0.8) (Mean±SD, N (%)) SD: standard deviation; N: numbers
kg. With a cut-off of 25 kg/m
2BMI, prevalence rates of obe- sity were 42.9% for men and 27.9% for women (Table 2)
Prevalence of metabolic syndrome
For both male and female subjects, as their weight in- creased, the prevalence of metabolic syndrome increase sig- nificantly (Table 3).
Table 2. Anthropometric measurements in study subjects (Mean±S.D., N (%))
Variables Male
(n=2,935) Variables Female (n=7,142) Height (cm) 168.5±5.6 Height (cm) 156.7±5.1 Body Weight (kg)
< 60 60 - 69 70 - 79 80 - 89
≥ 90
350 1,163 1,038 33153
(11.9) (39.6) (35.4) (11.3) (1.8)
Body weight (kg) 50 - 59< 50 60 - 69 70 - 79
≥ 80
3,636844 2,171 411 80
(11.8) (50.9) (30.4) (5.8) (1.1) BMI (kg/m2)
< 25
≥ 25 1,676
1,259(57.1) (42.9)
BMI (kg/m2)
< 25
≥ 25 5,151
1,991(72.1) (27.9)
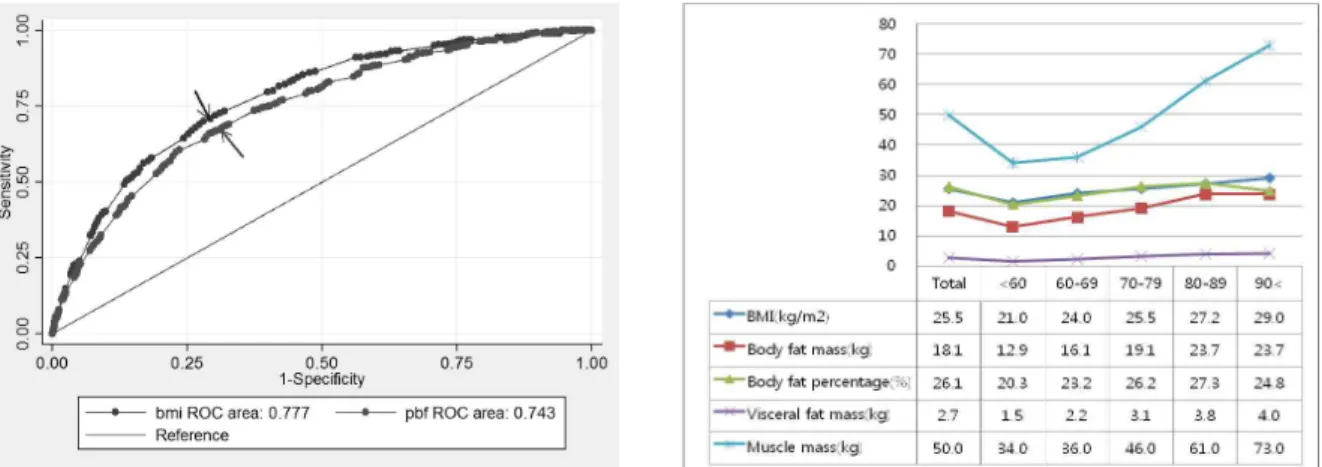
Fig. 1. ROC curve of metabolic syndrome in men: The arrow shows the obtained body mass index and body fat percentage corre- sponding to the highest sensitivity and specificity values. The cut-off point for the body composition analysis and body mass index that have diagnostic value in men's metabolic syndrome according to body weight is shown.
Table 3. Prevalence of metabolic syndrome in study subjects according to body weight (kg) by sex
Variables N (%)
Male* (n=2,935)
< 60 60 - 69 70 - 79 80 - 89
≥ 90total
17 113284 153 60942
(4.9%) (9.7%) (27.4%) (46.2%) (79.3%) (20.8%) Female* (n=7,141)
< 5050 - 59 60 - 69 70 - 79
≥ 80 total
34117 526156 47 1,087
(2.0%) (9.4%) (24.2%) (38.0%) (58.8%) (15.2%)
*:
p
<0.05Validity of body composition analysis and BMI in diagnosis of metabolic syndrome
When obesity was diagnosed with the western criteria of body fat percentage, the percentages of men and women were 44.9% and 57.2%, respectively.
For the male subjects, the areas under the ROC curves of the BMI and body fat percentage for metabolic syndrome were 0.78 and 0.74, respectively. The cut-off point of BMI with the largest sum of sensitivity and specificity was 25.5 kg/m
2with sensitivity of 70.0% and specificity of 72.0% sim- ilar to the obesity criteria. The cut-off point of body fat per- centage was 26.1% with sensitivity of 60.6% and specificity of 76.4% similar to the general obesity criteria. When they were analyzed by weight groups, it was found that the crit-
ical points of the body composition analysis and BMI in- creased as the weight increased. The BMI and body fat per- centage of the 70-79 kg group was 25.5 kg/m
2and 26.2%, which is similar to the general obesity criteria (Fig. 1).
For the female subjects, the areas below the ROC curves of the BMI and body fat percentage for metabolic syndrome were 0.77 and 0.77, respectively, with diagnostic values in the order of BMI and body fat percentage. The critical point of BMI with the largest sum of sensitivity and specificity was 24.1 kg/m
2with sensitivity of 73.3% and specificity of 68.8% similar to the general obesity criteria. The critical point of body fat percentage was 31.5% with sensitivity of 76.7%
and specificity of 65.6% similar to the general obesity criteria. When they were analyzed by weight groups, it was found that the critical points of the body fat percentage and BMI increased as the weight increased. The BMI values and body fat percentages of the 60-69 kg groups were 25.6 kg/m
2and 31.5% respectively, which is similar to the general obe- sity criteria (Fig. 2).
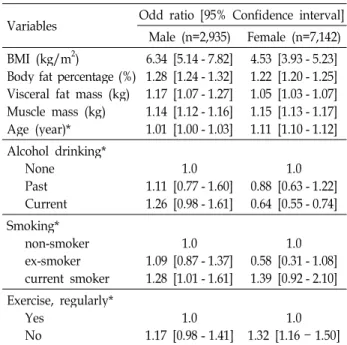
After adjusting all variables including sex, age and life- style variables including alcohol consumption, smoking, and regular exercise, multivariate logistic regression analysis was performed with metabolic syndrome as a dependent variable. The results showed that as the body fat percentage, muscle mass, and BMI increase, the risk of metabolic syn- drome increase significantly (Table 4).
Discussion
BMI is widely accepted as it is easy to measure and it
has a high correlation with risk factors of cardiovascular
Fig. 2. ROC curve of metabolic syndrome in women: The arrow shows the obtained body mass index and body fat percentage corresponding to the highest sensitivity and specificity cut-off point for the body composition analysis and body mass index that have diagnostic value in women's metabolic syndrome according to body weight is shown.
Table 4. Multivariate logistic analysis of body composition to metabolic syndrome after adjusting for sex, age and life habit factors
Variables Odd ratio [95% Confidence interval]
Male (n=2,935) Female (n=7,142) BMI (kg/m2)
Body fat percentage (%) Visceral fat mass (kg) Muscle mass (kg) Age (year)*
6.34 [5.14 - 7.82]
1.28 [1.24 - 1.32]
1.17 [1.07 - 1.27]
1.14 [1.12 - 1.16]
1.01 [1.00 - 1.03]
4.53 [3.93 - 5.23]
1.22 [1.20 - 1.25]
1.05 [1.03 - 1.07]
1.15 [1.13 - 1.17]
1.11 [1.10 - 1.12]
Alcohol drinking*
None PastCurrent
1.0 1.11 [0.77 - 1.60]
1.26 [0.98 - 1.61]
1.0 0.88 [0.63 - 1.22]
0.64 [0.55 - 0.74]
Smoking*
non-smoker ex-smoker current smoker
1.09 [0.87 - 1.37]1.0 1.28 [1.01 - 1.61]
0.58 [0.31 - 1.08]1.0 1.39 [0.92 - 2.10]
Exercise, regularly*
YesNo 1.0
1.17 [0.98 - 1.41] 1.0 1.32 [1.16 - 1.50]
BMI: Body mass index; * resulted by simple logistic regression
diseases. According to the WHO Western Pacific Region cri- teria which was based for Asians, a person with a BMI of over 23 and less 25 kg/m
2is considered as overweight and someone with a BMI of 25 kg/m
2or higher is considered as obese; this diagnostic criteria of obesity is used in Korea as well.
Body fat can cause an increase of total cholesterol, trigly- cerides, and LDL-cholesterol, increasing the risk of car- diovascular diseases. It is necessary to directly measure body fat in order to assess and treat obesity more accurately. BIA,
which is used in this study, has advantages in that it is sim- ple to obtain by measurements and is relatively inexpensive.
Thus, it is popular in practice. Moreover, it has a high corre- lation with Dual Energy X-ray Absorptiometry (DXA) that is a well-known standard method of body fat measurement and is considered a tool that can measure body fat percent- age relatively accurately [10]. In Korea, the use of a body composition analyzer using BIA has been increased, but the criteria of obesity suggested by western research [2,7] - 25%
for men and 30% for women - are applied with adjustments.
Unlike the diagnoses based on BMI, this result based on body fat percentage showed more women who were obese than men; while the number of men slightly declined, the number of women doubled.
Diagnostic criteria of metabolic syndrome which are cur- rently used have been suggested by the WHO, the European Group for Study of Insulin Resistance (EGIR), the American Association of Clinical Endocrinologists and NCEP-ATP III.
Of these many diagnostic criteria, the WHO and the NCEP-ATP III criteria are well known; but due to its con- venience, the NCEP-ATP III criteria were used in this study.
It was reported that Asians in general can have relatively
more severe visceral obesity when they have the same waist
circumference as Westerners [1,21]; thus, the waist circum-
ference cut-offs of the NCEP-ATP III diagnostic criteria for
abdominal obesity - 102 cm for men and 90 cm for women
- were considered inappropriate for Asians. Thus, since 2001,
it has been recommended that the waist circumference
cut-offs for abdominal obesity for Asians recommended by
the WHO Western Pacific Region should be used - 90 cm
for men and 80 cm for women. Therefore, the NCEP-ATP
III criteria revised by the WHO Western Pacific Region were used for the criteria of abdominal obesity in this study.
When the criteria of obesity reflects metabolic syndrome which is a risk factor of cardiovascular diseases, an obe- sity-related diseases, obesity diagnoses based on general obesity criteria of BMI and body fat percentage do not reflect the result of this study that found that the prevalence of metabolic syndrome was 20.8% for men and 15.2% for wom- en; the actual danger of cardiovascular diseases is not reflected. Therefore, in this study, validity was analyzed for the diagnosis of metabolic syndrome, which is a main risk factor of cardiovascular diseases, on the basis of a BMI and body composition analysis including age, sex, and weight.
By identifying cut-off points, the results of BMI and body composition analysis may reflect the real risk of car- diovascular diseases.
In this study, in identifying metabolic syndrome for all study subjects, cut-off points of BMI were 25.5 kg/m
2for men and 24.1 kg/m
2for women, showing a similar trend with the general obesity criteria, at 25 kg/m
2. The cut-offs of BMI for men and women were increased according to weight range. The general obesity criteria for BMI of 25 kg/m
2are similar to the cut-off point of the 70-79 kg group for men and the 60-69 kg group for women. For lighter in- dividuals, BMI should be more strictly applied than the gen- eral obesity criteria when diagnosing metabolic syndrome.
For heavier individuals, it may be applied with more flexibility.
Nagaya et al. [14], reported that compared to BMI, body fat percentage measures using BIA has higher correlations with total cholesterol, triglyceride, and LDL-cholesterol levels. A study by Ito et al. [9], and Nakanishi et al. [15], on the Japanese population showed a significant relationship between body fat percentage and risk factors of car- diovascular diseases. Among male research subjects, body fat percentage had diagnostic values for metabolic syndrome in all weight groups. For all study subjects, men and women showed the cut-off points for metabolic syndrome diagnosis similar to the body fat percentile of the general obesity criteria. For men and women who weigh less than 70 kg and 50 kg, respectively, body fat percentage should be more strictly applied in the identification of metabolic syndrome, while for those who are heavier it can be applied with more flexibility.
Unlike men, women showed body fat percentages exceed- ing the obesity criteria in the weight group with BMI lower
than the obesity criteria. This demonstrates that in the diag- nosis of metabolic syndrome for women, body fat percent- age may be a more valid indicator than BMI. This can assist with understanding why there are a large number of meta- bolic syndrome patients who are not obese. The reasons why men, unlike women, have a lower critical point than those with lower weight are that estimated formulas of BIA over- estimate the fat-free mass of obese populations, decreasing the accuracy of the body fat percentage measurements [13,17]. Another reason is that there were lesser subjects in the higher weight than in the lower weight group.
In particular Asians with the same degree of obesity have more accumulated visceral fat [12]. Unlike subcutaneous fat tissue, visceral fat can be easily disintegrated, increasing the concentration of free fatty acid in the hepatic portal system, which decreases insulin sensitivity in the liver. In addition to the decline in the insulin removal rate, the synthesis and secretion of glucose and triglyceride, and the use of glucose by skeletal muscle is decrease, leading to insulin resistance [3,18]. In this study, visceral fat has diagnostic value in all weight groups for men. This study shows that visceral fat in a lower weight group for women rather than men can reflect the risk of cardiovascular diseases, and through a fol- low-up observation, this can serve as a clue in the diagnosis of metabolic syndrome among women who appear to be thin. Visceral fat was found to have diagnostic values in all weight groups for both men and women; consequently, it is assumed to be the most useful criterion for body composi- tion analyses when diagnosing metabolic syndrome. It is necessary to confirm the validity by comparing the results from the BIA and CT and MRI findings. Muscle mass had diagnostic value only for women with weights of 80 kg or more; however, considering the fact that the number of sub- jects in this group was smaller than that of the other weight groups, it is necessary to confirm its clinical usefulness through a study with more subjects.
The limitations of this study are as follows: First, it is diffi-
cult to generalize the findings of the higher weight groups
for both men and women due to the relatively small number
of research subjects; Second, although the revised
NCEP-ATP III criteria used here as the diagnostic criteria
of metabolic syndrome is the most commonly used diag-
nostic criteria, using other criteria of metabolic syndrome
may produce different results. Finally, body composition
analysis cannot be conducted with greater precision by
means of CT. These limitations should be assessed and ad-
dressed in future studies.
References
1. Deurenberg, P., M. Deurenberg-Yap, and S. Guricci. 2002.
Asians are different from Caucasians and from each other in their body mass index/body fat per cent relationship.
Obes. Rev
. 3, 141-146.2. Deurenberg, P., M. Yap, and W. A. Van Staveren. 1998.
Body mass index and percent body fat: a meta analysis among different ethnic groups.
Int. J. Obes. Relat. Metab.
Disord
. 22, 1164-1171.3. Ferrannini, E., E. J. Barrett, S. Bevilacqua, and R. A.
DeFronzo. 1983. Effect of fatty acids on glucose production and utilization in man.
J. Clin. Invest
. 72, 1737-1747.4. Gray, D. S. 1989. Diagnosis and prevalence of obesity.
Med.
Clin. North Am
. 73, 1-13.5. Hedblad, B., P. Nilsson, G. Engstrom, G. Berglund, and L.
Janzon. 2002. Insulin resistance in non-diabetic subjects is associated with increased incidence of myocardial infarction and death.
Diabet. Med
. 19, 470-475.6. Hoffer, E. C., C. K. Meador, and D. C. Simpson. 1969.
Correlation of whole-body impedance with total body wa- ter volume.
J. Appl. Physiol
. 27, 531-534.7. Hortobagyi, T., R. G. Israel, and K. F. O'Brien. 1994.
Sensitivity and specificity of the Quetelet index to assess obesity in men and women.
Eur. J. Clin. Nutr
. 48, 369-375.8. Isomaa, B., P. Almgren, T. Tuomi, B. Forsén, K. Lahti, M.
Nissén, M. R. Taskinen, and L. Groop. 2001. Cardiovascular morbidity and mortality associated with the metabolic syndrome.
Diabetes Care
. 24, 683-689.9. Ito, H., K. Nakasuga, A. Ohshima, T. Maruyama, Y. Kaji, M. Harada, M. Fukunaga, S. Jingu, and M. Sakamoto. 2003.
Detection of cardiovascular risk factors by indices of obesity obtained from anthropometry and dual-energy X-ray ab- sorptiometry in Japanese individuals.
Int. J. Obes. Relat.
Metab. Disord
27, 232-237.10. Kushner, R. F., R. Gudivaka, and D. A. Schoeller. 1996.
Clinical characteristics influencing bioelectrical impedance analysis measurements.
Am. J. Clin. Nutr
. 64, 423S-427S.11. Lee, W. Y., J. S. Park, S. Y. Noh, E. J. Rhee, S. W. Kim, and P. Z. Zimmet. 2004. Prevalence of the metabolic syn- drome among 40,698 Korean metropolitan subjects.
Diabetes Res. Clin. Pract
. 65, 143-149.12. McKeigue, P. M., B. Shah, and M. G. Marmot. 1991. Relation of central obesity and insulin resistance with high diabetes
prevalence and cardiovascular risk in South Asians.
Lancet
. 337, 382-386.13. McNeill, G., P. A. Fowler, R. J. Maughan, B. A. McGaw, M. F. Fuller, D. Gvozdanovic, and S. Gvozdanovic. 1991.
Body fat in lean and overweight women estimated by six methods.
Br. J. Nutr
. 65, 95-103.14. Nagaya, T., H. Yoshida, H. Takahashi, Y. Matsuda, and M.
Kawai. 1999. Body mass index (weight/height2) or percent- age body fat by bioelectrical impedance analysis: which var- iable better reflects serum lipid profile?.
Int. J. Obes. Relat.
Metab. Disord
23, 771-774.15. Nakanishi, N., K. Nakamura, K. Suzuki, Y. Matsuo, and K.
Tatara. 2000. Associations of body mass index and percent- age body fat by bioelectrical impedance analysis with car- diovascular risk factors in Japanese male office workers
. Ind.
Health
. 38, 273-279.16. National Cholesterol Education Program (NCEP) Expert Panel on Detection Evaluation, and Treatment of High Blood Cholesterol in Adults (Adult Treatment Panel III).
2002. Third report of the national cholesterol education pro- gram (NCEP) expert panel on detection, e evaluation, and treatment of high blood cholesterol in adults (Adult Treatment Panel III) final report.
Circulation
106, 3143-3421.17. Segal, K. R., M. Van Loan, P. I. Fitzgerald, J. A. Hodgdon, and T. B. Van Itallie. 1988. Lean body mass estimation by bioelectrical impedance analysis: a four-site cross-validation study.
Am. J. Clin. Nutr
. 47, 7-14.18. Svedberg, J., P. Bjorntorp, U. Smith, and P. Lonnroth. 1990.
Free-fatty acid inhibition of insulin binding, degradation, and action in isolated rat hepatocytes.
Diabetes
39, 570-574.19. Trevisan, M., J. Liu, F. B. Bahsas, and A. Menotti. 1998.
Syndrome X and mortality: a population-based study. Risk Factor and Life Expectancy Research Group.
Am. J.
Epidemiol
. 148, 958-966.20. Vikram, N. K., R. M. Pandey, A. Misra, R. Sharma, J. R.
Devi, and N. Khanna. 2003. Non-obese (body mass index
< 25 kg/m2) Asian Indians with normal waist circum- ference have high cardiovascular risk.
Nutrition
19, 503-509.21. Wang, J., J. C. Thornton, M. Russell, S. Burastero, S.
Heymsfield, and R. N. Jr. Pierson. 1994. Asians have lower body mass index (BMI) but higher percent body fat than do whites: comparisons of anthropometric measurements.
Am. J. Clin. Nutr
. 60, 23-28.22. Wellens, R. I., A. F. Roche, H. J. Khamis, A. S. Jackson, M.
L. Pollock, and R. M. Siervogel. 1996. Relationships between the Body Mass Index and body composition.
Obes Res
. 4, 35-44.초록:한국인에서 대사증후군의 선별검사로서 체성분 분석 및 체질량지수의 타당성연구 이현재․김병권
1․김준연
1․김정만
1․유병철
2․김은정
1,3․홍영습
1,3*
(동아대학교 의료원 산업의학과,
1동아대학교 의과대학 예방의학교실,
2고신대학교 의과대학 예방의학교실,
3