Estimating Negative Effect of Abdominal Obesity on Mildly Decreased Kidney Function Using a Novel Index of Body-Fat Distribution
Abdominal obesity is a major risk factor of chronic kidney disease (CKD). Conventional obesity-related indicators, included body mass index (BMI), waist circumference (WC), and conicity index (C-index), have some limitations. We examined the usefulness of trunk/body fat mass ratio (T/Br) to predict negative effect of abnormal fat distribution on excretory kidney function. We analyzed anthropometric, biochemical and densitometric data from a nation-wide, population-based, case-control study (the Korean National Health and Nutrition Examination Survey [KNHANES] IV and V). A total of 11,319 participants were divided into 2 groups according to estimated glomerular filtration rate (eGFR,
mL·min-1·1.73 m-2) as follows: Group I (n = 7,980), eGFR ≥ 90 and ≤ 120; and group II (n = 3,339), eGFR ≥ 60 and < 90. Linear regression analysis revealed that T/Br was closely related to eGFR (β = −0.3173, P < 0.001), and the correlation remained significant after adjustment for age, gender, BMI, WC, C-index, systolic blood pressure (BP), hemoglobin, and smoking amount (β = −0.0987, P < 0.001). Logistic regression analysis showed that T/
Br (odds ratio [OR] = 1.046; 95% confidence interval [CI] = 1.039–1.054) was significantly associated with early decline of kidney function, and adjustment for age, gender, BMI, C-index, systolic BP, hemoglobin, serum glucose level, high-density lipoprotein (HDL)- cholesterol, and smoking amount did not reduce the association (OR = 1.020; 95%
CI = 1.007–1.033). T/Br is useful in estimating the negative impact of abdominal obesity on the kidney function.
Keywords: Abdominal Obesity; Densitometry; Trunk/Body Fat Mass Ratio; Glomerular Filtration Rate
Il Hwan Oh,1* Jong Wook Choi,2* Chang Hwa Lee,2 and Joon-Sung Park2
1Department of Nephrology, Hanmaeum Changwon Hospital, Changwon, Korea; 2Department of Internal Medicine, Hanyang University College of Medicine, Seoul, Korea
* Il Hwan Oh and Jong Wook Choi contributed equally to this work.
Received: 4 December 2016 Accepted: 20 January 2017 Address for Correspondence:
Joon-Sung Park, MD
Department of Internal Medicine, Hanyang University College of Medicine, 222-1 Wangsimni-ro, Seongdong-gu, Seoul 04763, Korea
E-mail: [email protected]
https://doi.org/10.3346/jkms.2017.32.4.613 • J Korean Med Sci 2017; 32: 613-620
INTRODUCTION
Chronic kidney disease (CKD) is widely recognized as an inde- pendent risk factor for cardiovascular morbidity and mortality (1-3). Early detection, prevention, and management of CKD are an important health issues facing Korea today. In addition, pre- vious epidemiological studies have shown that mildly decreased kidney function, even above the diagnostic threshold of CKD, is strongly associated with increased cardiovascular risk (4-6). Thus, it is important to be able to detect a modifiable risk factor for decline of kidney function at an early stage before kidney dam- age.
Obesity is a leading cause of CKD above and beyond chronic diseases such as hypertension, diabetes, and dyslipidemia (7,8).
Traditionally, altered renal hemodynamics causing glomerular hyperfiltration and activating the renin-angiotensin system in obese patients have been associated with renal impairment (9).
Recently, clinical and experimental researches have shown that abdominal fat accumulation may lead to chronic low-grade sys-
temic inflammation, insulin resistance, dyslipidemia, and/or increased synthesis of vasoactive and fibrogenic substances, and these changes may have a negative influence on kidney cells, and cause pathologic changes (9,10). Conceivably, these metabolic effects on kidney could continue to the general heal- thy population (8).
Body mass index (BMI) is most widely used as an anthropo- metric measure of obesity (11). However, it is not a reliable in- dicator of central obesity because it tends to overrate obesity in adults with a large amount of muscle mass (12). Waist circum- ference (WC) is also generally accepted as a barometer of cen- tral obesity (11), and it may be better predictor of abdominal visceral fat than BMI. However, it has great inter-ethnic variabil- ity (13,14). In addition, BMI and WC frequently yield similar re- sults in previous epidemiologic studies (14). Other indicators, such as conicity index (C-index), have been developed to more clearly represent the fat distribution associated with abdominal obesity (14). Because the formula for calculating the C-index is complex and it is hard to get the exact answer even with a cal- ORIGINAL ARTICLE
Nephrology
culator, its utility in the clinic is limited.
Dual-energy X-ray absorptiometry (DXA) is widely used to obtain more accurate data on human body composition. A pre- vious study reported that fat distribution measured by DXA was more closely related to metabolic abnormality (15). However, some authors have argued that anthropometry is superior to direct body fat measures for predicting metabolic risks (16). Thus there is no clear consensus on which indicator should be used to estimate metabolic risk, especially that involving renal impair- ment (14). Therefore, we made a simple equation to estimate relative visceral fat composition and compared the ability of BMI, WC, C-index, and trunk/body fat mass ratio (T/Br) from DXA to estimate the effect of abdominal fat on mildly decreased kidney function in the healthy population.
MATERIALS AND METHODS Study population
The data were collected from public use data sets of the Korean National Health and Nutrition Examination Survey (KNHANES) IV and V conducted by the Korean Centers for Disease Control and Prevention (KCDC) among non-institutionalized Korean civilians between 2008 and 2011. KNHANES was a cross-sec- tional and national representative survey with a multistage and
stratified sample design. The voluntary participants provided written informed consent prior to their enrollment. Their records, except for survey date, were anonymized prior to analysis.
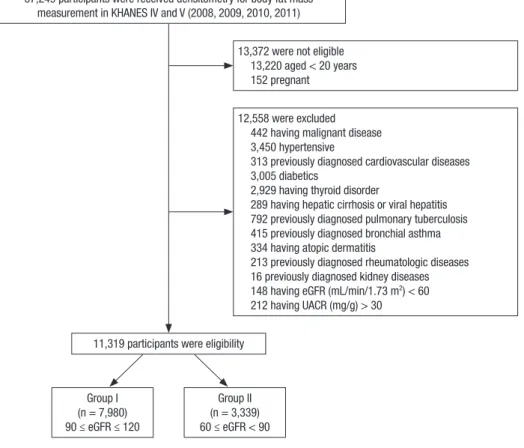
A total of 37,249 individuals participated in the KNHANES 2008–2011. Exclusion criteria for this study included: partici- pants for whom data were lacking (anthropometric or labora- tory data), those under 20 years of age, pregnant women, those with any medical problems, and presence of CKD with estimat- ed glomerular filtration rate (eGFR, mL·min-1·1.73 m-2) below 60 or urine albumin-to-creatinine ratio (UACR, mg/g) above 30. The total number of eligible participants was 11,319 (Fig. 1).
Anthropometric measurements
Anthropometric measurements were made by well-trained ex- aminers. Height was measured to the nearest 0.1 cm using a portable stadiometer (Seriter, Bismarck, ND, USA). BMI (kg/
m2) was determined using weight and height measurements taken in light clothing without shoes and was rounded to the nearest tenth. Systolic and diastolic blood pressures (BPs) were measured 3 times using a mercury sphygmomanometer (Bau- manometer; Baum, Copiague, NY, USA) in the sitting position after at least 5 minutes rest. Average values of the 3 recorded systolic and diastolic BPs was used in the measurements. WC (cm) was measured with flexible tape at the narrowest point
Fig. 1. Flow chart of the study group enrollment process.
KNHANES = the Korean National Health and Nutritional Examination Survey, eGFR = estimated glomerular filtration rate, UACR = urine albumin-to-creatinine ratio.
37,249 participants were received densitometry for body fat mass measurement in KHANES IV and V (2008, 2009, 2010, 2011)
13,372 were not eligible 13,220 aged < 20 years 152 pregnant
12,558 were excluded 442 having malignant disease 3,450 hypertensive
313 previously diagnosed cardiovascular diseases 3,005 diabetics
2,929 having thyroid disorder
289 having hepatic cirrhosis or viral hepatitis 792 previously diagnosed pulmonary tuberculosis 415 previously diagnosed bronchial asthma 334 having atopic dermatitis
213 previously diagnosed rheumatologic diseases 16 previously diagnosed kidney diseases 148 having eGFR (mL/min/1.73 m2) < 60 212 having UACR (mg/g) > 30 11,319 participants were eligibility
Group I (n = 7,980) 90 ≤ eGFR ≤ 120
Group II (n = 3,339) 60 ≤ eGFR < 90
Oh IH, et al. • Abdominal Obesity and Kidney Function
between the lowest border of the rib cage and the uppermost lateral border of the iliac crest, at the end of normal expiration.
C-index was calculated using WC (m), weight (kg), and height (m) from the formula (17):
C-index = WC/(0.109 × √ weight/height)
Biochemical assessment
Blood samples were drawn from all subjects after a minimum fast of 8 hours. Fasting plasma concentrations of glucose and li- poproteins were measured by enzymatic methods with a Hita- chi Automatic Analyzer 7600 (Hitachi, Tokyo, Japan) in a central laboratory. Urinary albumin was measured on spot urine by the immunoturbidimetric method and urinary creatinine by the colorimetric method, to obtain UACR. The level of 25-hy- droxyvitamin D3 was determined with a radiommunoassay kit (Diasorin, Stillwater, MN, USA), and hemoglobin A1c was mea- sured with an HLC-723G7 (Tosoh, Tokyo, Japan). Kidney func- tion was estimated using the Chronic Kidney Disease Epidemi- ology Collaboration (CKD-EPI) equation (18).
DXA scanning
All DXA measurements were obtained with a Discovery-W fan- beam densitometer (Hologic, Inc., Bedford, MA, USA). This mea- sures total fat mass in grams and as a percentage of body mass;
the latter is calculated as:
Fat mass/(Fat mass + Lean tissue mass + Bone mineral content)
× 100
The trunk region consists of the area bordered by a horizon- tal line below the chin, vertical borders lateral to the ribs, and oblique lines passing through the femoral necks. The leg region included all tissues below these oblique lines. Measurement of lean body mass (LBM) excluded fat and bone mineral content (19).
Definitions of main factor and outcome
We measured relative body fat composition in the trunk by DXA calculated using percentage of fat mass from the equation:
T/Br (%) = Fat mass in trunk/Fat mass in whole body except head × 100
In this cross-sectional study, we defined eGFR ≥ 60 and < 90 as mildly decreased kidney function and eGFR ≥ 90 and ≤ 120 as normal kidney function, respectively.
Statistical analysis
All data, including socio-demographic data, medical conditions, anthropometric and clinical measurements, and laboratory re- sults, are presented as means ± standard error or frequencies (and proportions). Data were analyzed using sampling weights to account for multistage and stratified sampling. The general- ized linear model was used to compare quantitative variables and Pearson’s χ2 test was used to compare proportions for cate-
gorical variables. Odds ratios (ORs) with 95% confidence inter- vals (95% CIs) were calculated in logistic regression models ac- cording to risk of mildly decreased kidney function. Receiver operating characteristic (ROC) curves were used to compare the ability of risk factors to discriminate between the patients who developed mildly decreased kidney function and those who did not. Nonparametric methods were used to compare areas under the ROC curves (AUCs). Two-tailed P < 0.05 was considered statistically significant. All statistical analyses were performed using Statistical Analysis Software (SPSS ver. 9.3; SAS Institute Inc., Cary, NC, USA).
Ethics statement
This study was reviewed and approved by the Institutional Re- view Board (IRB) of Korean Center for Disease Control (IRB No.:
2008-04EXP-01-C, 2009-01CON-03-2C, 2010-02CON-21-C, and 2011-02CON-06-C). Informed consent was submitted by all sub- jects when they were enrolled.
RESULTS
Baseline characteristics of participants
Overall, the 11,319 participants were divided into 2 groups ac- cording to eGFR: group I (n = 7,980), eGFR ≥ 90 and ≤ 120; and group II (n = 3,339), eGFR ≥ 60 and < 90. Group II had higher BMI (23.2 ± 0.1 vs. 23.6 ± 0.1 kg/m2, P < 0.001), WC (79.2 ± 0.2 vs. 81.5 ± 0.2 cm, P < 0.001), C-index (1.173 ± 0.002 vs. 1.199 ± 0.002 m1½·kg-½, P < 0.001), LBM (44.1% ± 0.2% vs. 45.4% ± 0.3%, P < 0.001), and T/Br (100.4% ± 0.2% vs. 105.1% ± 0.3%, P < 0.001) than group I. Other anthropometric, clinical, and biochemical characteristics of the participants are summarized in Table 1.
Linear regression analysis
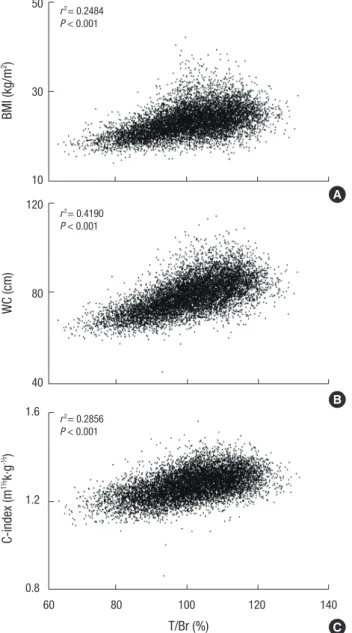
As shown in Fig. 2, scatter plots of T/Br vs. conventional anthro- pometric indices of obesity point to positive correlations between them. Furthermore, linear regression analysis revealed that T/
Br was closely related to eGFR (β = −0.3173, P < 0.001), and this relationship remained significant after adjustment for age, gen- der, systolic BP, BMI, WC, C-index, hemoglobin, and smoking amount (β = −0.0962, P < 0.001; Table 2).
Logistic regression models
When group II was compared to group I, the crude OR of T/Br for mildly decreased kidney function was 1.046 (95% CI = 1.039 –1.053; Table 3). Adjustment for age, gender, systolic BP, BMI, C-index, hemoglobin, glucose, high-density lipoprotein (HDL)- cholesterol, and smoking amount did not attenuate this associ- ation (adjusted OR = 1.020; 95% CI = 1.007–1.033), and it indi- cates that higher T/Br is significantly associated with early de- cline of kidney function. LBM was related to early decline of kidney function in the logistic regression model I (adjusted OR
Oh IH, et al. • Abdominal Obesity and Kidney Function
Table 1. Baseline characteristics according to eGFR*
Variables Group I
(90 ≤ eGFR ≤ 120) Group II (60 ≤ eGFR < 90) P
No. of participants 7,980 3,339
Age, yr 38.4 ± 0.2 49.6 ± 0.4 < 0.001
Gender (male, %) 3,253 (41) 1,782 (53) < 0.001 Systolic BP, mmHg 112.9 ± 0.2 117.3 ± 0.4 < 0.001 Diastolic BP, mmHg 75.3 ± 0.2 77.5 ± 0.2 < 0.001
BMI, kg/m2 23.2 ± 0.1 23.6 ± 0.1 < 0.001
WC, cm 79.2 ± 0.2 81.5 ± 0.2 < 0.001
C-Index, m1½·kg-½ 1.173 ± 0.002 1.199 ± 0.002 < 0.001 eGFR, mL/min/1.73 m2 104.7 ± 0.1 81.2 ± 0.1 < 0.001 Hemoglobin, g/dL 14.16 ± 0.02 14.46 ± 0.03 < 0.001 Hemoglobin A1c, % 5.46 ± 0.01 5.55 ± 0.01 < 0.001 Triglyceride, mg/dL 124.3 ± 1.5 146.4 ± 3.4 < 0.001 HDL-cholesterol, mg/dL 53.2 ± 0.2 50.1 ± 0.4 < 0.001 LDL-cholesterol, mg/dL 111.3 ± 0.8 119.9 ± 1.5 < 0.001 25-hydroxy vitamin D, ng/mL 17.6 ± 0.2 18.8 ± 0.2 < 0.001 Intact PTH, pg/mL 63.3 ± 0.8 66.2 ± 0.8 < 0.001
UACR, mg/g 3.3 ± 0.1 3.2 ± 0.2 0.557
Smoking amount†, pack-year 5.5 ± 0.1 9.6 ± 0.4 < 0.001
LBM, kg 44.1 ± 0.2 45.4 ± 0.3 < 0.001
T/Br‡, % 100.4 ± 0.2 105.1 ± 0.3 < 0.001
eGFR = estimated glomerular filtration rate, BP = blood pressure, BMI = body mass index, WC = waist circumference, C-index = conicity index, HDL = high-density lipo- protein, LDL = low-density lipoprotein, PTH = parathyroid hormone, UACR = urine albumin-to-creatinine ratio, LBM = lean body mass, T/Br = trunk/body fat mass rate.
*Kidney function was estimated using the Chronic Kidney Disease Epidemiology Col- laboration equation; †Includes ex-smokers and current smokers; ‡T/Br was calculated by the equation: T/Br (%) = percentage of fat mass in trunk/percentage of fat mass in whole body except head × 100.
Fig. 2. Scatter plots with trending lines showing the correlation between BMI, WC, C- index, and T/Br. T/Br has positive correlation with conventional anthropometric indices of central obesity.
BMI = body mass index, WC = waist circumference, C-index = conicity index, T/Br = trunk/body fat mass ratio.
Fig 2.
50
30
10 BMI (kg/m2)
(A)
(B)
(C)
WC (cm)
120
80
40
C-index (m1½k·g-½)
T/Br (%) 1.6
1.2
0.8
60 80 100 120 140 r2 = 0.2856
P < 0.0001 r2 = 0.4190 P < 0.0001 r2 = 0.2484 P < 0.0001
BMI (kg/m2 ) 50
30
10
r2= 0.2484 P < 0.001
Fig 2.
50
30
10 BMI (kg/m2)
(A)
(B)
(C)
WC (cm)
120
80
40
C-index (m1½k·g-½)
T/Br (%) 1.6
1.2
0.8
60 80 100 120 140 r2 = 0.2856
P < 0.0001 r2 = 0.4190 P < 0.0001 r2 = 0.2484 P < 0.0001
WC (cm)
120
80
40
r2= 0.4190 P < 0.001 50
30
10 BMI (kg/m2)
(A)
(B)
(C)
WC (cm)
120
80
40
C-index (m1½k·g-½)
T/Br (%) 1.6
1.2
0.8
60 80 100 120 140 r2 = 0.2856
P < 0.0001 r2 = 0.4190 P < 0.0001 r2 = 0.2484 P < 0.0001
T/Br (%)
60 80 100 120 140 C-index (m1½ k·g-½ )
1.6
1.2
0.8
r2= 0.2856 P < 0.001
A
B
C
= 1.044; 95% CI = 1.021–1.067), but further adjustment for C-in- dex and marital state diminished the relationship.
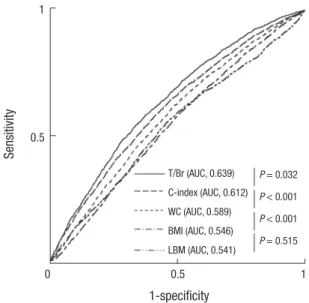
To obtain an additional measure of the predictive values of the risk factors, we created ROC curves and compared AUCs.
This showed that T/Br (AUC = 0.639; 95% CI = 0.624–0.653), C- index (AUC = 0.612; 95% CI = 0.607–0.636), and WC (AUC = 0.589; 95% CI = 0.574–0.604) had higher predictive values than BMI (AUC = 0.546; 95% CI = 0.531–0.561). However, there was no significant difference in AUC between LBM and BMI (Fig. 3).
DISCUSSION
This study provides a comprehensive overview of the perfor- mance of the T/Br derived from DXA as a predictor of early de- cline of kidney function, and demonstrates that T/Br has the strongest association with mild loss of kidney function in the general population. These findings point to the use of T/Br as an early warning of possible decreased kidney function in peo- ple who are unaware of the risk of CKD.
Our results revealed that, compared with controls, partici- pants with mildly decreased kidney function were more hyper- tensive and obese and had higher serum triglyceride levels and lower HDL-cholesterol levels. These findings are consistent with previous landmark studies showing that metabolic syn-
drome and its components increased cerebro-cardiovascular risk and were strongly associated with poor kidney outcomes (20,21).
Our linear regression analysis showed that obesity-related indicators such as anthropometric indices and T/Br had a clos- er relation to kidney function than to other compartments of metabolic syndrome. This finding suggests that obesity is a ma- jor metabolic factor associated with the progression of kidney disease. Growing body of evidences show that elevated abdom- inal fat mass, namely visceral obesity, is one of dangerous clini- cal determinants inducing many clinical illnesses (8,22-24), and it could lead to kidney dysfunction via a variety of mechanisms including local secretion of pro-inflammatory cytokines/che-
Oh IH, et al. • Abdominal Obesity and Kidney Function
mokines, direct compression of the kidney and renal arteries, and activation of the sympathetic nervous system or the renin- angiotensin-aldosterone system (25). Our results indicate that anthropometric indices of central obesity and T/Br bear a sig- nificant relation to early decreased kidney function.
Our logistic regression analysis revealed that T/Br and C-in- dex were strong predictors of early decreased kidney function
in the general population, but WC was not. WC is the most fre- quently used indicator of central obesity. However, there is con- troversy over whether it is associated with decreased kidney function (26). A Japanese prospective study found that steeper increases of WC were related to a more rapid decline of renal function, while a Southeast Asian cohort study demonstrated that it was not significantly associated with CKD prevalence or Table 2. Linear regression for eGFR
Variables Crude Model I Model II
Slope P Slope P Slope P
Age, yr −0.5045 < 0.001
Systolic BP, mmHg −0.1654 < 0.001
Diastolic BP, mmHg −0.1688 < 0.001
BMI, kg/m2 −0.3752 < 0.001
WC, cm −0.2155 < 0.001 −0.0990 < 0.001
C-Index, m1½·kg-½ −35.5260 < 0.001 −12.2213 < 0.001
Hemoglobin, g/dL −0.9592 < 0.001
Hemoglobin A1c, % −6.9681 < 0.001
Triglyceride, mg/dL −0.0114 < 0.001
HDL-cholesterol, mg/dL 0.1456 < 0.001
LDL-cholesterol, mg/dL −0.0649 < 0.001
25-hydroxy vitamin D, ng/mL −0.2589 < 0.001
Intact PTH, pg/mL −0.0261 0.015
UACR, mg/g −0.0133 0.839
Smoking amount, pack-year −0.2016 < 0.001
LBM, kg −0.1424 < 0.001 −0.2837 < 0.001 −0.2379 < 0.001
T/Br, % −0.3173 < 0.001 −0.0430 0.037 −0.0962 < 0.001
eGFR = estimated glomerular filtration rate, BP = blood pressure, BMI = body mass index, WC = waist circumference, C-index = conicity index, HDL = high-density lipopro- tein, LDL = low-density lipoprotein, PTH = parathyroid hormone, UACR = urine albumin-to-creatinine ratio, LBM = lean body mass, T/Br = trunk/body fat mass rate, Model I = adjusted for age, gender, systolic BP, BMI, hemoglobin, and smoking amount, Model II = adjusted for age, gender, systolic BP, BMI, WC, C-Index, hemoglobin, and smoking amount.
Table 3. Logistic regression for mildly decreased kidney function
Variables Crude Model I Model II
OR 95% CI OR 95% CI OR 95% CI
Age, yr 1.075 1.070–1.081
Gender (male vs. female) 1.488 1.348–1.642
Systolic BP, mmHg 1.021 1.017–1.024
Diastolic BP, mmHg 1.021 1.016–1.026
BMI, kg/m2 1.041 1.026–1.057
WC, m 1.027 1.021–1.032 1.014 0.968–1.004
C-Index, m1½·kg-½ 113.7 53.64–241.10 7.1429 1.783–28.571
Hemoglobin, g/dL 1.121 1.087–1.155
Hemoglobin A1c, % 2.275 1.680–3.082
Triglyceride, mg/dL 1.001 1.001–1.002
HDL-cholesterol, mg/dL 0.979 0.974–0.985
LDL-cholesterol, mg/dL 1.009 1.005–1.012
25-hydroxy vitamin D, ng/mL 1.029 1.020–1.038
Intact PTH, pg/mL 1.005 1.002–1.009
UACR, mg/g 0.993 0.971–1.016
Smoking amount, pack-year 1.025 1.021–1.030
LBM, kg 1.014 1.007–1.020 1.044 1.021–1.067 1.017 0.986–1.050
T/Br, % 1.046 1.039–1.053 1.034 1.032–1.649 1.020 1.007–1.033
OR = odd ratio, CI = confidence interval, BP = blood pressure, BMI = body mass index, WC = waist circumference, C-index = conicity index, HDL = high-density lipoprotein, LDL = low-density lipoprotein, PTH = parathyroid hormone, UACR = urine albumin-to-creatinine ratio, LBM = lean body mass, T/Br = trunk/body fat mass rate, Model I = adjusted for age, gender, systolic BP, BMI, hemoglobin, glucose, HDL-cholesterol, and smoking amount, Model II = adjusted for age, gender, systolic BP, BMI, C-Index, hemoglobin, glu- cose, HDL-cholesterol, and smoking amount.
Fig. 3. ROC curves representing ability to predict early decreased kidney function. T/
Br has better precision in predicting mildly decreased kidney function than other obe- sity-related indices.
ROC = receiver operating characteristic, T/Br = trunk/body fat mass ratio, C-index = conicity index, WC = waist circumference, BMI = body mass index, LBM = lean body mass, AUC = area under curve.
Sensitivity
1-specificity
0 0.5 1 1
0.5
T/Br (AUC, 0.639) C-index (AUC, 0.612) WC (AUC, 0.589) BMI (AUC, 0.546) LBM (AUC, 0.541)
P = 0.032 P < 0.001 P < 0.001 P = 0.515
the risk of developing CKD (27). Thus, it appears to be a weak indicator estimating adverse influence of visceral obesity on kidney function (26). Recently, C-index was developed and im- proved accuracy in the estimation of abdominal fat accumula- tion. Sezer et al. (26) reported that C-index appeared to be a strong predictor of systemic inflammation, cardiovascular risk, and loss of kidney function in pre-dialysis CKD patients. How- ever, such anthropometric indicator is difficult to interpret bio- logically, less sensitive to weight gain, and does not take into account the effect of hydration state on body weight (14,28,29).
In case of C-index, the complex equation may limit its wide- spread use. On the other hand, our results showed that T/Br may be a suitable alternative indicator in estimating the adverse effect of the central obesity on the kidneys.
One of the major findings of our study was that the AUC of T/
Br for predicting early decreased kidney function was signifi- cantly higher than those of the 3 other anthropometric indices.
Although total body and regional scans using DXA yield accu- rate measures of body composition, DXA cannot differentiate directly between visceral and subcutaneous fat and the use of irradiation is undesirable in certain groups, such as children and the pregnant (30,31). Also, some authors have argued that an anthropometric index was strongly associated with visceral fat in participants with CKD, and others have shown that total body fat change measured by bioelectrical impedance analysis is related to a reduction in eGFR in the elderly population (32,33).
However, the 3 components of body, namely lean mass, fat mass and bone mineral density, can be easily measured in the whole body or individual body segments by a single whole body DXA
scan (30), and some approach could minimize the confound- ing effect of subcutaneous fat mass in estimating visceral obesi- ty. In the present study, straightforward measurements of the fat mass of the whole body or individual body segments were only weakly related to decreased kidney function (data not shown), but adjusting fat mass in the trunk by whole body fat mass sig- nificantly improved their accuracy. Thus, our study raises the possibility that T/Br could be a novel DXA indicator of abdomi- nal fat accumulation. However, because there have been very few clinical studies of the use of visceral/total fat mass ratio, a long-term prospective study is needed to establish whether T/
Br as a DXA measurement is a good indicator of the presence of chronic illness caused by metabolic syndrome, especially vis- ceral obesity.
Interestingly, we observed that estimated kidney function was negatively correlated with serum hemoglobin level; this is consistent with a previous report assessing the possible associ- ation between hemoglobin level and kidney function in early CKD patients (34). Mechanistically, it is possible that activation of the renin-angiotensin system in early CKD patients contrib- utes to an increased production of erythropoietin to maintain tissue oxygen content (34). Because CKD is a systemic inflam- matory disease and elevated pro-inflammatory factors are as- sociated with anemia and low iron status (35), much controver- sy persists. We performed adjusted regression analyses to mini- mize the effects of possible confounding variables on kidney function.
There are some limitations to this study. First, because the number of participants with GFR < 60 mL·min-1·1.73 m-2 or UACR > 30 mg/g in KNHANES was very small, we could not investigate the relationship between visceral obesity and CKD development. Second, because of the limitations of cross-sec- tional studies, we could not assess the positive/negative effect of visceral obesity on the characteristics and patterns of chang- es of kidney function. Third, we did not obtain the anatomical or radiologic data on subcutaneous or visceral adipose tissue by magnetic resonance imaging and computed tomography that could have helped to distinguish the harmful effects of vis- ceral obesity from those of subcutaneous adiposity (36). Finally, since T/Br is, strictly speaking, machine-based, it is not readily performed in primary care.
The results of the present study show that an increase in the proportion of trunk fat mass may be related to early deteriora- tion of kidney function in the general population. Also, addition- al assessment of body fat composition using DXA may provide precise information for predicting the risk of kidney impairment along with other obesity-related indicators. To confirm these findings, there is need for a large population-based prospective study in the general population to establish the exact associa- tion among T/Br, visceral obesity, and kidney function.
Oh IH, et al. • Abdominal Obesity and Kidney Function
DISCLOSURE
The authors have no potential conflicts of interest to disclose.
AUTHOR CONTRIBUTION
Conceptualization: Lee CH, Park JS. Investigation: Lee CH, Park JS. Writing - original draft: Oh IH, Choi JW, Park JS.
ORCID
Il Hwan Oh http://orcid.org/0000-0003-4195-2561 Jong Wook Choi http://orcid.org/0000-0001-9624-6862 Chang Hwa Lee http://orcid.org/0000-0001-5786-3358 Joon-Sung Park http://orcid.org/0000-0003-4740-3061 REFERENCES
1. Go AS, Chertow GM, Fan D, McCulloch CE, Hsu CY. Chronic kidney dis- ease and the risks of death, cardiovascular events, and hospitalization. N Engl J Med 2004; 351: 1296-305.
2. Ninomiya T, Kiyohara Y, Kubo M, Tanizaki Y, Doi Y, Okubo K, Wakugawa Y, Hata J, Oishi Y, Shikata K, et al. Chronic kidney disease and cardiovas- cular disease in a general Japanese population: the Hisayama Study. Kid- ney Int 2005; 68: 228-36.
3. Sarnak MJ, Levey AS, Schoolwerth AC, Coresh J, Culleton B, Hamm LL, McCullough PA, Kasiske BL, Kelepouris E, Klag MJ, et al. Kidney disease as a risk factor for development of cardiovascular disease: a statement from the American Heart Association Councils on Kidney in Cardiovas- cular Disease, High Blood Pressure Research, Clinical Cardiology, and Epidemiology and Prevention. Circulation 2003; 108: 2154-69.
4. Wang Y, Katzmarzyk PT, Horswell R, Zhao W, Johnson J, Hu G. Kidney function and the risk of cardiovascular disease in patients with type 2 dia- betes. Kidney Int 2014; 85: 1192-9.
5. Desbien AM, Chonchol M, Gnahn H, Sander D. Kidney function and pro- gression of carotid intima-media thickness in a community study. Am J Kidney Dis 2008; 51: 584-93.
6. Van Biesen W, De Bacquer D, Verbeke F, Delanghe J, Lameire N, Vanhold- er R. The glomerular filtration rate in an apparently healthy population and its relation with cardiovascular mortality during 10 years. Eur Heart J 2007; 28: 478-83.
7. Wiggins KJ, Johnson DW. The influence of obesity on the development and survival outcomes of chronic kidney disease. Adv Chronic Kidney Dis 2005; 12: 49-55.
8. Wang Y, Chen X, Song Y, Caballero B, Cheskin LJ. Association between obesity and kidney disease: a systematic review and meta-analysis. Kid- ney Int 2008; 73: 19-33.
9. Mathew AV, Okada S, Sharma K. Obesity related kidney disease. Curr Di- abetes Rev 2011; 7: 41-9.
10. Jung UJ, Choi MS. Obesity and its metabolic complications: the role of adipokines and the relationship between obesity, inflammation, insulin resistance, dyslipidemia and nonalcoholic fatty liver disease. Int J Mol Sci 2014; 15: 6184-223.
11. Yusuf S, Hawken S, Ounpuu S, Bautista L, Franzosi MG, Commerford P, Lang CC, Rumboldt Z, Onen CL, Lisheng L, et al. Obesity and the risk of myocardial infarction in 27,000 participants from 52 countries: a case-con- trol study. Lancet 2005; 366: 1640-9.
12. Agarwal R, Bills JE, Light RP. Diagnosing obesity by body mass index in chronic kidney disease: an explanation for the “obesity paradox?”. Hyper- tension 2010; 56: 893-900.
13. Ashwell M, Lejeune S, McPherson K. Ratio of waist circumference to height may be better indicator of need for weight management. BMJ 1996; 312:
377.
14. Vazquez G, Duval S, Jacobs DR Jr, Silventoinen K. Comparison of body mass index, waist circumference, and waist/hip ratio in predicting inci- dent diabetes: a meta-analysis. Epidemiol Rev 2007; 29: 115-28.
15. Nelson TL, Bessesen DH, Marshall JA. Relationship of abdominal obesity measured by DXA and waist circumference with insulin sensitivity in His- panic and non-Hispanic white individuals: the San Luis Valley Diabetes Study. Diabetes Metab Res Rev 2008; 24: 33-40.
16. Lee K, Song YM, Sung J. Which obesity indicators are better predictors of metabolic risk?: healthy twin study. Obesity (Silver Spring) 2008; 16: 834- 40.
17. Ghosh A. Comparison of anthropometric, metabolic and dietary fatty ac- ids profiles in lean and obese dyslipidaemic Asian Indian male subjects.
Eur J Clin Nutr 2007; 61: 412-9.
18. Levey AS, Stevens LA, Schmid CH, Zhang YL, Castro AF 3rd, Feldman HI, Kusek JW, Eggers P, Van Lente F, Greene T, et al. A new equation to esti- mate glomerular filtration rate. Ann Intern Med 2009; 150: 604-12.
19. Wetmore JB, Honea RA, Vidoni ED, Almehmi A, Burns JM. Role of lean body mass in estimating glomerular filtration rate in Alzheimer disease.
Nephrol Dial Transplant 2011; 26: 2222-31.
20. Galassi A, Reynolds K, He J. Metabolic syndrome and risk of cardiovascu- lar disease: a meta-analysis. Am J Med 2006; 119: 812-9.
21. Thomas G, Sehgal AR, Kashyap SR, Srinivas TR, Kirwan JP, Navaneethan SD. Metabolic syndrome and kidney disease: a systematic review and me- ta-analysis. Clin J Am Soc Nephrol 2011; 6: 2364-73.
22. Berg AH, Scherer PE. Adipose tissue, inflammation, and cardiovascular disease. Circ Res 2005; 96: 939-49.
23. Snijder MB, van Dam RM, Visser M, Seidell JC. What aspects of body fat are particularly hazardous and how do we measure them? Int J Epidemi- ol 2006; 35: 83-92.
24. Wickman C, Kramer H. Obesity and kidney disease: potential mechanisms.
Semin Nephrol 2013; 33: 14-22.
25. Wahba IM, Mak RH. Obesity and obesity-initiated metabolic syndrome:
mechanistic links to chronic kidney disease. Clin J Am Soc Nephrol 2007;
2: 550-62.
26. Sezer S, Karakan S, Acar NÖ. Association of conicity index and renal pro- gression in pre-dialysis chronic kidney disease. Ren Fail 2012; 34: 165-70.
27. Oh H, Quan SA, Jeong JY, Jang SN, Lee JE, Kim DH. Waist circumference, not body mass index, is associated with renal function decline in Korean population: hallym aging study. PLoS One 2013; 8: e59071.
28. Allison DB, Paultre F, Goran MI, Poehlman ET, Heymsfield SB. Statistical considerations regarding the use of ratios to adjust data. Int J Obes Relat Metab Disord 1995; 19: 644-52.
29. Cordeiro AC, Qureshi AR, Stenvinkel P, Heimbürger O, Axelsson J, Bárány P, Lindholm B, Carrero JJ. Abdominal fat deposition is associated with in- creased inflammation, protein-energy wasting and worse outcome in pa-
tients undergoing haemodialysis. Nephrol Dial Transplant 2010; 25: 562-8.
30. Rothney MP, Brychta RJ, Schaefer EV, Chen KY, Skarulis MC. Body com- position measured by dual-energy X-ray absorptiometry half-body scans in obese adults. Obesity (Silver Spring) 2009; 17: 1281-6.
31. Snijder MB, Visser M, Dekker JM, Seidell JC, Fuerst T, Tylavsky F, Cauley J, Lang T, Nevitt M, Harris TB. The prediction of visceral fat by dual-energy X-ray absorptiometry in the elderly: a comparison with computed tomog- raphy and anthropometry. Int J Obes Relat Metab Disord 2002; 26: 984- 93.
32. Sanches FM, Avesani CM, Kamimura MA, Lemos MM, Axelsson J, Vasse- lai P, Draibe SA, Cuppari L. Waist circumference and visceral fat in CKD:
a cross-sectional study. Am J Kidney Dis 2008; 52: 66-73.
33. Oh SW, Ahn SY, Jianwei X, Kim KW, Kim S, Na KY, Chae DW, Kim S, Chin
HJ. Relationship between changes in body fat and a decline of renal func- tion in the elderly. PLoS One 2014; 9: e84052.
34. Oh SW, Baek SH, Kim YC, Goo HS, Chin HJ, Na KY, Chae DW, Kim S. High- er hemoglobin level is associated with subtle declines in renal function and presence of cardiorenal risk factors in early CKD stages. Nephrol Dial Transplant 2012; 27: 267-75.
35. Ferrucci L, Semba RD, Guralnik JM, Ershler WB, Bandinelli S, Patel KV, Sun K, Woodman RC, Andrews NC, Cotter RJ, et al. Proinflammatory state, hepcidin, and anemia in older persons. Blood 2010; 115: 3810-6.
36. Navaneethan SD, Kirwan JP, Arrigain S, Schold JD. Adiposity measures, lean body mass, physical activity and mortality: NHANES 1999-2004. BMC Nephrol 2014; 15: 108.