서 론
비만은 전세계적으로 증가하고 있는 주요 공중보건문제 중 하나 로 심혈관질환, 당뇨병, 암 및 근골격계질환 등의 이환과 사망의 중요 한 위험인자로 알려져 있다.1) 또한 비만 및 과체중은 삶의 질에 영향 을 주는 것으로 알려져 있어 성인에서의 과체중 또는 비만은 정상체 중 군에 비해 삶의 질이 유의하게 낮은 것으로 나타났다.2-4) 국내의 연구에서도 과체중 및 비만이 삶의 질을 낮추었으며5) 복부비만이 있는 군에서도 유사한 결과를 보였다.6) 또한 비만 환자에서 체중 감 량 시 삶의 질이 높아지는 결과를 보인 연구들도 있었다.7) 비만뿐만
이 아니라 저체중은 질환의 이환 및 사망에 영향을 주며 이는 노인 에서 더욱 명확한 결과를 보인다. 노인을 대상으로 추적 조사한 연 구에서 저체중은 높은 사망률과 관련이 있었으며,8,9) 저체중군에서 삶의 질이 낮았다.10-12)
한국인에서 정상체중에 비해 비만 및 과체중에서 삶의 질이 낮다 고 보고한 연구들은 있지만, 저체중과 삶의 질의 관계를 살펴본 연 구는 거의 없다. 따라서 본 연구는 일반 인구집단을 대상으로 한 대 표성 있는 대규모 자료를 이용하여 한국인에서 저체중, 정상체중, 과 체중 및 비만으로 분류한 체질량지수가 건강관련 삶의 질에 미치는 영향을 확인하기 위해 시행되었다.
Received September 21, 2016 Accepted September 28, 2016 Corresponding author Jung-Ah Lee
Tel: +82-2-3010-1667, Fax: +82-2-3010-3815 E-mail: [email protected]
Copyright © 2017 The Korean Academy of Family Medicine
This is an open-access article distributed under the terms of the Creative Commons At- tribution Non-Commercial License (http://creativecommons.org/licenses/by-nc/4.0) which permits unrestricted noncommercial use, distribution, and reproduction in any medium, provided the original work is properly cited.
Brief
Communication
https://doi.org/10.21215/kjfp.2017.7.5.794 eISSN 2233-9116
Korean J Fam Pract. 2017;7(5):794-798
Korean Journal of Family Practice
KJFP
한국인에서 체질량지수와 건강관련 삶의 질의 관계
이윤주, 이정아*, 김선희, 임지선, 박혜순
울산대학교 의과대학 서울아산병원 가정의학교실
The Relationship between Body Mass Index and Health-Related Quality of Life in Korean
Yun-Ju Lee, Jung-Ah Lee*, Sun-Hee Kim, Ji-Sun Lim, Hye-Soon Park
Department of Family Medicine, Asan Medical Center, Ulsan University College of Medicine, Seoul, Korea
Background: Body weight has an effect on health-related quality of life (HRQoL). The association between obesity and physical or psychological health might be diverse. In this study, we investigated the relationship between body mass index (BMI) and HRQoL in the Korean general population.
Methods: Using the 5th Korea National Health and Nutrition Examination Survey, a total of 14,078 subjects aged 20–79 years (6,511 men and 7,567 women) were selected and classified into four groups based on BMI levels (underweight, <18.5 kg/m2; normal weight, 18.5–22.9 kg/m2; overweight, 23.0–24.9 kg/m2; obese, ≥ 25.0 kg/m2). The Euro quality of life-5 dimensions questionnaire (EQ-5D) was used as an assessment tool of HRQoL. The relationship between BMI and HRQoL was analyzed using multivariate logistic regression.
Results: Among the male subjects, being underweight was associated with the problem of mobility (odds ratio [OR], 1.95; 95% confidence interval [CI], 1.06–3.59). Among the female subjects, being underweight showed a higher odds ratio for the low EQ-5D index score (OR, 1.76; 95% CI, 1.27–2.44) and the problem of anxiety/depression (OR, 1.46; 95% CI, 1.02–2.08). The problem of mobility in female subjects was associated with being underweight (OR, 2.04; 95% CI, 1.10–3.80), overweight (OR, 1.31; 95% CI, 1.00–1.71), and obese (OR, 1.90; 95% CI, 1.48–2.44).
Conclusion: Being underweight was associated with the problem of mobility for both genders. For women, it was related to the low EQ-5D index score and the problem of anxiety/depression, while being overweight and obese also affected mobility.
Keywords: Body Mass Index; Quality of Life; Obesity; Underweight
이윤주 외. 체중과 삶의 질 Korean Journal of Family Practice
KJFP
방 법
1. 연구 대상자 및 조사 방법
본 연구는 제5기 국민건강영양조사(2010–2012년) 자료를 토대로 진행하였다.13) 모든 대상자에게 동의서를 받은 후 진행하였으며, 건 강설문조사, 영양조사, 검진조사로 나누어 면접 또는 자기기입식으 로 조사하였다. 본 조사의 참여율은 2010년 81.9%, 2011년 80.4%, 2012 년 80.0%였다. 총 25,534명 중, 만 20–79세 성인은 18,750명(남성 8,159 명, 여성 10,591명)이었고, 이 중 체질량지수 또는 Euro quality of life-5 dimensions questionnaire (EQ-5D) 결과가 없는 1,644명을 제외하였다.
만성질환인 신부전, 간질환, 결핵 및 천식, 암 과거력을 가진 569명을 제외하고, 류마티스성 관절염, 골관절염, 뇌졸중의 후유증 및 우울 증 치료 중인 2,459명을 제외하여, 총 14,078명(남성 6,511명, 여성 7,567 명)을 연구 대상으로 선정하였다.
2. 체질량지수 분류 및 건강관련 삶의 질 평가
신장 및 체중 측정은 신발과 양말을 벗고 선 자세로 소수점 한 자 리까지 읽고 표기하였으며, 체질량지수(kg/m2)는 체중(kg)을 신장 제곱(m2)으로 나눈 값으로 산출하였다. 본 연구에서는 체질량지수 에 따라 <18.5 kg/m2 (저체중군), 18.5–22.9 kg/m2 (정상체중군), 23.0–
24.9 kg/m2 (과체중군), ≥25.0 kg/m2 (비만군)의 네 군으로 분류하였 다.14) 삶의 질 평가는 EQ-5D를 측정 도구로 사용하였다. 이는 운동능 력(mobility), 자기관리(self-care), 일상활동(usual activities), 통증/불편 (pain/discomfort), 불안/우울(anxiety/depression)의 각 항목에 대해 ‘지 장 없음’, ‘다소 지장 있음’, ‘심각한 지장이 있거나 수행 불가’의 세 가 지 수준으로 구분되어 있다. EQ-5D index 점수(EQ-5D index score)는 이를 토대로 계산하여 –0.717부터 완전한 건강상태인 1까지 가중지 표 값으로 산출된다.13) 본 연구대상자에서 ‘삶의 질 저하군(low EQ- 5D index score)’에 대해 남녀 각각에서 하위 25% (1st quartile)에 해당 하는 점수(남성≤0.913, 여성≤0.910)를 절단점으로 정하였으며 EQ-5D 의 다섯 가지 항목에 대해서는 ‘다소 지장 있음’과 ‘심각한 지장이 있 거나 수행 불가’를 묶어 해당 항목의 삶의 질이 낮은 것으로 평가하 였다.
3. 통계 분석
연구 대상자의 기본 특성은 t-검정 또는 카이제곱검정을 사용하 여 남녀 간의 차이를 비교하였다. 체질량지수에 따른 삶의 질 저하 군의 비율(%)과 EQ-5D 각 항목에서 문제가 있는 경우의 비율(%)을 확인하였으며, 연령, 교육수준, 가구소득 수준, 흡연, 음주, 신체활동 수준, 보유질환을 보정하여 다변량 로지스틱 회귀분석을 하였다. 통
계 분석은 가중치를 사용한 복합표본분석을 시행하였으며 통계적 유의성은 P-value<0.05로 정의하였으며, IBM SPSS Statistics 20.0 (IBM Co., Armonk, NY, USA)을 사용하였다.
Brief
Communication
Korean Journal of Family Practice
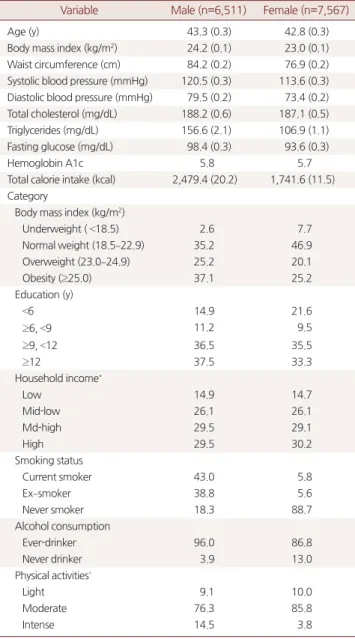
Table 1. Basic characteristics of the study participants
Variable Male (n=6,511) Female (n=7,567)
Age (y) 43.3 (0.3) 42.8 (0.3)
Body mass index (kg/m2) 24.2 (0.1) 23.0 (0.1) Waist circumference (cm) 84.2 (0.2) 76.9 (0.2) Systolic blood pressure (mmHg) 120.5 (0.3) 113.6 (0.3) Diastolic blood pressure (mmHg) 79.5 (0.2) 73.4 (0.2) Total cholesterol (mg/dL) 188.2 (0.6) 187.1 (0.5)
Triglycerides (mg/dL) 156.6 (2.1) 106.9 (1.1)
Fasting glucose (mg/dL) 98.4 (0.3) 93.6 (0.3)
Hemoglobin A1c 5.8 5.7
Total calorie intake (kcal) 2,479.4 (20.2) 1,741.6 (11.5) Category
Body mass index (kg/m2)
Underweight ( <18.5) 2.6 7.7
Normal weight (18.5–22.9) 35.2 46.9
Overweight (23.0–24.9) 25.2 20.1
Obesity (≥25.0) 37.1 25.2
Education (y)
<6 14.9 21.6
≥6, <9 11.2 9.5
≥9, <12 36.5 35.5
≥12 37.5 33.3
Household income*
Low 14.9 14.7
Mid-low 26.1 26.1
Md-high 29.5 29.1
High 29.5 30.2
Smoking status
Current smoker 43.0 5.8
Ex–smoker 38.8 5.6
Never smoker 18.3 88.7
Alcohol consumption
Ever-drinker 96.0 86.8
Never drinker 3.9 13.0
Physical activities†
Light 9.1 10.0
Moderate 76.3 85.8
Intense 14.5 3.8
Values are presented as mean (standard error) or percentage only.
*Sum of each member's income at a family. The cut–off level of each grade was made by quartile of house income of all participants on Korea National Health and Nutrition Examination Survey of each year; Low (around 0–75×104 Korean won/month), Mid–low (around 75×104–147×104 Korean won/month), Mid–
high (around 147×104–240×104 Korean won/month), and High (around larger than 240×104 Korean won/month). †Physical activities of daily life. 'Light' means resting status (laying down or sitting for almost of time in a day), 'Moderate' in- cludes light activities (such as office work) and moderate activities (housewife or teachers who are doing much work), and 'Intense' includes severe activities (works done by farmers, fishers, civil engineering workers, or construction work- ers) and very severe activities (physical labor works done by athletes or farmers at busy seasons).
Yun-Ju Lee, et al. Weight and Quality of Life
Korean Journal of Family Practice
KJFP
결 과
1. 연구 대상자의 기본 특성
연구대상자 14,078명 중 남성은 6,511명(46.2%), 여성은 7,567명 (53.8%)이었다. 평균 연령은 남성 43.3±0.3세, 여성 42.8±0.3세였고, 체 질량지수 평균값은 남성 24.2±0.1 kg/m2, 여성 23.0±0.1 kg/m2였으며 허리둘레의 평균값은 남성 84.2 cm, 여성 76.9 cm였다(Table 1).
2. 체질량지수에 따른 EQ-5D index 점수 및 낮은 삶의 질의 유병률
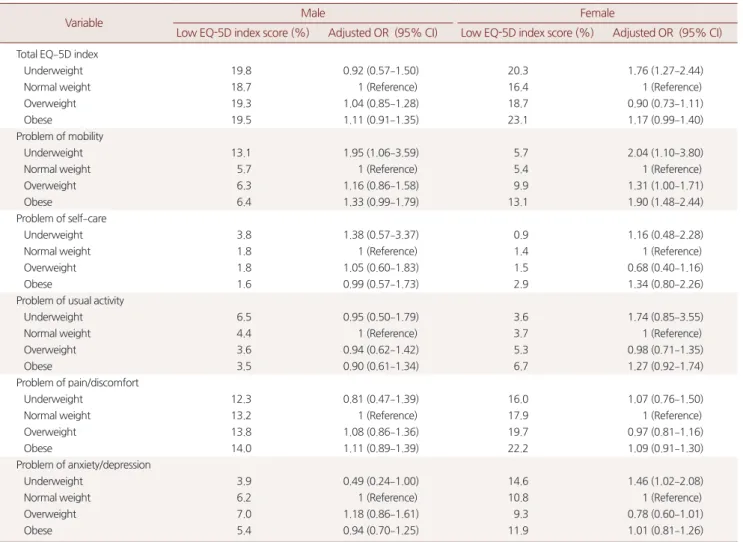
총 EQ-5D 점수로 본 체질량지수에 따른 삶의 질 저하군의 비율은 남자의 경우 유의한 차이를 보이지 않았지만 여자의 경우 저체중군
과 비만군에서 삶의 질 저하군의 비율이 높았다. EQ-5D 항목 5가지 중 남자에서는 저체중군에서 낮은 운동능력을 보이는 경우가 많았 다. 여성에서는 비만군에서 운동능력, 자기관리, 일상활동, 통증/불 편, 불안/우울의 EQ-5D 항목 5가지 모두에서 문제가 있는 비율이 높 았고, 저체중군에서는 불안/우울 측면의 문제 비율이 높았다(Table 2).
연령, 교육수준, 가구소득, 흡연상태, 음주, 신체활동 수준, 만성질 환을 보정하여 다변량 로지스틱 회귀분석을 하였다. 남성에서는 저 체중군에서 운동능력에 문제가 있었으며(교차비 1.95, 95% 신뢰구간 1.06–3.59)였고, 여성에서는 저체중군에서 삶의 질 저하가 유의하게 나타났다(교차비 1.76, 95% 신뢰구간 1.27–2.44). 여성에서 저체중군 은 불안/우울(교차비 1.46, 95% 신뢰구간, 1.02–2.08), 운동능력의 문 제(교차비 2.04, 95% 신뢰구간 1.10–3.80)가 높았다. 운동능력의 문제
Table 2. EQ-5D index score, frequency of low EQ-5D index score* and the problem† of each EQ-5D dimensions according to BMI groups in the study participants
Variable Male Female
Low EQ-5D index score (%) Adjusted OR (95% CI) Low EQ-5D index score (%) Adjusted OR (95% CI) Total EQ–5D index
Underweight 19.8 0.92 (0.57–1.50) 20.3 1.76 (1.27–2.44)
Normal weight 18.7 1 (Reference) 16.4 1 (Reference)
Overweight 19.3 1.04 (0.85–1.28) 18.7 0.90 (0.73–1.11)
Obese 19.5 1.11 (0.91–1.35) 23.1 1.17 (0.99–1.40)
Problem of mobility
Underweight 13.1 1.95 (1.06–3.59) 5.7 2.04 (1.10–3.80)
Normal weight 5.7 1 (Reference) 5.4 1 (Reference)
Overweight 6.3 1.16 (0.86–1.58) 9.9 1.31 (1.00–1.71)
Obese 6.4 1.33 (0.99–1.79) 13.1 1.90 (1.48–2.44)
Problem of self–care
Underweight 3.8 1.38 (0.57–3.37) 0.9 1.16 (0.48–2.28)
Normal weight 1.8 1 (Reference) 1.4 1 (Reference)
Overweight 1.8 1.05 (0.60–1.83) 1.5 0.68 (0.40–1.16)
Obese 1.6 0.99 (0.57–1.73) 2.9 1.34 (0.80–2.26)
Problem of usual activity
Underweight 6.5 0.95 (0.50–1.79) 3.6 1.74 (0.85–3.55)
Normal weight 4.4 1 (Reference) 3.7 1 (Reference)
Overweight 3.6 0.94 (0.62–1.42) 5.3 0.98 (0.71–1.35)
Obese 3.5 0.90 (0.61–1.34) 6.7 1.27 (0.92–1.74)
Problem of pain/discomfort
Underweight 12.3 0.81 (0.47–1.39) 16.0 1.07 (0.76–1.50)
Normal weight 13.2 1 (Reference) 17.9 1 (Reference)
Overweight 13.8 1.08 (0.86–1.36) 19.7 0.97 (0.81–1.16)
Obese 14.0 1.11 (0.89–1.39) 22.2 1.09 (0.91–1.30)
Problem of anxiety/depression
Underweight 3.9 0.49 (0.24–1.00) 14.6 1.46 (1.02–2.08)
Normal weight 6.2 1 (Reference) 10.8 1 (Reference)
Overweight 7.0 1.18 (0.86–1.61) 9.3 0.78 (0.60–1.01)
Obese 5.4 0.94 (0.70–1.25) 11.9 1.01 (0.81–1.26)
Statistical analysis was done using the multivariate logistic regression. Adjusted by age, education, household income, smoking status, alcohol consumption, physical activities, and presence of chronic disease.
EQ–5D, euro quality of life–5 dimension questionnaire; BMI, body mass index; OR, odds ratio; CI, confidence interval.
*The cut–off value of the low EQ–5D index score was determined by the lowest first quartile of subjects' EQ–5D index scores in each genders (male: 0.913, female:
0.910). †Among 3 levels of the scoring system, 'with some difficulties' and 'extremely difficult/impossible to perform' were included.
이윤주 외. 체중과 삶의 질 Korean Journal of Family Practice
KJFP
는 과체중군에서 1.31배(95% 신뢰구간 1.00–1.71) 및 비만군에서 1.90 배(95% 신뢰구간 1.48–2.44)으로 높았다.
고 찰
본 연구는 만 20–79세 한국인에서의 체질량지수와 삶의 질의 연 관성을 본 연구로, 남녀 모두에서 저체중이 운동능력 저하와 관련이 있었다. 더불어 저체중은 여성에서 삶의 질 저하 및 불안/우울과 관 련이 높았고 과체중 및 비만은 여성에서 운동능력 저하와 관련이 있 었다.
과체중 및 비만이 삶의 질에 영향을 준다는 것은 이전 연구들을 통해 알려져 있다.2-4) 국내에는 제3기 국민건강영양조사 2005년 자료 로 비만과 삶의 질 저하의 연관을 확인한 연구가 있는데,15)본 연구와 동일하게 EQ-5D를 삶의 질 평가 도구로 사용하였으나 저체중군을 따로 구분하지 않고 모두 정상체중군으로 간주하여 저체중군에 대 한 삶의 질 평가가 정확히 분석되지 않은 면이 있다.
스웨덴의 18–64세 일반 인구 13,549명을 대상으로 한 코호트 연구 에서는 체질량지수가 높은 군에서 삶의 질이 낮은 요인을 분석하였 다.3) 이 연구에서는 운동능력에 문제가 있는 사람들은 평균 체질량 지수가 높고 삶의 질은 낮았는데, 운동능력에 문제가 없고 체질량지 수만 높은 사람들은 삶의 질에 유의한 차이를 보이지 않았다. 이는 체질량지수 자체보다는 높은 체질량지수로 인해 운동능력에 문제 가 있는 사람들에게 건강관련 삶의 질이 떨어지는 것으로 해석할 수 있는데, 본 연구에서도 역시 비만 여성의 경우 운동능력 문제 및 삶 의 질 저하를 보였다.
저체중과 삶의 질의 연관성을 관찰한 이전 연구는 많지 않았고, 특히 한국의 일반 성인을 대상으로 한 연구는 거의 없었다. 미국의 18세 이상 성인 13,646명을 대상으로 한 단면 연구에서는 비만뿐 아 니라 저체중에서도 삶의 질 저하가 나타났고,16) 영국에서 일반 성인 을 대상으로 시행한 연구에서도 유사한 결과를 보였다.10) 삶의 질의 세부 항목 별로 볼 때, 본 연구 결과에 따르면 저체중은 남녀 모두에 서 운동능력 문제 있음과 관련을 보여, 체중이 적게 나갈 경우 근육 량 부족 등이 운동능력의 저하로 이어질 수 있다. 또한, 여성에서 저 체중은 불안/우울과 관련이 있었는데, 이는 저체중이 정신건강에도 좋지 않은 결과를 초래할 수 있음을 보여준다.
저체중은 신체적 건강과 연관이 있으며, 특히 노인에서의 저체중 은 사망률을 높인다는 대규모 연구가 있다.8,9) 저체중에서 흔한 영양 결핍은 필수 영양소의 부족으로 면역력 약화로 이어져 감염에 취약 한 상태를 야기할 수 있고17) 저체중은 난소암이나 대장암 생존자의 사망률을 높이는 위험인자로 작용하였다.18,19) 심혈관질환이 있는 노
인에서도 비만 및 저체중 모두에서 사망률이 유의하게 높아지는 것 을 확인하였다.8) 따라서 이러한 여러 연구 결과들을 토대로 볼 때 신 체적 건강과 삶의 질을 위해서는 적정체중을 유지하는 것이 바람직 하다고 본다.
본 연구에서 삶의 질 평가 도구로 사용 한 EQ-5D는 130개 이상의 언어로 번역되어 36-Item Short Form Health Survey (SF-36)과 함께 임 상 연구 분야에서 세계적으로 가장 많이 사용되고 있는 것으로, 여 러 국가에서 일반 인구집단뿐 아니라 다양한 질환을 가진 환자를 대상으로 신뢰도와 타당도가 검증되어 왔다. 국내에서도 일반인구 집단을 대상으로 EQ-5D의 타당도를 검증하였고, SF-36과 비교하여 수렴타당도 역시 확인되었으며 신뢰도도 각 항목별로 79–97%로 나 타나 대규모 연구에서 간편한 도구로 널리 사용되고 있다.20)
본 연구의 제한점은 다음과 같다. 본 연구는 단면 연구이므로 체 질량지수와 삶의 질 저하의 인과관계를 설명하는 데 한계가 있다. 또 한, 저체중에 영향을 주는 요소 중 하나인 식이장애에 대한 평가가 이루어지지 않았다. 그러나 현재 우울증으로 치료받는 환자 등을 연 구 대상에서 제외하였으므로 결과에 크게 영향을 끼치지는 않을 것 으로 본다. 본 연구의 장점은 대표성 있는 자료를 이용하였다는데 의 의가 있으며 한국 성인에서 비만뿐 아니라 저체중 또한 삶의 질 저하 와 관련이 있음을 확인하였다. 신체적 건강과 삶의 질을 위해서는 적 정체중을 유지하는 것이 무엇보다 중요하다고 하겠다.
요 약
연구배경:
비만은 신체적 건강뿐 아니라 건강 관련 삶의 질에 영향 을 주는 것으로 알려져 있다. 비만과 신체적 또는 정신적 건강과의 관련성은 다양하게 나타난다. 본 연구는 한국인에서 체질량지수를 저체중, 정상체중, 과체중 및 비만으로 나누어 건강관련 삶의 질과의 관련성을 보고자 하였다.방법:
본 연구는 제5기 국민건강영양조사(2010–2012년) 3년간의 자 료를 통합하여 총 14,078명(남성 6,511명, 여성 7,567명)을 대상으로 하 였다. 체질량지수에 따라 저체중군(<18.5 kg/m2), 정상체중군(18.5–22.9 kg/m2), 과체중군(23.0–24.9 kg/m2), 및 비만군(≥25.0 kg/m2)으로 구분하였고, 삶의 질 평가는 정상체중군을 기준으로 하여 EQ-5D 점수 및 각 항목의 연관성을 다변량로지스틱 회귀분석으로 분석하 였다.
결과:
남성은 저체중군에서 운동능력에 문제가 있는 것으로 나타 났다(교차비 1.95, 95% 신뢰구간 1.06–3.59). 여성에서는 저체중군에 서 삶의 질 저하를 보이는 경우가 높게 나타났으며(교차비 1.76, 95%신뢰구간 1.27–2.44), 불안/우울과도 유의한 연관이 있었다(교차비
Yun-Ju Lee, et al. Weight and Quality of Life
Korean Journal of Family Practice
KJFP
1.46, 95% 신뢰구간 1.02–2.08). 운동능력에 문제가 있는 경우는 저체 중(교차비2.04, 95% 신뢰구간 1.10–3.80), 과체중(교차비 1.31, 95% 신 뢰구간 1.00–1.71), 및 비만(교차비 1.90, 95% 신뢰구간 1.48–2.44)에서 높게 나타났다.
결론:
한국의 일반 인구집단에서 저체중은 남녀 모두에서 운동능 력 저하, 여성에서의 불안/우울과 관련이 있었고 과체중과 비만은 여 성에서 운동능력 저하와 관련이 있는 것으로 나타났다.중심단어:
체질량지수; 삶의 질; 비만; 저체중 REFERENCES1. Smith KB, Smith MS. Obesity Statistics. Prim Care 2016; 43: 121-35, ix.
2. McLaughlin L, Hinyard LJ. The relationship between health-related quality of life and body mass index. West J Nurs Res 2014; 36: 989-1001.
3. Holmgren M, Lindgren A, de Munter J, Rasmussen F, Ahlström G. Impacts of mobility disability and high and increasing body mass index on health- related quality of life and participation in society: a population-based cohort study from Sweden. BMC Public Health 2014; 14: 381.
4. Giuli C, Papa R, Bevilacqua R, Felici E, Gagliardi C, Marcellini F, et al. Corre- lates of perceived health related quality of life in obese, overweight and nor- mal weight older adults: an observational study. BMC Public Health 2014;
14: 35.
5. Kim JY, Oh DJ, Yoon TY, Choi JM, Choe BK. The impacts of obesity on psy- chological well-being: a cross-sectional study about depressive mood and quality of life. J Prev Med Public Health 2007; 40: 191-5.
6. Choo J, Jeon S, Lee J. Gender differences in health-related quality of life as- sociated with abdominal obesity in a Korean population. BMJ Open 2014;
4: e003954.
7. Lim YT, Park YW, Kim CH, Shin HC, Kim JW. Effect of weight loss on health related quality of life in obese patients. J Korean Acad Fam Med 2001;
22: 556-64.
8. Wu CY, Chou YC, Huang N, Chou YJ, Hu HY, Li CP. Association of body mass index with all-cause and cardiovascular disease mortality in the elder-
ly. PLoS One 2014; 9: e102589.
9. Roh L, Braun J, Chiolero A, Bopp M, Rohrmann S, Faeh D; Swiss National Cohort Study Group. Mortality risk associated with underweight: a census- linked cohort of 31,578 individuals with up to 32 years of follow-up. BMC Public Health 2014; 14: 371.
10. Sach TH, Barton GR, Doherty M, Muir KR, Jenkinson C, Avery AJ. The re- lationship between body mass index and health-related quality of life: com- paring the EQ-5D, EuroQol VAS and SF-6D. Int J Obes (Lond) 2007; 31:
189-96.
11. Ford DW, Jensen GL, Still C, Wood C, Mitchell DC, Erickson P, et al. The as- sociations between diet quality, Body Mass Index (BMI) and Health and Activity Limitation Index (HALex) in the Geisinger Rural Aging Study (GRAS). J Nutr Health Aging 2014; 18: 167-70.
12. Dey M, Gmel G, Mohler-Kuo M. Body mass index and health-related qual- ity of life among young Swiss men. BMC Public Health 2013; 13: 1028.
13. Korea National Health and Nutrition Examination Survey [Internet].
Cheongju: Korea Centers for Disease Control and Prevention. [cited 2016 Sep 29]. Available from: https://knhanes.cdc.go.kr/.
14. Kim MK, Lee WY, Kang JH, Kang JH, Kim BT, Kim SM, et al. 2014 Clinical practice guidelines for overweight and obesity in Korea. Endocrinol Metab (Seoul) 2014; 29: 405-9.
15. Shin JH, Yoon YS, Yang YJ, Lee ES, Lee JH, Kwak HL, et al. The relationship between obesity and health-related quality of life in Koreans. Korean J Fam Pract 2011; 1: 101-10.
16. Jia H, Lubetkin EI. The impact of obesity on health-related quality-of-life in the general adult US population. J Public Health (Oxf) 2005; 27: 156-64.
17. Black RE, Morris SS, Bryce J. Where and why are 10 million children dying every year? Lancet 2003; 361: 2226-34.
18. Schlesinger S, Siegert S, Koch M, Walter J, Heits N, Hinz S, et al. Postdiagno- sis body mass index and risk of mortality in colorectal cancer survivors: a prospective study and meta-analysis. Cancer Causes Control 2014; 25:
1407-18.
19. Kim SI, Kim HS, Kim TH, Suh DH, Kim K, No JH, et al. Impact of under- weight after treatment on prognosis of advanced-stage ovarian cancer. J Im- munol Res 2014; 2014: 349546
20. Validitry and reliability evaluation for EQ-5D in Korea. Cheongju: Korea Centers for Disease Control & Prevention; 2011 Dec.