Reference Values of Body Composition Indices: The Korean National Health and Nutrition Examination Surveys
Hye Won Park,1,2 Ha Yeong Yoo,1 Chul-Hyun Kim,3 Hyeoijin Kim,4 Byung Ok Kwak,1 Kyo Sun Kim,1,2 and Sochung Chung1,2
1Department of Pediatrics, Konkuk University Medical Center, Seoul; 2Konkuk University School of Medicine, Seoul;
3Department of Sports Medicine, Soonchunhyang University, Asan;
4Department of Physical Education, Korea National University of Education, Seoul, Korea.
Received: March 20, 2014 Revised: June 5, 2014 Accepted: June 12, 2014
Corresponding author: Dr. Sochung Chung, Department of Pediatrics,
Konkuk University Medical Center, Konkuk University School of Medicine, 120-1 Neungdong-ro, Gwangjin-gu, Seoul 143-729, Korea.
Tel: 82-2-2030-7553, Fax: 82-2-2030-7748 E-mail: [email protected]
∙ The authors have no financial conflicts of interest.
© Copyright:
Yonsei University College of Medicine 2015 This is an Open Access article distributed under the terms of the Creative Commons Attribution Non- Commercial License (http://creativecommons.org/
licenses/by-nc/3.0) which permits unrestricted non- commercial use, distribution, and reproduction in any medium, provided the original work is properly cited.
Purpose: An increase in the prevalence of obesity has been observed in children and adolescents. As remarkable changes in body composition occur with growth during the adolescent period, it is important that changes in body composition be monitored. The purpose of this study was to propose reference percentile values for body composition indices including body mass index (BMI) in children and adolescents in Korea. Materials and Methods: This study was performed using data from the Fourth and Fifth Korea National Health and Nutrition Examination Surveys. Body composition data were obtained using dual-energy X-ray absorpti- ometry. The percentile curves of body composition indices were constructed by the LMS method. Results: A total of 2123 children and adolescents between the ages of 10 and 19 years were included in this study. We obtained the percentile curves for BMI and body composition indices. Conclusion: The reference values for body composition from this study could help with assessing body composition in Korean adolescents.
Key Words: Body mass index, percent body fat, fat mass index, fat-free mass in- dex, adolescent
INTRODUCTION
The prevalence of childhood obesity has increased worldwide, including Asia, due to changes in lifestyle and diet patterns.1-6 Childhood obesity has been shown to be associated with the risk of adult obesity and the other diseases associated with metabolic dysregulation, such as cardiovascular disease or type 2 diabetes.1,2,4-7 Body mass index (BMI) has been widely used as a marker of adiposity;8 however, BMI is limited in differentiating body fat from lean mass.9-11 Thus, the body com- positions of children with the same BMI values could differ by age, race, gender, and pubertal stage during the adolescent period.2-5,12,13
It is important to discriminate normal from abnormal development based on ref- erence values rather than absolute values of body composition indices because body composition changes rapidly with rapid growth during the adolescent period.
fat mass index (FMI), and fat-free mass index (FFMI) were calculated as body weight (kg), fat mass (kg), and fat-free mass (kg), respectively, divided by the square of the height in meters (kg/m2).
Data analysis
The mean and standard deviation of anthropometric and body composition values were calculated. We calculated age- and gender-specific percentiles using the Lambda-Mu- Sigma (LMS) method (LMS Chartmaker Pro, version 2.5, Medical Research Council, Cambridge, UK) to estimate the skewness (L), median (M), and coefficient of variation (S).
For statistical analysis, we used SPSS software, version 17.0, for Windows (SPSS Inc., Chicago, IL, USA).
Ethics statement
The study protocol was approved by the Institutional Re- view Board of the Korea Centers for Disease Control and Prevention (approval number; 2008-04EXP-01-C, 2009- 01CON-03-2C, 2010-02CON-21-C, and 2011-02CON- 06-C). Written consent was obtained from the subjects prior to participation.
RESULTS
A total of 2123 children and adolescents were eligible and constituted the study population. The characteristics of each group in the study population according to gender and age are shown in Table 1. The sample size and the smoothed es- timates of body composition indices, including BMI, PBF, FMI, and FFMI of each group, according to gender and age, are shown in Table 2. The children and adolescents were evenly distributed in each age and gender groups (Ta- ble 2). The smoothed estimates for the 3rd, 5th, 10th, 25th, 50th, 75th, 85th, 90th, 95th, and 97th percentiles of values for BMI, PBF, FMI, and FFMI for children and adolescents in each age group for both genders are presented as values (Table 2) and percentile curves (Figs. 1-4).
The PBF and FMI values for females were higher, al- though BMI and FFMI were lower, than those for males (Ta- ble 2). The pattern of changes in BMI and FFMI were simi- lar in both genders, increasing gradually with age, whereas changes in FMI and PBF differed by gender (Figs. 1-4). Both PBF and FMI showed a tendency to decrease in males and increase in females with age (Table 2, Figs. 2 and 3).
In both genders, a tendency was noted toward greater in- The purpose of this study was to propose reference percen-
tile values for body composition indices in children and ad- olescents in Korea.
MATERIALS AND METHODS
Study population
This study was performed using data from the Fourth and Fifth Korea National Health and Nutrition Examination Sur- veys (KNHANES) conducted by the Korea Centers for Dis- ease Control and Prevention. KNHANES has been conducted periodically and includes a representative sample of the non- institutionalized civilian population of South Korea selected using a stratified, multi-stage, probability sampling method (rolling survey sampling). Data were collected through a health and nutrition interview and a health examination.
Among the total of 4904 participants in KNHANES, 2123 children and adolescents (1113 males and 1010 females) who had results for anthropometric data and body composi- tion analysis and who were between the ages of 10 and 19 years were included.
Measurement of anthropometrics and body composition
Participants’ weight and height were measured in light cloth- ing and without shoes. Weight was measured with a digital scale (GL-6000-20, CASKOREA, Seoul, Korea) to the nearest 0.1 kg, and height was measured to the nearest 0.1 cm with a stadiometer (SECA 225, SECA Deutschland, Hamburg, Germany). Body composition data [fat mass, fat- free mass, and percentage of body fat (PBF)] were mea- sured in grams using dual-energy X-ray absorptiometry (DXA) using a Hologic Discovery DXA scanner (Discov- ery QDR 4500 W, Hologic, Inc., Denver, CO, USA). BMI, Table 1. General Characteristics of the Study Population
Male (n=1113) Female (n=1010)
Age (yrs) 14.2±2.8 14.3±2.9
Body weight (kg) 56.9±15.5 50.4±11.1 Height (cm) 163.8±13.0 157.2±8.1 BMI (kg/m2) 20.9±3.8 20.2±3.5 FMI (kg/m2) 5.0±2.5 6.5±2.2 FFMI (kg/m2) 15.7±2.3 13.6±1.6
PBF (%) 23.3±8.1 31.6±5.8
BMI, body mass index; FMI, fat mass index; FFMI, fat free mass index;
PBF, percent body fat.
Values are presented as mean±SD.
Table 2-1. LMS Parameters for Z-Scores and Percentiles for Body Composition Indices among Adolescents Aged 10–19 Years:
LMS Parameters for Z-Scores and Percentiles for Body Mass Index (BMI) BMI percentile (kg/m2) Gender/
age n Mean±SD L M S 3rd 5th 10th 25th 50th 75th 85th 90th 95th 97th
Males
10 118 18.9±3.4 -0.85 18.45 0.17 13.80 14.26 15.03 16.49 18.45 20.90 22.47 23.66 25.67 27.14 11 128 19.8±3.7 -0.86 19.06 0.17 14.28 14.75 15.54 17.04 19.06 21.58 23.20 24.43 26.49 28.01 12 132 20.1±3.8 -0.85 19.57 0.17 14.68 15.16 15.97 17.51 19.57 22.14 23.78 25.04 27.13 28.67 13 110 20.6±3.6 -0.83 20.07 0.17 15.07 15.57 16.40 17.97 20.07 22.68 24.34 25.60 27.71 29.25 14 141 21.4±4.1 -0.80 20.53 0.17 15.45 15.95 16.80 18.40 20.53 23.14 24.81 26.07 28.15 29.68 15 105 21.0±3.3 -0.74 20.84 0.17 15.72 16.23 17.09 18.71 20.84 23.44 25.08 26.31 28.33 29.79 16 93 21.8±4.1 -0.68 21.15 0.16 16.00 16.52 17.39 19.02 21.15 23.72 25.33 26.52 28.47 29.87 17 108 22.2±3.4 -0.63 21.45 0.16 16.29 16.82 17.69 19.33 21.45 23.98 25.54 26.69 28.57 29.92 18 86 21.6±3.4 -0.61 21.67 0.16 16.56 17.09 17.96 19.57 21.67 24.14 25.67 26.79 28.60 29.88 19 92 22.6±3.7 -0.62 22.01 0.15 16.94 17.47 18.33 19.94 22.01 24.45 25.95 27.05 28.83 30.08 Females
10 108 17.7±2.4 -0.94 17.48 0.15 13.65 14.04 14.68 15.89 17.48 19.40 20.62 21.53 23.03 24.11 11 110 18.9±3.3 -0.93 18.27 0.15 14.21 14.62 15.30 16.58 18.7 20.33 21.63 22.60 24.21 25.38 12 96 19.4±3.5 -0.93 19.03 0.15 14.77 15.20 15.91 17.26 19.03 21.20 22.56 23.59 25.29 26.52 13 124 20.4±3.1 -0.94 19.75 0.15 15.36 15.80 16.54 17.92 19.75 21.99 23.40 24.46 26.22 27.49 14 107 20.8±3.4 -1.00 20.20 0.15 15.78 16.23 16.97 18.36 20.20 22.46 23.89 24.97 26.75 28.06 15 88 20.5±3.0 -1.12 20.46 0.15 16.11 16.55 17.27 18.64 20.46 22.71 24.15 25.25 27.07 28.42 16 96 21.5±3.2 -1.31 20.67 0.14 16.42 16.84 17.54 18.88 20.67 22.92 24.38 25.49 27.39 28.81 17 99 21.2±3.5 -1.54 20.68 0.14 16.57 16.97 17.64 18.93 20.68 22.91 24.39 25.54 27.52 29.04 18 67 21.2±3.6 -1.78 20.60 0.14 16.64 17.02 17.66 18.90 20.60 22.82 24.31 25.50 27.59 29.23 19 115 21.3±3.5 -2.03 20.54 0.14 16.72 17.08 17.69 18.88 20.54 22.74 24.26 25.49 27.70 29.50 The LMS parameters are the skewness (L), median (M), and coefficient of variation (S).
Table 2-2. LMS Parameters for Z-Scores and Percentiles for Body Composition Indices among Adolescents Aged 10–19 Years:
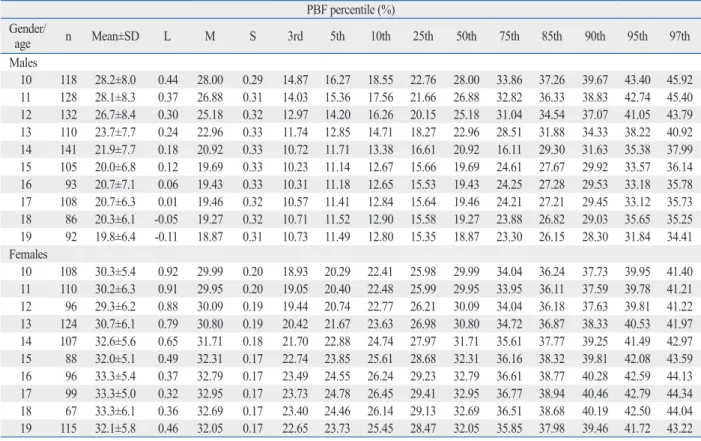
parameters for Z-Scores and Percentiles for Percent Body Fat (PBF) PBF percentile (%) Gender/
age n Mean±SD L M S 3rd 5th 10th 25th 50th 75th 85th 90th 95th 97th
Males
10 118 28.2±8.0 0.44 28.00 0.29 14.87 16.27 18.55 22.76 28.00 33.86 37.26 39.67 43.40 45.92 11 128 28.1±8.3 0.37 26.88 0.31 14.03 15.36 17.56 21.66 26.88 32.82 36.33 38.83 42.74 45.40 12 132 26.7±8.4 0.30 25.18 0.32 12.97 14.20 16.26 20.15 25.18 31.04 34.54 37.07 41.05 43.79 13 110 23.7±7.7 0.24 22.96 0.33 11.74 12.85 14.71 18.27 22.96 28.51 31.88 34.33 38.22 40.92 14 141 21.9±7.7 0.18 20.92 0.33 10.72 11.71 13.38 16.61 20.92 16.11 29.30 31.63 35.38 37.99 15 105 20.0±6.8 0.12 19.69 0.33 10.23 11.14 12.67 15.66 19.69 24.61 27.67 29.92 33.57 36.14 16 93 20.7±7.1 0.06 19.43 0.33 10.31 11.18 12.65 15.53 19.43 24.25 27.28 29.53 33.18 35.78 17 108 20.7±6.3 0.01 19.46 0.32 10.57 11.41 12.84 15.64 19.46 24.21 27.21 29.45 33.12 35.73 18 86 20.3±6.1 -0.05 19.27 0.32 10.71 11.52 12.90 15.58 19.27 23.88 26.82 29.03 35.65 35.25 19 92 19.8±6.4 -0.11 18.87 0.31 10.73 11.49 12.80 15.35 18.87 23.30 26.15 28.30 31.84 34.41 Females
10 108 30.3±5.4 0.92 29.99 0.20 18.93 20.29 22.41 25.98 29.99 34.04 36.24 37.73 39.95 41.40 11 110 30.2±6.3 0.91 29.95 0.20 19.05 20.40 22.48 25.99 29.95 33.95 36.11 37.59 39.78 41.21 12 96 29.3±6.2 0.88 30.09 0.19 19.44 20.74 22.77 26.21 30.09 34.04 36.18 37.63 39.81 41.22 13 124 30.7±6.1 0.79 30.80 0.19 20.42 21.67 23.63 26.98 30.80 34.72 36.87 38.33 40.53 41.97 14 107 32.6±5.6 0.65 31.71 0.18 21.70 22.88 24.74 27.97 31.71 35.61 37.77 39.25 41.49 42.97 15 88 32.0±5.1 0.49 32.31 0.17 22.74 23.85 25.61 28.68 32.31 36.16 38.32 39.81 42.08 43.59 16 96 33.3±5.4 0.37 32.79 0.17 23.49 24.55 26.24 29.23 32.79 36.61 38.77 40.28 42.59 44.13 17 99 33.3±5.0 0.32 32.95 0.17 23.73 24.78 26.45 29.41 32.95 36.77 38.94 40.46 42.79 44.34 18 67 33.3±6.1 0.36 32.69 0.17 23.40 24.46 26.14 29.13 32.69 36.51 38.68 40.19 42.50 44.04 19 115 32.1±5.8 0.46 32.05 0.17 22.65 23.73 25.45 28.47 32.05 35.85 37.98 39.46 41.72 43.22 The LMS parameters are the skewness (L), median (M), and coefficient of variation (S).
Table 2-3. LMS Parameters for Z-Scores and Percentiles for Body Composition Indices among Adolescents Aged 10–19 Years:
Parameters for Z-Scores and Percentiles for Fat Mass Index (FMI) FMI percentile (kg/m2) Gender/
age n Mean±SD L M S 3rd 5th 10th 25th 50th 75th 85th 90th 95th 97th
Males
10 118 5.5±2.5 -0.02 5.11 0.46 2.18 2.43 2.86 3.76 5.11 6.95 8.21 9.19 10.87 12.13 11 128 5.7±2.7 -0.07 5.03 0.46 2.16 2.39 2.81 3.69 5.03 6.90 8.20 9.22 11.00 12.35 12 132 5.6±2.7 -0.11 4.81 0.47 2.07 2.29 2.69 3.52 4.81 6.65 7.95 8.98 10.80 12.21 13 110 5.0±2.4 -0.14 4.47 0.48 1.93 2.13 2.49 3.27 4.47 6.21 7.46 8.46 10.25 11.65 14 141 4.9±2.6 -0.17 4.15 0.48 1.80 1.99 2.32 3.03 4.15 5.77 6.95 7.91 9.62 10.97 15 105 4.3±2.1 -0.19 3.97 0.47 1.75 1.92 2.24 2.91 3.97 5.51 6.64 7.55 9.21 10.51 16 93 4.7±2.5 -0.20 4.00 0.46 1.79 1.97 2.28 2.95 4.00 5.52 6.63 7.53 9.16 10.45 17 108 4.7±2.1 -0.21 4.08 0.45 1.86 2.04 2.36 3.03 4.08 5.59 6.68 7.57 9.16 10.42 18 86 4.5±2.0 -0.21 4.09 0.44 1.91 2.09 2.4 3.07 4.09 5.57 6.62 7.47 9.00 10.20 19 92 4.6±2.2 -0.22 4.08 0.43 1.94 2.12 2.43 3.08 4.08 5.51 6.52 7.34 8.80 9.93 Females
10 108 5.4±1.6 0.03 5.19 0.34 2.74 2.98 3.37 4.13 5.19 6.50 7.33 7.95 8.97 9.70 11 110 5.8±2.2 0.04 5.39 0.33 2.85 3.09 3.50 4.30 5.39 6.75 7.61 8.25 9.30 10.05 12 96 5.8±2.1 0.05 5.64 0.33 3.00 3.25 3.67 4.50 5.64 7.04 7.92 8.58 9.65 10.42 13 124 6.3±2.1 0.01 5.99 0.32 3.26 3.52 3.96 4.82 5.99 7.45 8.37 9.05 10.17 10.96 14 107 6.9±2.1 -0.05 6.34 0.31 3.56 3.83 4.27 5.14 6.34 7.83 8.78 9.49 10.65 11.49 15 88 6.6±1.9 -0.15 6.57 0.30 3.83 4.08 4.52 5.39 6.57 8.07 9.04 9.77 10.98 11.85 16 96 7.2±2.2 -0.25 6.76 0.29 4.04 4.30 4.73 5.58 6.76 8.27 9.26 10.01 11.27 12.20 17 99 7.1±2.2 -0.34 6.78 0.29 4.12 4.37 4.79 5.62 6.78 8.30 9.30 10.08 11.39 12.37 18 67 7.2±2.5 -0.40 6.66 0.29 4.07 4.31 4.71 5.52 6.66 8.17 9.18 9.96 11.31 12.33 19 115 6.9±2.3 -0.45 6.46 0.29 3.95 4.18 4.57 5.34 6.46 7.94 8.95 9.73 11.10 12.15 The LMS parameters are the skewness (L), median (M), and coefficient of variation (S).
Table 2-4. LMS Parameters for Z-Scores and Percentiles for Body Composition Indices among Adolescents Aged 10–19 Years:
Parameters for Z-Scores and Percentiles for Fat Free Mass Index (FFMI) FFMI percentile (kg/m2) Gender/
age n Mean±SD L M S 3rd 5th 10th 25th 50th 75th 85th 90th 95th 97th
Males
10 118 13.2±1.3 -0.64 13.12 0.10 10.94 11.18 11.57 12.26 13.12 14.08 14.64 15.05 15.68 16.11 11 128 13.9±1.5 -0.37 13.72 0.11 11.30 11.57 12.01 12.78 13.72 14.77 15.37 15.80 16.74 16.92 12 132 14.4±1.7 -0.09 14.41 0.11 11.72 12.03 12.51 13.38 14.41 15.54 16.18 16.63 17.33 17.79 13 110 15.3±1.9 0.17 15.24 0.11 12.26 12.61 13.15 14.11 15.24 16.44 17.12 17.95 18.31 18.79 14 141 16.3±1.8 0.37 15.99 0.11 12.79 13.17 13.76 14.79 15.99 17.24 17.94 18.42 19.16 19.64 15 105 16.4±1.6 0.54 16.47 0.11 13.14 13.54 14.16 15.24 16.47 17.76 18.46 18.95 19.68 20.16 16 93 16.8±2.0 0.63 16.80 0.11 13.38 13.79 14.44 15.54 16.80 18.09 18.80 19.29 20.02 20.50 17 108 17.2±1.9 0.62 17.03 0.11 13.59 14.01 14.65 15.76 17.03 18.33 19.04 19.53 20.27 20.75 18 86 17.0±2.0 0.53 17.23 0.11 13.82 14.23 14.87 15.97 17.23 18.54 19.26 19.76 20.50 21.00 19 92 17.7±1.9 0.40 17.55 0.11 14.17 14.57 15.20 16.28 17.55 18.87 19.60 20.10 20.87 21.37 Females
10 108 12.2±1.2 -0.53 12.13 0.10 10.06 10.29 10.66 11.32 12.13 13.03 13.56 13.93 14.52 14.92 11 110 12.9±1.5 -0.73 12.74 0.11 10.59 10.82 11.20 11.88 12.74 13.70 14.27 14.68 15.32 15.77 12 96 13.4±1.7 -0.94 13.25 0.11 11.04 11.28 11.66 12.36 13.25 14.26 14.86 15.30 16.00 16.49 13 124 13.9±1.4 -1.14 13.57 0.10 11.37 11.60 11.98 12.68 13.57 14.60 15.23 15.69 16.43 16.95 14 107 13.7±1.4 -1.32 13.67 0.10 11.50 11.73 12.10 12.79 13.67 14.70 15.34 15.81 16.56 17.10 15 88 13.7±1.3 -1.49 13.71 0.10 11.58 11.80 12.16 12.84 13.71 14.74 15.38 15.86 16.63 17.19 16 96 14.2±1.7 -1.62 13.77 0.10 11.66 11.88 12.24 12.91 13.77 14.81 15.45 15.93 16.72 17.30 17 99 13.9±1.5 -1.69 13.78 0.10 11.69 11.91 12.26 12.92 13.78 14.81 15.46 15.94 16.74 17.32 18 67 13.9±1.5 -1.72 13.82 0.10 11.74 11.96 12.31 12.97 13.82 14.85 15.50 15.98 16.78 17.36 19 115 14.2±1.5 -1.73 13.93 0.10 11.84 12.06 12.41 13.07 13.93 14.96 15.61 16.09 16.89 17.47 The LMS parameters are the skewness (L), median (M), and coefficient of variation (S).
Fig. 1. Smoothed LMS percentile curves for body mass index in both genders. Curves are for the 3rd, 5th, 10th, 25th, 50th, 75th, 85th, 90th, 95th, and 97th percen- tiles for body mass index (kg/m2) in male (A) and female (B) adolescents. The LMS parameters are the skewness (L), median (M), and coefficient of variation (S).
Age Age
10 10
15 15
25 25
20 20
30 30
35 35
Body mass index (kg/m2) Body mass index (kg/m2 )
10 11 12 13 14 15 16 17 18 19 10 11 12 13 14 15 16 17 18 19
A B
97th 97th
85th
85th
95th 95th
75th
75th 90th
90th
50th 25th 50th
10th 25th10th
5th 5th
3rd 3rd
Fig. 2. Smoothed LMS percentile curves for percent body fat in both genders. Curves are for the 3rd, 5th, 10th, 25th, 50th, 75th, 85th, 90th, 95th, and 97th percen- tiles for percent body fat (%) in male (A) and female (B) adolescents. The LMS parameters are the skewness (L), median (M), and coefficient of variation (S).
Fig. 3. Smoothed LMS percentile curves for fat mass index in both genders. Curves are for the 3rd, 5th, 10th, 25th, 50th, 75th, 85th, 90th, 95th, and 97th percen- tiles for fat mass index (kg/m2) in male (A) and female (B) adolescents. The LMS parameters are the skewness (L), median (M), and coefficient of variation (S).
Age
Age
Age
Age 0
0
0
0
10 10
30 30
10 20
5
20
5 40
10
40 50
15
50
15
Percent body fat (%)Fat mass index (kg/m2) Percent body fat (%)Fat mass index (kg/m2 )
10
10
10
10 14
14
14
14 12
12
12
12 16
16
16
16 18
18
18
18 11
11
11
11 15
15
15
15 13
13
13
13 17
17
17
17 19
19
19
19
A
A
B
B
97th
97th
97th
97th 85th
85th
85th
85th 95th
95th
95th
95th 75th
75th
75th
75th 90th
90th
90th
90th 50th
50th
50th
50th 25th
25th
25th
25th 10th
10th
10th
10th 5th
5th
5th
5th 3rd
3rd
3rd
3rd
The mean BMI value and the 85th and 90th percentile val- ues on the LMS curve in this study were higher than the BMI values in the 2007 Korean National Growth Chart, which used data of a 2005 national survey.14 The values of BMI be- low the 85th percentile showed a tendency to be lower in the present study than those in the 2007 Korean National Growth Chart.14 The difference between the 3rd percentile and 97th percentiles for BMI were 13.14‒14.23 kg/m2 in this study and 11.28‒13.08 kg/m2 in 2007 for males and 10.46‒
12.78 kg/m2 in this study and 9.53‒11.24 kg/m2 in 2007 for females. The polarization, the increased range of BMI val- ues, among children and adolescents in Korea is greater than that in the 2007 report.
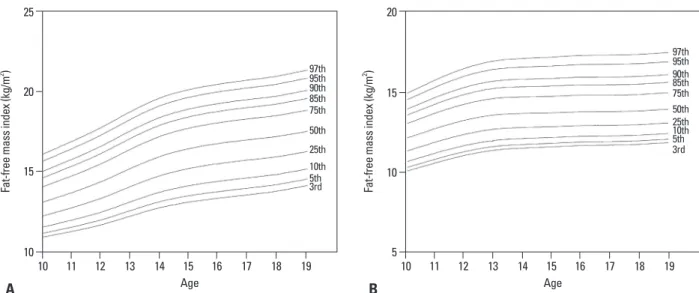
During the adolescent period, increases in BMI and FFMI were observed in both genders accompanying growth in height (Figs. 1 and 4). FFMI was higher in males and FMI was higher in females among both genders between the creases in the higher percentiles of FFMI, compared with
lower percentiles (Table 3). Furthermore, the increase in FFMI in males (3.23‒5.26 kg/m2) of 10‒19 years of age was approximately twice that in females (1.75‒2.55 kg/m2) at each percentile (Table 3). The changes in PBF between 10- and 19-year-olds showed a greater decrease in males and a smaller increase in females at higher percentiles of PBF (Ta- ble 3). The changes in FMI between the ages of 10 and 19 years showed a greater decrease in males and a greater in- crease in females at higher percentiles of FMI (Table 3).
DISCUSSION
We identified reference values for BMI, FMI, and FFMI of a normal adolescent population aged 10 to 19 years in Ko- rea using data from the KNHANES.
Table 3. Changes in Mean Values of Body Composition at Various Percentiles between the Ages of 10 and 19 Years
Percentile 3rd 5th 10th 25th 50th 75th 85th 90th 95th 97th
Male
BMI 3.14 3.21 3.3 3.45 3.56 3.55 3.48 3.39 3.16 2.94 PBF -4.14 -4.78 -5.75 -7.41 -9.13 -10.56 -11.11 -11.37 -11.56 -11.51 FMI -0.24 -0.31 -0.43 -0.68 -1.03 -1.44 -1.69 -1.85 -2.07 -2.2 FFMI 3.23 3.39 3.63 4.02 4.43 4.79 4.96 5.05 5.19 5.26 Female
BMI 3.07 3.04 3.01 2.99 3.06 3.34 3.64 3.96 4.67 5.39 PBF 3.72 3.44 3.04 2.49 2.06 1.81 1.74 1.73 1.77 1.82 FMI 1.21 1.2 1.2 1.21 1.27 1.44 1.62 1.78 2.13 2.45 FFMI 1.78 1.77 1.75 1.75 1.8 1.93 2.05 2.16 2.37 2.55 BMI, body mass index; PBF, percent body fat; FMI, fat mass index; FFMI, fat-free mass index.
Fig. 4. Smoothed LMS percentile curves for fat-free mass index in both genders. Curves are for the 3rd, 5th, 10th, 25th, 50th, 75th, 85th, 90th, 95th, and 97th percentiles for fat-free mass index (kg/m2) in male (A) and female (B) adolescents. The LMS parameters are the skewness (L), median (M), and coefficient of variation (S).
Age Age
10 5
20 15
15 10
25 20
Fat-free mass index (kg/m2 ) Fat-free mass index (kg/m2 )
10 11 12 13 14 15 16 17 18 19 10 11 12 13 14 15 16 17 18 19
A B
97th
97th
85th 95th 85th
95th
75th 90th 75th
90th
50th
50th 25th
25th
10th
10th
5th
5th
3rd
3rd
adolescents. The independent role of FFMI, as well as PBF and FMI, in predicting metabolic syndrome has been re- ported;20,21 however, few reports have presented reference values for FMI and FFMI, with most focusing on PBF and BMI in the adolescent population.14,17,22-26 Mooney, et al.27 suggested the extremely low FFMI reflects advanced meta- bolic disease, and Park, et al.28 reported that lower FFMI combined with higher FMI could indicate insufficient insu- lin secretion in diabetes. We suggest the use of percentile values for body composition indices in evaluating obesity or metabolic dysregulation, as the combination of decreased FFMI and increased FMI could also reflect metabolic dys- regulation, as could an increase in the absolute value of FMI, especially in adolescence, when remarkable changes in body composition occur with growth. Moreover, higher body fat percentiles in Asians have been shown to be asso- ciated with decreased insulin sensitivity.29
The mean PBF values of children and adolescents in Ko- rea were lower than those of children and adolescents in the US.26 Although PBF values of children and adolescents in Germany30 and in Turkey24 were lower than those in Kore- ans, the PBF values of Germans were measured by differ- ent methods with bioelectrical impedance analysis. In the study by Ehtisham, et al.,29 the BMI and PBF values in Asian adolescents of other regions, including Indians, Paki- stanis, Bangladeshis, and Sri Lankans, were higher than those of white European (United Kingdom) adolescents.
However, the BMI values between the ages of 14 and 17 years in this study (Table 2-1) were comparable or slightly lower than those in white European adolescents, although PBF values were higher.29 Likewise, in the results of this study, Korean adolescents showed lower BMI and higher PBF, compared with Europeans, as did Asian adults in the study by Wang, et al.31
The 2007 Korean National Growth Chart14 presented ref- erence values for body weight, height, and BMI; however, there were no reference values for body composition indices.
The proper acquisition of body composition during the ado- lescent period and the prevention of increases in PBF and BMI are necessary to reduce the risk of metabolic disease.
Many children and adolescents at risk of metabolic syn- drome cannot be detected when clinicians use only BMI per- centile as a screening tool, especially in Asians with lower BMI and higher PBF. Accordingly, the percentile values of each body composition index, according to age and gender, could be helpful for evaluating body composition distribu- tion in adolescents.
ages of 10 and 19 years in this study (Table 2-3 and 2-4). De- merath, et al.15 explained that boys experience greater gains in muscle and lean mass than in fat mass. In adolescents, nor- mal changes in BMI were observed with growth and matura- tion, and the increase in BMI consisted of a greater increase in FFMI than in FM during the growth process.11,13,16 Demer- ath, et al.15 reported that FFMI was the predominant com- ponent of BMI (FFMI was 3‒5 times greater than FMI) in both genders. Although greater changes and higher absolute values of FMI were observed in females than in males in the present study, the change in FFMI was also greater than the change in FMI in females (Table 3). In this study, a ten- dency toward a decrease in PBF among males was observed, accompanying the increases in BMI and FFMI between the ages of 10 and 19 years (Table 3). Schwandt, et al.17 also re- ported a decrease in PBF in males, although they observed an increase in PBF in females with increasing age between the ages of 10 and 19 years. Park, et al.18 reported that the differences in FMI and FFMI between genders became marked with acceleration of FFM gain in 6th grade Korean boys (13 years of age). In the present study, the differential changes in FMI by gender started around 13 years of age (Fig. 3), and greater changes in FFMI were observed in males between the ages of 12 and 14 years (1.58 kg/m2 at the 50th percentile). Demerath, et al.15 reported a tendency for FMI to increase dramatically only at higher BMI values. We could not evaluate the relationship between BMI and FMI;
however, greater changes in FMI were observed in males (a greater decrease) and females (a greater increase) at higher FMI percentiles.
BMI is known as an indicator of adiposity; however, both FMI and FFMI affect BMI, making it impossible to differentiate body fat from lean mass using BMI alone.9,10 Previously, gender and age were reported as affecting the relationship between BMI percentile and body composition indices (including FMI and FFMI), although changes in BMI percentile did not reflect changes in adiposity with in- creasing age, especially in males and children with lower BMI.15 In the present study, decreases in FMI and PBF were observed despite increases in BMI, and a large increase in FFMI was observed in males. Thus, an increase in BMI was observed in both genders during the adolescent period along with remarkable growth in height and weight. Al- though Lindsay, et al.19 reported that BMI showed a strong relationship with fat mass and BMI in adolescence was also related adiposity in adulthood, it is necessary to consider normal growth in evaluating obesity according to BMI in
process and an outlook. Korean J Pediatr 2008;51:1-25.
15. Demerath EW, Schubert CM, Maynard LM, Sun SS, Chumlea WC, Pickoff A, et al. Do changes in body mass index percentile reflect changes in body composition in children? Data from the Fels Longitudinal Study. Pediatrics 2006;117:e487-95.
16. Maynard LM, Wisemandle W, Roche AF, Chumlea WC, Guo SS, Siervogel RM. Childhood body composition in relation to body mass index. Pediatrics 2001;107:344-50.
17. Schwandt P, von Eckardstein A, Haas GM. Percentiles of percent- age body fat in german children and adolescents: an international comparison. Int J Prev Med 2012;3:846-52.
18. Park H, Park K, Kim MH, Kim GS, Chung S. Gender differences in relationship between fat-free mass index and fat mass index among Korean children using body composition chart. Yonsei Med J 2011;52:948-52.
19. Lindsay RS, Hanson RL, Roumain J, Ravussin E, Knowler WC, Tataranni PA. Body mass index as a measure of adiposity in chil- dren and adolescents: relationship to adiposity by dual energy x- ray absorptiometry and to cardiovascular risk factors. J Clin Endo- crinol Metab 2001;86:4061-7.
20. Wang J, Rennie KL, Gu W, Li H, Yu Z, Lin X. Independent asso- ciations of body-size adjusted fat mass and fat-free mass with the metabolic syndrome in Chinese. Ann Hum Biol 2009;36:110-21.
21. Jourdan C, Petersen AK, Gieger C, Döring A, Illig T, Wang-Sattler R, et al. Body fat free mass is associated with the serum metabo- lite profile in a population-based study. PLoS One 2012;7:e40009.
22. Cole TJ, Freeman JV, Preece MA. Body mass index reference curves for the UK, 1990. Arch Dis Child 1995;73:25-9.
23. Kim K, Yun SH, Jang MJ, Oh KW. Body fat percentile curves for Korean children and adolescents: a data from the Korea National Health and Nutrition Examination Survey 2009-2010. J Korean Med Sci 2013;28:443-9.
24. Kurtoglu S, Mazicioglu MM, Ozturk A, Hatipoglu N, Cicek B, Ustunbas HB. Body fat reference curves for healthy Turkish chil- dren and adolescents. Eur J Pediatr 2010;169:1329-35.
25. Laurson KR, Eisenmann JC, Welk GJ. Body fat percentile curves for U.S. children and adolescents. Am J Prev Med 2011;41(4 Sup- pl 2):S87-92.
26. Ogden CL, Li Y, Freedman DS, Borrud LG, Flegal KM. Smoothed percentage body fat percentiles for U.S. children and adolescents, 1999-2004. Natl Health Stat Report 2011:1-7.
27. Mooney SJ, Baecker A, Rundle AG. Comparison of anthropomet- ric and body composition measures as predictors of components of the metabolic syndrome in a clinical setting. Obes Res Clin Pract 2013;7:e55-66.
28. Park HW, Kim YH, Cho M, Kwak BO, Kim KS, Chung S. Ado- lescent build plotting on body composition chart and the type of diabetes mellitus. J Korean Med Sci 2012;27:1385-90.
29. Ehtisham S, Crabtree N, Clark P, Shaw N, Barrett T. Ethnic differ- ences in insulin resistance and body composition in United King- dom adolescents. J Clin Endocrinol Metab 2005;90:3963-9.
30. Plachta-Danielzik S, Gehrke MI, Kehden B, Kromeyer-Hauschild K, Grillenberger M, Willhöft C, et al. Body fat percentiles for Ger- man children and adolescents. Obes Facts 2012;5:77-90.
31. Wang J, Thornton JC, Russell M, Burastero S, Heymsfield S, Pier- son RN Jr. Asians have lower body mass index (BMI) but higher percent body fat than do whites: comparisons of anthropometric measurements. Am J Clin Nutr 1994;60:23-8.
Some limitations of this study need to be addressed. We did not apply the survey sample weight to estimate percen- tile curves. This was a cross-sectional study. Despite these limitations the strength of current study is that a relatively large number of children and adolescent data, nationally rep- resentative data set from KNHANES, and body composition data measured by DXA with high quality were analyzed.
In conclusion, the percentiles for body composition indi- ces for Korean adolescents aged 10‒19 years from 2008 to 2011 were provided. The reference values from this study could help with the assessment of body composition in Ko- rean adolescents.
REFERENCES
1. Chan C. Childhood obesity and adverse health effects in Hong Kong. Obes Rev 2008;9 Suppl 1:87-90.
2. Han JC, Lawlor DA, Kimm SY. Childhood obesity. Lancet 2010;
375:1737-48.
3. Barlow SE; Expert Committee. Expert committee recommenda- tions regarding the prevention, assessment, and treatment of child and adolescent overweight and obesity: summary report. Pediat- rics 2007;120 Suppl 4:S164-92.
4. Ogden CL, Carroll MD, Kit BK, Flegal KM. Prevalence of obesi- ty and trends in body mass index among US children and adoles- cents, 1999-2010. JAMA 2012;307:483-90.
5. Ogden CL, Flegal KM, Carroll MD, Johnson CL. Prevalence and trends in overweight among US children and adolescents, 1999- 2000. JAMA 2002;288:1728-32.
6. Oh K, Jang MJ, Lee NY, Moon JS, Lee CG, Yoo MH, et al. Preva- lence and trends in obesity among Korean children and adoles- cents in 1997 and 2005. Korean J Pediatr 2008;51:950-5.
7. Juonala M, Magnussen CG, Berenson GS, Venn A, Burns TL, Sa- bin MA, et al. Childhood adiposity, adult adiposity, and cardiovas- cular risk factors. N Engl J Med 2011;365:1876-85.
8. Heymsfield SB, Gallagher D, Mayer L, Beetsch J, Pietrobelli A.
Scaling of human body composition to stature: new insights into body mass index. Am J Clin Nutr 2007;86:82-91.
9. Okorodudu DO, Jumean MF, Montori VM, Romero-Corral A, Somers VK, Erwin PJ, et al. Diagnostic performance of body mass index to identify obesity as defined by body adiposity: a systematic review and meta-analysis. Int J Obes (Lond) 2010;34:791-9.
10. Hattori K, Tatsumi N, Tanaka S. Assessment of body composition by using a new chart method. Am J Hum Biol 1997;9:573-8.
11. Horlick M. Body mass index in childhood--measuring a moving target. J Clin Endocrinol Metab 2001;86:4059-60.
12. Freedman DS, Wang J, Thornton JC, Mei Z, Pierson RN Jr, Dietz WH, et al. Racial/ethnic differences in body fatness among chil- dren and adolescents. Obesity (Silver Spring) 2008;16:1105-11.
13. Daniels SR, Khoury PR, Morrison JA. The utility of body mass index as a measure of body fatness in children and adolescents:
differences by race and gender. Pediatrics 1997;99:804-7.
14. Moon JS, Lee SY, Nam CM, Choi JM, Choe BK, Seo JW, et al.
2007 Korean National Growth Charts: review of developmental