D I A B E T E S & M E T A B O L I S M J O U R N A L D I A B E T E S & M E T A B O L I S M J O U R N A L
This is an Open Access article distributed under the terms of the Creative Commons Attribution Non-Commercial License (http://creativecommons.org/licenses/by-nc/4.0/) which permits unrestricted non-commercial use, distribution, and reproduction in any medium, provided the original work is properly cited.
Severity of Nonalcoholic Fatty Liver Disease in Type 2 Diabetes Mellitus: Relationship between Nongenetic Factors and PNPLA3/HSD17B13 Polymorphisms
Mattia Bellan1,2,3,*, Cosimo Colletta4,*, Matteo Nazzareno Barbaglia1, Livia Salmi1, Roberto Clerici1, Venkata Ramana Mallela1, Luigi Mario Castello1,5, Giuseppe Saglietti6,†, Gian Piero Carnevale Schianca7, Rosalba Minisini1, Mario Pirisi1,3,7
1Department of Translational Medicine, University of Eastern Piedmont, Novara,
2Division of Internal Medicine, Sant’Andrea Hospital, Vercelli,
3Interdisciplinary Research Center of Autoimmune Diseases (IRCAD), Novara,
4COQ, Madonna del Popolo, Omegna,
5Emergency Medicine Department, Maggiore della Carità Hospital, Novara,
6Diabetes Clinic, ASL VCO, Verbania,
7Division of Internal Medicine, AOU Maggiore della Carità Hospital, Novara, Italy
Background: The prevalence of nonalcoholic fatty liver disease (NAFLD) in patients with type 2 diabetes mellitus (T2DM) is high, though its severity is often underestimated. Our aim is to provide an estimate of the prevalence of severe NAFLD in T2DM and identify its major predictors.
Methods: T2DM patients (n=328) not previously known to have NAFLD underwent clinical assessment, transient elastography with measure of liver stiffness (LS) and controlled attenuation parameter (CAP), and genotyping for patatin like phospholipase domain containing 3 (PNPLA3) and 17β-hydroxysteroid-dehydrogenase type 13 (HSD17B13).
Results: Median LS was 6.1 kPa (4.9 to 8.6). More than one-fourth patients had advanced liver disease, defined as LS ≥7.9 kPa (n=94/238, 29%), and had a higher body mass index (BMI) than those with a LS <7.9 kPa. Carriage of the G allele in the PNPLA3 gene was associated with higher LS, being 5.9 kPa (4.7 to 7.7) in C/C homozygotes, 6.1 kPa (5.2 to 8.7) in C/G heterozygotes, and 6.8 kPa (5.8 to 9.2) in G/G homozygotes (P=0.01). This trend was absent in patients with ≥1 mutated HSD17B13 allele. In a mul- tiple linear regression model, BMI and PNPLA3 genotype predicted LS, while age, gender, disease duration, and glycosylated he- moglobin did not fit into the model. None of these variables was confirmed to be predictive among carriers of at least one HS- D17B13 mutated allele. There was no association between CAP and polymorphisms of PNPLA3 or HSD17B13.
Conclusion: Advanced NAFLD is common among T2DM patients. LS is predicted by both BMI and PNPLA3 polymorphism, the effect of the latter being modulated by mutated HSD17B13.
Keywords: Adiponutrin; Body mass index; Diabetes mellitus, type 2; Fibrosis; Non-alcoholic fatty liver disease
Corresponding author: Mattia Bellan https://orcid.org/0000-0003-1488-8736 Department of Translational Medicine, University of Eastern Piedmont, via Solaroli 17, Novara 28100, Italy
E-mail: [email protected]
*Mattia Bellan and Cosimo Colletta contributed equally to this study as first authors.
INTRODUCTION
Nonalcoholic fatty liver disease (NAFLD) is the name given to a spectrum of liver disorders, histologically categorized as sim- ple (i.e., isolated) steatosis or nonalcoholic steatohepatitis
(NASH) with or without fibrosis, often resulting in cirrhosis and hepatocellular carcinoma (HCC) [1]. Like its major risk factors, obesity and type 2 diabetes mellitus (T2DM), NAFLD results from the interaction between environmental and ge- netic factors [2]. Specifically, variants in two genes coding for https://doi.org/10.4093/dmj.2018.0201
pISSN 2233-6079 · eISSN 2233-6087
proteins involved in lipolysis and lipogenesis, namely adiponu- trin (also known as patatin like phospholipase domain con- taining 3 [PNPLA3]) and, more recently, 17β-hydroxysteroid- dehydrogenase type 13 (HSD17B13), have been shown to play a significant role in NAFLD pathogenesis and progression [3].
There is an ongoing debate regarding whether screening campaigns should be conducted to identify NAFLD individu- als [4]. The overwhelmingly high prevalence, the relatively low risk of progression to significant liver disease for most NAFLD patients, and the paucity of treatment options other than life- style measures—notoriously difficult to adhere to—make large-scale screenings for NAFLD highly unsuitable for the general population. Thus, screening efforts focused on individ- uals at higher risk of liver disease progression are likely to be far more rewarding. In this regard, T2DM patients are known not only to be at high risk for NAFLD development [5] but also to display a progression rate toward significant liver fibrosis double that observed in other NAFLD patients [6]. However, it is still unclear what are the determinants of this increased risk given the multifactorial etiology of diabetes [7]. Certainly, the perception of NAFLD among physicians caring for patients with T2DM varies widely, with normal aminotransferase test being a predictor for non-referral or no further diagnostic ex- ploration of T2DM patients among endocrinologists [8].
In recent years, the way clinicians approach a patient with suspected liver disease has been changed by the advent of tran- sient elastography (TE), a non-invasive technique which—by extrapolating the likelihood of fibrosis from liver stiffness (LS)—has greatly reduced the indications for a liver biopsy, perceived by many as unduly aggressive and costly [9]. Conve- niently, new TE machines have been implemented with a soft- ware able to quantify liver fat accurately, by measuring the controlled attenuation parameter (CAP). CAP identifies ste- atosis independently of the presence of fibrosis, which is not the case for ultrasound (US) [10]. Systematically performing TE with CAP measurement on patients with T2DM may thus offer the opportunity of unveiling the true burden of liver dis- ease in this condition, thereby increasing the awareness of its existence among non-hepatologists. At the same time, it makes possible exploring genetic and environmental risk factors as- sociated with NAFLD progression towards liver fibrosis among diabetics. With these aims in mind we performed the present study.
METHODS
Patients
All consecutive adult patients with T2DM evaluated at the dia- betes clinic of the Madonna del Popolo Hospital in Omegna and the Castelli Hospital in Verbania, in Northern Italy, from 1st March 2017 to 1st March 2018, were offered to participate to this study, according to the protocol approved by the local Ethical Committee (IRB No. 176/18). A written informed con- sent was obtained by all participants (n=328, of whom n=243 were males). The study was approved by the local Ethical Committee (Comitato Etico Interaziendale A.O.U. “Maggiore della Carità,” ASL BI, ASL NO, ASL VCO) and conducted in strict accordance with the principles of the Declaration of Hel- sinki.
The inclusion criteria were as follows: age ≥18 years and T2DM in pharmacological treatment. The exclusion criteria were as follows: positive serology for hepatitis C virus (HCV) infection, chronic hepatitis related to hepatitis B virus infec- tion, concomitance of other causes of chronic liver disease (e.g., autoimmune hepatitis, hemochromatosis, cholestatic liv- er disease, and drug damage), presence of focal liver lesions of suspected malignant origin, excess consumption of alcoholic beverages (≥3 drinks/day). Stage 2 or higher obesity (body mass index [BMI] ≥35 kg/m2), and inability to obtain valid TE measurements. We screened 432 patients. After applying the above mentioned criteria, 328 patients were enrolled. At enrol- ment, a blood sample was drawn, and the following data were registered:
(1) Age and gender
(2) Anthropometric data: these were collected with patients wearing only light underwear: the BMI was calculated as body weight divided by the square of the height (kg/m2) and interpreted according to World Health Organization classification.
(3) A biochemistry panel, including total cholesterol, high density lipoprotein and low density lipoprotein cholesterol, and triglycerides, all measured with enzymatic methods (ADVIA; Siemens, Leverkusen, Germany). Furthermore, glycosylated hemoglobin (HbA1c) was determined by high- pressure chromatography (Variant Biorad II; Biorad, Her- cules, CA, USA). Plasma glucose concentration was mea- sured by hexokinase (ADVIA). Aspartate aminotransferase (AST), alanine aminotransferase (ALT), and gamma-glu- tamyl transferase were measured with enzymatic methods
(Advia 1800 Chemistry System, Siemens).
NAFLD evaluation
All patients underwent US examination of the liver performed by a single expert clinician. A sagittal sonographic plane of sec- tion demonstrating liver parenchyma and the right kidney was selected to determine liver echogenicity and evaluated as fol- lows [11]:
(1) No steatosis: liver echogenicity comparable to the right kid- ney.
(2) Grade 1: slightly increased liver echogenicity with respect to the right kidney; echogenicity of the intrahepatic vessel walls and diaphragm was well visualized.
(3) Grade 2: moderate increase of liver echogenicity with re- spect to the right kidney, with slight decreased visibility of the intrahepatic vessel walls and decreased reflectivity of the diaphragm.
(4) Grade 3: severe steatosis was defined as diffusely increased echogenicity of the liver compared to the right kidney, a lack of visualization of intrahepatic vessel walls, and mark- edly decreased reflectivity of the hemidiaphragm.
LS was assessed by TE (FibroScan; Echosens, Paris, France).
TE was performed as reported by Sandrin et al. [12], using at least 10 valid measurements; examinations were considered reliable when interquartile range was <30% and the success rate was >60%. To define the presence of significant fibrosis, we used the cut-off value of 7.9 kPa, as proposed by others [13].
Moreover, we measured CAP, which allows noninvasive semi- quantitative assessment of liver fat content by measuring the attenuation at the center frequency of the FibroScan [14], en- suring that the liver ultrasonic attenuation was obtained simul- taneously from the same volume of liver parenchyma as that of LS. CAP values range from 100 to 400 dB/m: the cut-off values we chose to indicate steatosis as absent, mild, moderate and se- vere were <236, ≥236, ≥270, and ≥302, respectively [15].
NAFLD fibrosis score and fibrosis-4 (FIB-4) were calculated for each patient, as previously reported [16,17]. FIB-4 is an al- gorithm based on age, AST/ALT plasma levels, and platelets count; NAFLD fibrosis score relies on the same variables plus BMI and albumin concentration, also considering the presence of impaired fasting glucose or diabetes. Both scores were vali- dated for the estimation of fibrotic burden in NAFLD patients.
Genetic studies
Genomic DNA was extracted from whole blood or buffy coat
using a commercial kit (Invitrogen, Carlsbad, CA, USA), accord- ing to the manufacturer’s instructions. DNA was then ampli- fied by polymerase chain reaction (PCR). The PCR primers se- quences used for PNPLA3 amplification were: Forward: 5ʹ-CC- TGCAGGCAGGAGATGTGT-3ʹ; reverse: 5ʹ-GCCCTGCTC- ACTTGGAGAAA-3ʹ. The PCR primers sequences used for HSD17B13 amplification were: forward: 5ʹ-GTCTGAGGCAT- GAGAATTGCT-3ʹ; reverse: 5ʹ-GGCCTGTATTGGAGACA- GATG -3ʹ. To define the genotype of the two target genes, we per- formed a restriction fragment length PCR. NLA-III and TRU1I restriction enzymes (ThermoFisher Scientific, Waltham, MA, USA) were used to digest PNPLA3 and HSD17B13, respective- ly. All samples were amplified twice; when discordant, they were run a third time.
Statistical analysis
Statistical analysis of data was carried out with the statistical software package Stata version 13.1 (StataCorp LP, College Sta- tion, TX, USA). The measures of centrality and dispersion of data chosen were medians and interquartile ranges. Continu- ous variables were compared between groups by the Mann- Whitney test. The nonparametric test chosen to identify a trend across ordered groups was that developed by Cuzick.
The exact Fischer’s test and the Pearson’s chi-square test were used, as appropriate, to explore the associations of categorical variables. Inter-rater agreement was measured by means of κ statistics [18]. The association of hypothetical predictors with LS was modeled through a multiple linear regression model.
The chi-square G test “Goodness of Fit” was employed to verify whether the proportions of the two polymorphisms were dis- tributed in patients in accordance with the Hardy-Weinberg equation. The level of significance chosen for all statistical tests was 0.05 (two-tailed).
RESULTS
Characteristics of the study population
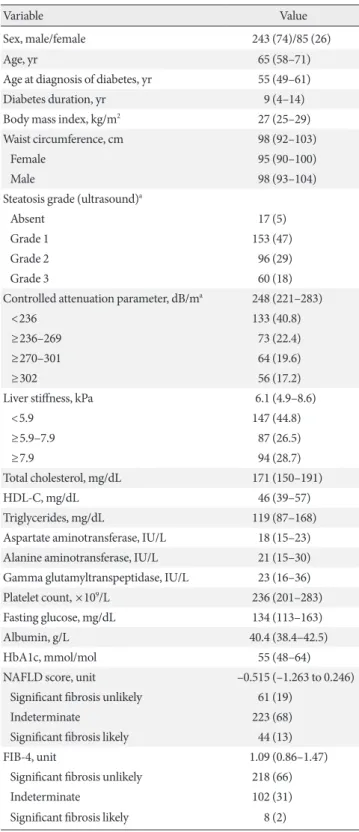
The main demographic and clinical characteristics of the study population are shown in Table 1. None of the patients was on high-dose vitamin E, pioglitazone, or sodium/glucose cotrans- porter 2 (SGLT2) inhibitors when recruited.
Prevalence and main features of NAFLD in T2DM
The median LS was 6.1 kPa, interquartile range 4.9 to 8.6. Fifty- four patients (16%) had either ASTs (n=24, 7%) or ALTs
(n=51, 16%) or both (n=21, 6%) above the upper normal limit.
A CAP value indicative of steatosis (i.e., ≥236 dB/m) was detected in 195 of 328 patients (59.5%). Fifty-five of 133 pa- tients, who did not show evidence of steatosis (41.3%), had LS values suggestive of fibrosis. Overall, the statistical association between CAP values suggestive of steatosis and LS values sug- gestive of fibrosis was highly significant (P<0.001).
Factors associated with significant fibrosis
Table 2 represents the univariate analysis of demographic, an- thropometric, and clinical factors associated with significant fi- brosis, defined as LS ≥7.9 kPa. The BMI was the strongest pre- dictor of LS suggestive of significant fibrosis, while age at onset of diabetes and diabetes duration had no appreciable effect. The agreement between the interpretation of the LS value, lumped into three ordinal categories—based on LS values ≤5.9, >5.9 but <7.9, and ≥7.9 kPa—and the categories of significant fibro- sis predicted by the NAFLD fibrosis score or those predicted by the Fib-4 was no better than that expected by chance (κ=
–0.020, P=0.746; and κ=0.013, P=0.363, respectively). A bet- ter agreement was observed between NAFLD fibrosis score and Fib-4 (κ=0.106, P<0.001). This was however considered to be slight according to the Landis and Koch’s scale [18].
Influence of genetic factors on NAFLD severity
Table 3 lists genotype and allele frequencies of the rs738409 (PNPLA3) single nucleotide polymorphism (SNP) and the in- sertion variant rs72613567 (HSD17B13) in the study popula- tion.
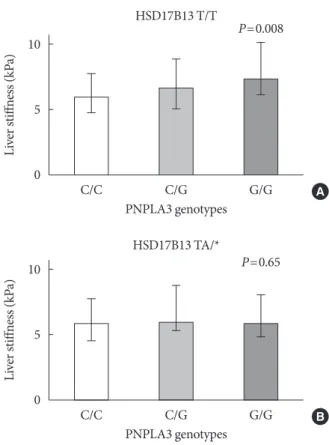
As shown in Fig. 1, the median LS increases from 5.9 kPa (4.7 to 7.7) in wild type (WT) C/C homozygotes to 6.1 kPa (5.2 to 8.7) in C/G heterozygotes and 6.8 kPa (5.8 to 9.2) in mutated (G/G) homozygotes. This trend was statistically significant (P=0.01). To investigate whether carriage of specific HSD17B13 alleles modulated the aforementioned effect, we divided the population into two groups based on rs72613567, analyzed ac- cording to a dominant model. In WT homozygotes, the asso- ciation between PNPLA3 genotype and LS was fully main- tained (C/C: 5.9 kPa [4.8 to 7.7]; C/G: 6.6 kPa [5.1 to 8.8]; G/G:
7.3 kPa [6.1 to 10.1]; P=0.008) (Fig. 2A). On the other hand, in the subgroup of patients carrying the HSD17B13 variant allele the trend toward progressively higher LS disappeared com- pletely (C/C: 5.7 kPa [4.6 to 7.7]; C/G: 5.4 kPa [5.2 to 8.6]; G/G:
5.4 kPa [4.8 to 5.8]; P=0.65) (Fig. 2B). In contrast to what ob- served for LS and PNPLA3 genotype, the association between Table 1. Main demographic and clinical characteristics of type
2 diabetes mellitus patients (n=328)
Variable Value
Sex, male/female 243 (74)/85 (26)
Age, yr 65 (58–71)
Age at diagnosis of diabetes, yr 55 (49–61)
Diabetes duration, yr 9 (4–14)
Body mass index, kg/m2 27 (25–29)
Waist circumference, cm 98 (92–103)
Female 95 (90–100)
Male 98 (93–104)
Steatosis grade (ultrasound)a
Absent 17 (5)
Grade 1 153 (47)
Grade 2 96 (29)
Grade 3 60 (18)
Controlled attenuation parameter, dB/ma 248 (221–283)
<236 133 (40.8)
≥236–269 73 (22.4)
≥270–301 64 (19.6)
≥302 56 (17.2)
Liver stiffness, kPa 6.1 (4.9–8.6)
<5.9 147 (44.8)
≥5.9–7.9 87 (26.5)
≥7.9 94 (28.7)
Total cholesterol, mg/dL 171 (150–191)
HDL-C, mg/dL 46 (39–57)
Triglycerides, mg/dL 119 (87–168)
Aspartate aminotransferase, IU/L 18 (15–23) Alanine aminotransferase, IU/L 21 (15–30) Gamma glutamyltranspeptidase, IU/L 23 (16–36)
Platelet count, ×109/L 236 (201–283)
Fasting glucose, mg/dL 134 (113–163)
Albumin, g/L 40.4 (38.4–42.5)
HbA1c, mmol/mol 55 (48–64)
NAFLD score, unit –0.515 (–1.263 to 0.246)
Significant fibrosis unlikely 61 (19)
Indeterminate 223 (68)
Significant fibrosis likely 44 (13)
FIB-4, unit 1.09 (0.86–1.47)
Significant fibrosis unlikely 218 (66)
Indeterminate 102 (31)
Significant fibrosis likely 8 (2)
Values are presented as number (%) or median (interquartile range).
HDL-C, high density lipoprotein cholesterol; HbA1c, glycosylated hemo- globin; NAFLD, nonalcoholic fatty liver disease; FIB-4, fibrosis-4.
aData missing for two patients.
CAP and the latter did not reach statistical significance. In- deed, the median CAP was 243.5 dB/m (219.0 to 277.0) in WT C/C homozygotes, 249.0 dB/m (221.0 to 284.0) in C/G hetero- zygotes, and 266.0 dB/m (224.0 to 308.0) in mutated (G/G) homozygotes (P=0.127). Moreover, HSD17B13 genotypes were clearly not related to CAP (P=0.806).
Interaction between genetic and environmental factors To verify how genetic and environmental factors interact in determining the risk of severe NAFLD in T2DM, a multiple linear regression model was built to predict LS from age, gen- der, BMI, disease duration, HbA1c and PNPLA3 genotype. A significant regression equation was found (F=5.07; df=6; R2= 0.087), indicating that both BMI and PNPLA3 genotype were Table 2. Univariate analysis of factors associated with significant liver fibrosis defined as liver stiffness ≥7.9 kPa
Variable LS <7.9 kPa (n=234) LS ≥7.9 kPa (n=94) P value
Male sex 179 (24) 64 (68) 0.126
Age, yr 64 (58–71) 66 (58–71) 0.877
Age at diagnosis of diabetes, yr 54 (47–61) 56 (50–61) 0.132
Diabetes duration, yr 10 (5–15) 8 (3–12) 0.126
Body mass index, kg/m2 26.6 (24.5–29.0) 28.0 (26.4–30.4) <0.001
Waist circumference, cm 97 (90–101) 100 (95–107) 0.004
Female (n=85) 94 (90–99) 98 (90–103) 0.153
Male (n=179) 98 (92–103) 100 (95–107) 0.008
Steatosis grade (ultrasound)a
Absent 14 (6) 3 (3)
Grade 1 122 (53) 31 (33)
Grade 2 62 (27) 34 (36)
Grade 3 34 (15) 26 (28) 0.002
CAP, dB/m 242 (219–280) 266 (228–300) 0.022
Total cholesterol, mg/dL 170 (150–191) 172 (148–196) 0.865
HDL-C, mg/dL 47 (39–57) 44 (38–55) 0.171
Triglycerides, mg/dL 118 (81–153) 122 (98–194) 0.006
Aspartate aminotransferase, IU/L 17 (15–21) 22 (16–35) 0.001
>Upper normal limit 6 (3) 18 (19) <0.001
Alanine aminotransferase, IU/L 20 (15–27) 25 (18–46) <0.001
>Upper normal limit 22 (9) 29 (31) <0.001
Gamma glutamyltranspeptidase, IU/L 21 (16–31) 30 (17–44) 0.001
>Upper normal limit 20 (9) 17 (18) 0.020
Platelet count, ×109/L 237 (201–284) 236 (201–284) 0.887
Fasting glucose, mg/dL 134 (113–160) 130 (109–168) 0.796
Albumin, g/L 40.4 (38.3–42.5) 40.4 (38.7–42.5) 0.913
HbA1c, mmol/mol 56 (48–65) 54 (48–60) 0.259
NAFLD score, unit –0.531 (–1.351 to 0.271) –0.447 (–0.861 to 0.092) 0.368
FIB-4, unit 1.07 (0.83–1.4) 1.18 (0.9–1.65) 0.048
Values are presented as number (%) or median (interquartile range).
LS, liver stiffness; CAP, controlled attenuation parameter; HDL-C, high density lipoprotein cholesterol; HbA1c, glycosylated hemoglobin;
NAFLD, nonalcoholic fatty liver disease; FIB-4, fibrosis-4.
aData missing for two patients.
independent predictors of LS. Patients’ predicted LS was equal to 1.023+0.028 (BMI in kg/m2)+0.078 (PNPLA3 genotype, coded 0, 1, or 2 according to the number of G alleles present).
Based on this model, the predicted value of LS may vary from one reassuringly normal for patients with normal BMI who are rs738409 C/C homozygotes to another suggestive of progres- sion to frank cirrhosis in obese patients who are rs738409 G/G homozygotes (Fig. 3).
Interestingly, in patients carrying at least one mutated allele in the HSD17B13 gene, no predictor was identified according to the same linear regression model. Conversely, in WT HS- D17B13 subjects, the analysis replicated the findings obtained in the entire study population: F=5.36; df=6; R2=0.130; LS=
1.239+0.030 (BMI in kg/m2)+0.085 (PNPLA3 genotype, coded 0, 1 or, 2 according to the number of G alleles present).
Table 3. Genotype and allele frequencies of the genes of interest
PNPLA3 (n=328) HSD17B13 (n=328)
C/C 154 (0.47) T/T 223 (0.68)
C/G 139 (0.42) T/TA 90 (0.27)
G/G 35 (0.11) TA/TA 15 (0.05)
G/* 174 (0.53) TA/* 105 (0.32)
C 447 (0.68) T 536 (0.82)
G 209 (0.32) TA 120 (0.18)
HWE 0.66 HWE 0.14
The P values test the hypothesis of deviation from Hardy-Weinberg equilibrium (HWE).
PNPLA3, patatin like phospholipase domain containing 3; HS- D17B13, 17β-hydroxysteroid-dehydrogenase type 13.
Fig. 1. Liver stiffness (kPa) distribution based on patatin like phospholipase domain containing 3 (PNPLA3) genotypes.
Columns indicate medians, error bars interquartile ranges.
10 8 6 4 2 0
12.5 10.0 7.5 5.0 2.5 0 10
5
0
10
5
0
Liver stiffness (kPa) Liver stiffness (kPa)Liver stiffness (kPa)Liver stiffness (kPa)
C/C
C/C C/G G/G
BMI=24 BMI=31
C/C C/G G/G C/C
C/C PNPLA3
HSD17B13 T/T
HSD17B13 TA/*
C/G
C/G
C/G PNPLA3 genotypes
PNPLA3 genotypes
G/G
G/G
G/G P=0.01
P=0.008
P=0.65
Fig. 3. Predicted values of liver stiffness (LS) (kPa), based on patatin like phospholipase domain containing 3 (PNPLA3) genotype and body mass index (BMI). Error bars indicate 95%
confidence intervals. The upper horizontal dotted line indi- cates LS value suggestive of cirrhosis, the lower one the value suggestive of absent or minimal fibrosis.
Fig. 2. Liver stiffness (kPa) distribution among patatin like phospholipase domain containing 3 (PNPLA3) genotypes among 17β-hydroxysteroid-dehydrogenase type 13 (HSD- 17B13) (A) wild type and (B) mutated carriers. Columns indi- cate medians, error bars interquartile ranges. HSD17B13 T/T (wild type), HSD17B13 TA/* (heterozygous and/or homozy- gous “A” insertional mutation).
A
B
DISCUSSION
In the present study, we show that—in an unselected cohort of non-morbidly obese T2DM patients—the prevalence of severe NAFLD is substantial. Anthropometric characteristics of pa- tients explain most of the variability observed, with a signifi- cant contribution afforded by genes controlling lipogenesis and lipolysis. Remarkably, age and duration of T2DM appear not to contribute significantly to the prevalence of NAFLD.
These findings and their possible clinical implications in the context of existing literature are discussed below.
The epidemic diffusion of obesity and T2DM, along with the improvement in HCV eradication thanks to antiviral agents, has made NAFLD the main cause of chronic liver disease and cirrhosis worldwide [19]. According to a recent projection, by 2030 the prevalence of NASH will have increased by 15% to 56%, while liver mortality and significant liver disease will have more than doubled as result of an aging/increasing population [20].
The natural history of NAFLD can vary significantly from patient to patient. Typically, NAFLD is a slowly progressive disease, with the vast majority of NAFLD patients never devel- oping end-stage liver disease. The rate of progression is equal to one stage of fibrosis every 14 years in NAFLD, and every 7 years in NASH. However, in 20% of cases fibrosis progresses more rapidly [21]. Therefore, a significant proportion of NAFLD patients will experience liver-related complications, thus making an accurate risk prediction even more difficult.
In this context, T2DM patients are of major interest. First of all, the prevalence of NAFLD is higher in T2DM patients than in the general population [22]. Moreover, patients with estab- lished T2DM are more likely to suffer from more severe histo- logical forms of NAFLD, even in cases where aminotransferase serum levels are normal [23], being aminotransferase levels an unreliable marker of NAFLD among patients with T2DM. Fi- nally, the coexistence of NAFLD and T2DM typically worsens the course of both diseases [24].
However, despite the importance that should be given by cli- nicians to the diagnosis and treatment of NAFLD in T2DM pa- tients, the usefulness of screening strategies to detect NAFLD has been recently questioned given our incomplete understand- ing of the natural history of this disease.
In our study, we highlight the essential contribution of excess body weight to liver fibrosis progression. In good agreement, a study on a cohort of 1,527 T2DM and NAFLD patients has re-
cently shown that BMI is a predictor of FIB-4 score both at baseline and after 3 years of follow-up [25]. The reason why obesity negatively impacts liver functions is probably due to the fact that the adipose tissue, in obese subjects, acquires a proinflammatory, profibrogenic, and proangiogenic pheno- type, resulting in abnormal production of adipokines and cy- tokines (e.g., leptin, interleukin [IL]-1, IL-6, and tumor necro- sis factor-α [TNF-α]) involved in liver pathogenesis. For in- stance, leptin contributes to neoangiogenesis and directly modulates hepatic stellate cells in a profibrogenic manner [26].
Contextually, chemokines and proinflammatory cytokines, such as IL-1, IL-6, and TNF-α mediate macrophage infiltra- tion, which causes adipose tissue “inflammation” in obese sub- jects, resulting in insulin resistance and deregulated secretion of adipokines [27]. Interestingly, obesity contributes not only to liver fibrosis progression but also to the complications brought by cirrhosis. In this regard, obesity is an independent risk factor for clinical cirrhosis decompensation, where dys- regulated cytokines could contribute to worsening intrahepatic resistance and portal hypertension [28,29]. Moreover, obesity is a well known independent risk factor for the development of HCC [30]. Finally, hypovitaminosis D is highly prevalent in obese subjects due to the fact that vitamin D is a fat-soluble molecule stored in the adipose tissue [31]. In this regard, the severity of NAFLD has been inversely correlated with plasma vitamin D levels [32], possibly because vitamin D plays an an- tifibrogenic and anti-inflammatory role [33], similar to what observed in other inflammatory diseases [34].
Besides environmental factors and comorbidities, other ge- netic and epigenetic predictors of liver disease progression have been identified in recent years [35]. The strongest genetic predictor of chronic liver disease progression is the SNP rs738409 in PNLPA3 gene. This gene encodes a membrane bound triacylglycerol lipase that mediates triacylglycerol hy- drolysis. As PNPLA3 mutation has been robustly associated to steatosis, fibrosis/cirrhosis, and HCC on a background of met- abolic, alcoholic, and viral insults [36], in the present study we sought to determine whether PNPLA3 mutation was associat- ed with severity of liver disease. Previously, an increased risk of liver fibrosis was reported in T2DM patients carrying the mu- tated variant of rs738409 [37], although the estimation of liver fibrosis was based upon Fibrotest rather than on LS. From our data, we confirm the existence of a significant trend toward in- creasing LS in heterozygotes or mutated homozygotes over WT individuals. In particular, our results indicate that in
T2DM patients PNLPA3 is associated with a significant risk of liver disease progression, although the strength of this associa- tion might be less relevant than in the general population probably because mainly driven by excess BMI and, by exten- sion, body fat.
Another controversial point is that the association between PNPLA3 and liver fibrosis does not automatically imply a causal relationship. However, the observation that insulin reg- ulates PNPLA3 gene expression [38] strongly argues in favor of a potential link between liver fibrosis progression and adipo- nutrin. Fittingly, adenovirus-mediated liver expression of a mis- sense mutant form of PNPLA3 in mice was sufficient to abol- ish the hydrolase activity of adiponutrin leading to triglyceride accumulation, suggesting a possible cause-effect relationship between PNPLA3 polymorphism and development of steato- sis and fibrosis [39]. Furthermore, in humans the missense mutation leads not only to intrahepatic remodeling but also to impairment of the fat efflux pathway from the liver, which seems to be caused by a reduction in very low density lipopro- teins secretion [40].
It is also important to consider that PNPLA3 is expressed by human hepatic stellate cells, where adiponutrin catalyzes the hydrolysis of retinyl esters [41]. Consistently, the missense mu- tation of PNPLA3 gene is associated with lower circulating concentrations of free retinol [42] and higher intrahepatic con- centrations of retinol [43], although whether this may contrib- ute to fibrosis has yet to be defined.
Another important aspect further supporting a cause-effect link between PNPLA3 and liver fibrosis is that NAFLD pa- tients carrying the variant rs738409 allele display prominent activation of the hepatic stem/progenitor cell niche, which is associated with a more aggressive histological pattern (i.e., portal fibrogenesis) and increased oxidative stress [44].
Although the association between PNPLA3 gene and liver steatosis/fibrosis is well established, the pathogenetic mecha- nism underlying this association still remains unclear. In this regard, the detrimental impact of carrying the variant rs- 738409 allele has been recently shown to be mitigated by a concomitant mutation in the HSD17B13 gene in the general population [3]. In this regard, one of the main findings of our study is that the rs72613567:TA mutation is associated with a lower risk of liver fibrosis progression also in case of T2DM, as shown for the general population. We find that the association between the variant rs738409 allele and severe NAFLD is fully maintained in WT HSD17B13 carriers. By contrast, in those
patients carrying at least one mutated allele, PNPLA3 does not predict LS any longer. This suggests a potential protective role of such mutation, although the cross-sectional design of our study does not allow drawing definitive conclusions. In this re- gard, the reason why this mutation seems to play a protective role against liver diseases, mitigating the detrimental effect of the variant rs738409 allele, has yet to be determined. Su et al.
[45] showed HSD17B13 WT mRNA upregulation in NAFLD patients. Moreover, overexpression of HSD17B13 in the livers of C57BL/6 mice and cultured hepatocyte cell lines enhanced substantially lipogenesis and increased the number and size of lipid droplets [45]. In the same study, upregulation of HS- D17B13 was observed in the livers of both diabetic mice and high-fat diet-fed mice, suggesting that HSD17B13 may play a crucial role in the pathogenesis of fatty liver and may also be relevant in diabetes. Abul-Husn et al. [3] demonstrated in a large liver impairment patient cohort the important effect of HSD17B13 variant. The insertion of “A” in a splice donor site led to a protein-truncating isoform [3]. The same group, through RNA sequencing-based expression analysis demon- strated that HSD17B13 variant was associated with decreased PNPLA3 mRNA expression in an allele-dependent manner.
Similarly, the 434K allele of PNPLA3 could mitigate the effect of the PNPLA3 I148M allele on chronic liver disease by reduc- ing hepatic PNPLA3 mRNA and protein expression [46].
As expected, we found a strong correlation between steatosis development and T2DM, implying that the genetic component only exerts a marginal effect. This supports the hypothesis that, while fatty liver is a very common condition in T2DM patients, the development of liver fibrosis is significantly influenced by PNPLA3.
From a clinical standpoint, being obvious that major efforts should be devoted to correct excess body weight in T2DM, we provide further reasons to diabetologists to do so, by adding to the potential benefits of losing weight the reduced risk of pro- gressive liver disease. Furthermore, our findings indicate that PNLPA3 and HSD13B17 products might represent potential therapeutic targets in the prevention of liver disease progres- sion in T2DM patients. Though both variants might be worth of consideration in the construction of prediction models aimed to improve NAFLD detection in patients with T2DM, the inclusion of periodic TE examinations during patient eval- uation would result in a cheaper and more direct screening protocol.
Among the several limitations of our study, we must ac-
knowledge the fact that TE is not the ideal method to charac- terize NAFLD. It is inferior to magnetic resonance based-tech- niques [15] and has not stood the test of time like liver biopsy.
However, it is far more applicable than both techniques to clin- ical practice. Moreover, being a cross-sectional study we can- not provide date on the effect, if any, that prolonged inadequate control of T2DM might have on fibrosis progression, although punctual data at the time of our study appear not to point in that direction.
In conclusion, patients with T2DM have a high prevalence of liver disease characterized by significant fibrosis, which goes largely undetected in the absence of symptoms and striking laboratory abnormalities. Obesity and, to a minor but not neg- ligible extent, genetic factors contribute to its development.
CONFLICTS OF INTEREST
No potential conflict of interest relevant to this article was re- ported.
AUTHOR CONTRIBUTIONS
Conception or design: M.B., C.C., M.N.B., L.S., R.C., V.R.M., L.M.C., G.S., G.P.C.S., R.M., M.P.
Acquisition, analysis, or interpretation of data: M.B., C.C., M.N.B., L.S., R.C., V.R.M., L.M.C., G.S., G.P.C.S., R.M., M.P.
Drafting the work or revising: M.B., C.C., M.P.
Final approval of the manuscript: M.B., C.C., M.N.B., L.S., R.C., V.R.M., L.M.C., G.S, G.P.C.S., R.M., M.P.
ORCID
Mattia Bellan https://orcid.org/0000-0003-1488-8736 Cosimo Colletta https://orcid.org/0000-0002-5910-3253
ACKNOWLEDGMENTS
None
REFERENCES
1. Masuoka HC, Chalasani N. Nonalcoholic fatty liver disease: an emerging threat to obese and diabetic individuals. Ann N Y Acad Sci 2013;1281:106-22.
2. Lonardo A, Nascimbeni F, Maurantonio M, Marrazzo A, Rin-
aldi L, Adinolfi LE. Nonalcoholic fatty liver disease: evolving paradigms. World J Gastroenterol 2017;23:6571-92.
3. Abul-Husn NS, Cheng X, Li AH, Xin Y, Schurmann C, Stevis P, Liu Y, Kozlitina J, Stender S, Wood GC, Stepanchick AN, Still MD, McCarthy S, O’Dushlaine C, Packer JS, Balasubramanian S, Gosalia N, Esopi D, Kim SY, Mukherjee S, Lopez AE, Fuller ED, Penn J, Chu X, Luo JZ, Mirshahi UL, Carey DJ, Still CD, Feldman MD, Small A, Damrauer SM, Rader DJ, Zambrowicz B, Olson W, Murphy AJ, Borecki IB, Shuldiner AR, Reid JG, Overton JD, Yancopoulos GD, Hobbs HH, Cohen JC, Gottes- man O, Teslovich TM, Baras A, Mirshahi T, Gromada J, Dewey FE. A protein-truncating HSD17B13 variant and protection from chronic liver disease. N Engl J Med 2018;378:1096-106.
4. European Association for the Study of the Liver (EASL); Euro- pean Association for the Study of Diabetes (EASD); European Association for the Study of Obesity (EA-SO). EASL-EASD- EASO Clinical Practice Guidelines for the management of non-alcoholic fatty liver disease. J Hepatol 2016;64:1388-402.
5. Byrne CD, Targher G. NAFLD: a multisystem disease. J Hepa- tol 2015;62:S47-64.
6. Simeone JC, Bae JP, Hoogwerf BJ, Li Q, Haupt A, Ali AK, Boardman MK, Nordstrom BL. Clinical course of nonalcohol- ic fatty liver disease: an assessment of severity, progression, and outcomes. Clin Epidemiol 2017;9:679-88.
7. Targher G, Marchesini G, Byrne CD. Risk of type 2 diabetes in patients with non-alcoholic fatty liver disease: causal associa- tion or epiphenomenon? Diabetes Metab 2016;42:142-56.
8. Ratziu V, Cadranel JF, Serfaty L, Denis J, Renou C, Delassalle P, Bernhardt C, Perlemuter G. A survey of patterns of practice and perception of NAFLD in a large sample of practicing gas- troenterologists in France. J Hepatol 2012;57:376-83.
9. Castera L. Non-invasive diagnosis of steatosis and fibrosis. Dia- betes Metab 2008;34:674-9.
10. Hernaez R, Lazo M, Bonekamp S, Kamel I, Brancati FL, Gual- lar E, Clark JM. Diagnostic accuracy and reliability of ultraso- nography for the detection of fatty liver: a meta-analysis. Hepa- tology 2011;54:1082-90.
11. Qayyum A, Chen DM, Breiman RS, Westphalen AC, Yeh BM, Jones KD, Lu Y, Coakley FV, Callen PW. Evaluation of diffuse liver steatosis by ultrasound, computed tomography, and mag- netic resonance imaging: which modality is best? Clin Imaging 2009;33:110-5.
12. Sandrin L, Fourquet B, Hasquenoph JM, Yon S, Fournier C, Mal F, Christidis C, Ziol M, Poulet B, Kazemi F, Beaugrand M, Palau R. Transient elastography: a new non-invasive method
for assessment of hepatic fibrosis. Ultrasound Med Biol 2003;
29:1705-13.
13. Wong VW, Vergniol J, Wong GL, Foucher J, Chan HL, Le Bail B, Choi PC, Kowo M, Chan AW, Merrouche W, Sung JJ, de Ledinghen V. Diagnosis of fibrosis and cirrhosis using liver stiffness measurement in nonalcoholic fatty liver disease. Hep- atology 2010;51:454-62.
14. de Ledinghen V, Vergniol J, Foucher J, Merrouche W, le Bail B.
Noninvasive diagnosis of liver steatosis using controlled atten- uation parameter (CAP) and transient elastography. Liver Int 2012;32:911-8.
15. Imajo K, Kessoku T, Honda Y, Tomeno W, Ogawa Y, Mawatari H, Fujita K, Yoneda M, Taguri M, Hyogo H, Sumida Y, Ono M, Eguchi Y, Inoue T, Yamanaka T, Wada K, Saito S, Nakajima A.
Magnetic resonance imaging more accurately classifies steato- sis and fibrosis in patients with nonalcoholic fatty liver disease than transient elastography. Gastroenterology 2016;150:626- 37.
16. Angulo P, Hui JM, Marchesini G, Bugianesi E, George J, Farrell GC, Enders F, Saksena S, Burt AD, Bida JP, Lindor K, Sander- son SO, Lenzi M, Adams LA, Kench J, Therneau TM, Day CP.
The NAFLD fibrosis score: a noninvasive system that identifies liver fibrosis in patients with NAFLD. Hepatology 2007;45:846- 54.
17. Martinez SM, Crespo G, Navasa M, Forns X. Noninvasive as- sessment of liver fibrosis. Hepatology 2011;53:325-35.
18. Landis JR, Koch GG. An application of hierarchical kappa-type statistics in the assessment of majority agreement among mul- tiple observers. Biometrics 1977;33:363-74.
19. Pimpin L, Cortez-Pinto H, Negro F, Corbould E, Lazarus JV, Webber L, Sheron N; EASL HEPAHEALTH Steering Commit- tee. Burden of liver disease in Europe: epidemiology and analy- sis of risk factors to identify prevention policies. J Hepatol 2018;69:718-35.
20. Estes C, Anstee QM, Arias-Loste MT, Bantel H, Bellentani S, Caballeria J, Colombo M, Craxi A, Crespo J, Day CP, Eguchi Y, Geier A, Kondili LA, Kroy DC, Lazarus JV, Loomba R, Manns MP, Marchesini G, Nakajima A, Negro F, Petta S, Ratziu V, Romero-Gomez M, Sanyal A, Schattenberg JM, Tacke F, Tana- ka J, Trautwein C, Wei L, Zeuzem S, Razavi H. Modeling NAFLD disease burden in China, France, Germany, Italy, Ja- pan, Spain, United Kingdom, and United States for the period 2016-2030. J Hepatol 2018;69:896-904.
21. Singh S, Allen AM, Wang Z, Prokop LJ, Murad MH, Loomba R. Fibrosis progression in nonalcoholic fatty liver vs nonalco-
holic steatohepatitis: a systematic review and meta-analysis of paired-biopsy studies. Clin Gastroenterol Hepatol 2015;13:
643-54.
22. Targher G, Bertolini L, Padovani R, Rodella S, Tessari R, Zenari L, Day C, Arcaro G. Prevalence of nonalcoholic fatty liver dis- ease and its association with cardiovascular disease among type 2 diabetic patients. Diabetes Care 2007;30:1212-8.
23. Portillo-Sanchez P, Bril F, Maximos M, Lomonaco R, Biernacki D, Orsak B, Subbarayan S, Webb A, Hecht J, Cusi K. High prevalence of nonalcoholic fatty liver disease in patients with type 2 diabetes mellitus and normal plasma aminotransferase levels. J Clin Endocrinol Metab 2015;100:2231-8.
24. Loria P, Lonardo A, Anania F. Liver and diabetes. A vicious cir- cle. Hepatol Res 2013;43:51-64.
25. Giorda CB, Forlani G, Manti R, Mazzotti A, De Cosmo S, Rossi MC, Nicolucci A, Di Bartolo P, Ceriello A, Guida P, Tartaglino B, Russo G; AMD-Annals Study Group. Trend over time in he- patic fibrosis score in a cohort of type 2 diabetes patients. Dia- betes Res Clin Pract 2018;135:65-72.
26. Aleffi S, Petrai I, Bertolani C, Parola M, Colombatto S, Novo E, Vizzutti F, Anania FA, Milani S, Rombouts K, Laffi G, Pinzani M, Marra F. Upregulation of proinflammatory and proangio- genic cytokines by leptin in human hepatic stellate cells. Hepa- tology 2005;42:1339-48.
27. Marra F, Bertolani C. Adipokines in liver diseases. Hepatology 2009;50:957-69.
28. Fernandez M, Semela D, Bruix J, Colle I, Pinzani M, Bosch J.
Angiogenesis in liver disease. J Hepatol 2009;50:604-20.
29. Berzigotti A, Garcia-Tsao G, Bosch J, Grace ND, Burroughs AK, Morillas R, Escorsell A, Garcia-Pagan JC, Patch D, Matloff DS, Groszmann RJ; Portal Hypertension Collaborative Group.
Obesity is an independent risk factor for clinical decompensa- tion in patients with cirrhosis. Hepatology 2011;54:555-61.
30. Noureddin M, Rinella ME. Nonalcoholic fatty liver disease, di- abetes, obesity, and hepatocellular carcinoma. Clin Liver Dis 2015;19:361-79.
31. Wortsman J, Matsuoka LY, Chen TC, Lu Z, Holick MF. De- creased bioavailability of vitamin D in obesity. Am J Clin Nutr 2000;72:690-3. Erratum in: Am J Clin Nutr 2003;77:1342.
32. Dasarathy J, Periyalwar P, Allampati S, Bhinder V, Hawkins C, Brandt P, Khiyami A, McCullough AJ, Dasarathy S. Hypovita- minosis D is associated with increased whole body fat mass and greater severity of non-alcoholic fatty liver disease. Liver Int 2014;34:e118-27.
33. Cimini FA, Barchetta I, Carotti S, Bertoccini L, Baroni MG,
Vespasiani-Gentilucci U, Cavallo MG, Morini S. Relationship between adipose tissue dysfunction, vitamin D deficiency and the pathogenesis of non-alcoholic fatty liver disease. World J Gastroenterol 2017;23:3407-17.
34. Bellan M, Sainaghi PP, Pirisi M. Role of vitamin D in rheuma- toid arthritis. Adv Exp Med Biol 2017;996:155-68.
35. Del Campo JA, Gallego-Duran R, Gallego P, Grande L. Genetic and epigenetic regulation in nonalcoholic fatty liver disease (NAFLD). Int J Mol Sci 2018;19:E911.
36. Trepo E, Romeo S, Zucman-Rossi J, Nahon P. PNPLA3 gene in liver diseases. J Hepatol 2016;65:399-412.
37. Petit JM, Guiu B, Masson D, Duvillard L, Jooste V, Buffier P, Bouillet B, Brindisi MC, Robin I, Gambert P, Verges B, Cercueil JP, Hillon P. PNPLA3 polymorphism influences liver fibrosis in unselected patients with type 2 diabetes. Liver Int 2011;31:
1332-6.
38. Dubuquoy C, Robichon C, Lasnier F, Langlois C, Dugail I, Foufelle F, Girard J, Burnol AF, Postic C, Moldes M. Distinct regulation of adiponutrin/PNPLA3 gene expression by the transcription factors ChREBP and SREBP1c in mouse and hu- man hepatocytes. J Hepatol 2011;55:145-53.
39. He S, McPhaul C, Li JZ, Garuti R, Kinch L, Grishin NV, Cohen JC, Hobbs HH. A sequence variation (I148M) in PNPLA3 as- sociated with nonalcoholic fatty liver disease disrupts triglycer- ide hydrolysis. J Biol Chem 2010;285:6706-15.
40. Pirazzi C, Adiels M, Burza MA, Mancina RM, Levin M, Stahl- man M, Taskinen MR, Orho-Melander M, Perman J, Pujia A, Andersson L, Maglio C, Montalcini T, Wiklund O, Boren J, Romeo S. Patatin-like phospholipase domain-containing 3 (PNPLA3) I148M (rs738409) affects hepatic VLDL secretion in humans and in vitro. J Hepatol 2012;57:1276-82.
41. Pirazzi C, Valenti L, Motta BM, Pingitore P, Hedfalk K, Manci-
na RM, Burza MA, Indiveri C, Ferro Y, Montalcini T, Maglio C, Dongiovanni P, Fargion S, Rametta R, Pujia A, Andersson L, Ghosal S, Levin M, Wiklund O, Iacovino M, Boren J, Romeo S.
PNPLA3 has retinyl-palmitate lipase activity in human hepatic stellate cells. Hum Mol Genet 2014;23:4077-85.
42. Mondul A, Mancina RM, Merlo A, Dongiovanni P, Rametta R, Montalcini T, Valenti L, Albanes D, Romeo S. PNPLA3 I148M variant influences circulating retinol in adults with nonalco- holic fatty liver disease or obesity. J Nutr 2015;145:1687-91.
43. Kovarova M, Konigsrainer I, Konigsrainer A, Machicao F, Har- ing HU, Schleicher E, Peter A. The genetic variant I148M in PNPLA3 is associated with increased hepatic retinyl-palmitate storage in humans. J Clin Endocrinol Metab 2015;100: E1568- 74.
44. Carpino G, Pastori D, Baratta F, Overi D, Labbadia G, Polimeni L, Di Costanzo A, Pannitteri G, Carnevale R, Del Ben M, Arca M, Violi F, Angelico F, Gaudio E. PNPLA3 variant and portal/
periportal histological pattern in patients with biopsy-proven non-alcoholic fatty liver disease: a possible role for oxidative stress. Sci Rep 2017;7:15756.
45. Su W, Wang Y, Jia X, Wu W, Li L, Tian X, Li S, Wang C, Xu H, Cao J, Han Q, Xu S, Chen Y, Zhong Y, Zhang X, Liu P, Gustafs- son JA, Guan Y. Comparative proteomic study reveals 17β- HSD13 as a pathogenic protein in nonalcoholic fatty liver dis- ease. Proc Natl Acad Sci U S A 2014;111:11437-42.
46. Donati B, Motta BM, Pingitore P, Meroni M, Pietrelli A, Alisi A, Petta S, Xing C, Dongiovanni P, del Menico B, Rametta R, Mancina RM, Badiali S, Fracanzani AL, Craxi A, Fargion S, Nobili V, Romeo S, Valenti L. The rs2294918 E434K variant modulates patatin-like phospholipase domain-containing 3 expression and liver damage. Hepatology 2016;63:787-98.