INTRODUCTION
Non-alcoholic fatty liver disease (NAFLD) is the most com- mon cause of abnormalities in liver function and imaging de- tected by ultrasonography.1,2 The prevalence of NAFLD is as- sumed to be 20–30% in Western countries, and the incidence in Asian countries is rapidly increasing in parallel with the westernization of lifestyle.3-5 The main concern over NAFLD arises from its tight correlation with metabolic disorders such as obesity, dyslipidemia, and type 2 diabetes mellitus (T2DM).6-9 Previous studies have revealed the relationship between
The Relationship between Type 2 Diabetes Mellitus and Non-Alcoholic Fatty Liver Disease Measured
by Controlled Attenuation Parameter
Young Eun Chon
1*, Kwang Joon Kim
2,3*, Kyu Sik Jung
1, Seung Up Kim
1, Jun Yong Park
1, Do Young Kim
1, Sang Hoon Ahn
1, Chae Yoon Chon
1, Jae Bock Chung
1,3,
Kyeong Hye Park
3, Ji Cheol Bae
4, and Kwang-Hyub Han
11Division of Gastroenterology, Department of Internal Medicine, Yonsei University College of Medicine, Liver Cirrhosis Clinical Research Center, Seoul;
2Division of Endocrinology and Metabolism, Department of Internal Medicine, Yonsei University College of Medicine, Seoul;
3Executive Healthcare Clinic, Severance Hospital, Yonsei Health System, Seoul;
4Division of Endocrinology and Metabolism, Department of Internal Medicine, Samsung Medical Center, Sungkyunkwan University School of Medicine, Seoul, Korea.
Purpose: The severity of non-alcoholic fatty liver disease (NAFLD) in type 2 diabetes mellitus (T2DM) population compared with that in normal glucose tolerance (NGT) individuals has not yet been quantitatively assessed. We investigated the prevalence and the severity of NAFLD in a T2DM population using controlled attenuation parameter (CAP).
Materials and Methods: Subjects who underwent testing for biomarkers related to T2DM and CAP using Fibroscan® during a reg- ular health check-up were enrolled. CAP values of 250 dB/m and 300 dB/m were selected as the cutoffs for the presence of NAFLD and for moderate to severe NAFLD, respectively. Biomarkers related to T2DM included fasting glucose/insulin, fasting C-peptide, hemoglobin A1c (HbA1c), glycoalbumin, and homeostasis model assessment of insulin resistance of insulin resistance (HOMA-IR).
Results: Among 340 study participants (T2DM, n=66; pre-diabetes, n=202; NGT, n=72), the proportion of subjects with NAFLD increased according to the glucose tolerance status (31.9% in NGT; 47.0% in pre-diabetes; 57.6% in T2DM). The median CAP val- ue was significantly higher in subjects with T2DM (265 dB/m) than in those with pre-diabetes (245 dB/m) or NGT (231 dB/m) (all p<0.05). Logistic regression analysis showed that subjects with moderate to severe NAFLD had a 2.8-fold (odds ratio) higher risk of having T2DM than those without NAFLD (p=0.02; 95% confidence interval, 1.21–6.64), and positive correlations between the CAP value and HOMA-IR (ρ=0.407) or fasting C-peptide (ρ=0.402) were demonstrated.
Conclusion: Subjects with T2DM had a higher prevalence of severe NAFLD than those with NGT. Increased hepatic steatosis was significantly associated with the presence of T2DM, and insulin resistance induced by hepatic fat may be an important mecha- nistic connection.
Key Words: Controlled attenuation parameter, fatty liver, non-alcoholic fatty liver disease, type 2 diabetes mellitus, pre-diabetes, insulin resistance
pISSN: 0513-5796 · eISSN: 1976-2437
Received: April 3, 2015 Revised: September 21, 2015 Accepted: October 17, 2015
Corresponding author: Dr. Kwang-Hyub Han, Department of Internal Medicine, Institute of Gastroenterology, Yonsei University College of Medicine, 50-1 Yonsei-ro, Seodaemun-gu, Seoul 03722, Korea.
Tel: 82-2-2228-1949, Fax: 82-2-393-6884, E-mail: [email protected]
*Young Eun Chon and Kwang Joon Kim contributed equally to this work.
•The authors have no financial conflicts of interest.
© Copyright: Yonsei University College of Medicine 2016
This is an Open Access article distributed under the terms of the Creative Com- mons Attribution Non-Commercial License (http://creativecommons.org/licenses/
by-nc/3.0) which permits unrestricted non-commercial use, distribution, and repro- duction in any medium, provided the original work is properly cited.
Yonsei Med J 2016 Jul;57(4):885-892 http://dx.doi.org/10.3349/ymj.2016.57.4.885
NAFLD and insulin resistance and/or T2DM.10,11 In addition, several recent studies have shown that NAFLD per se can pre- dict future development of T2DM.12-14 However, all of these studies investigated the presence of NAFLD through ultraso- nography, a crude method for detecting hepatic steatosis that requires more than 30% hepatic lipid for detection and is high- ly subjective with respect to operator’s skill.15
Controlled attenuation parameter (CAP) is a non-invasive diagnostic method that digitizes the amount of hepatic fat, based on the properties of ultrasonic attenuation by hepatic fat, using the central frequency of the Fibroscan® M probe.16 In sev- eral previous studies on various chronic liver diseases, CAP showed significant correlation with hepatic steatosis and con- siderable diagnostic performance for grading the degree of steatosis.17-20 Therefore, this novel parameter enabled research- ers to investigate the prevalence and severity of NAFLD through quantitative measurement of hepatic steatosis with high sen- sitivity.
In the present study, we investigated the following by using CAP 1) the prevalence and the severity of NAFLD according to the glucose tolerance status, and 2) factors involved in the as- sociation between NAFLD and T2DM.
MATERIALS AND METHODS
Patients
We examined the data of 372 subjects who underwent a health check-up from November 2011 to February 2013 at Severance Hospital, Yonsei University College of Medicine, Seoul, Korea.
Subjects who underwent both laboratory testing of biomark- ers for T2DM and CAP were included. The following exclusion criteria were applied.
1) Subjects with chronic liver disease of any etiology other than NAFLD [positivity for hepatitis B surface antigen (HBsAg;
n=4) or hepatitis C antibody (anti-HCV; n=2)]
2) Subjects with potential risk for developing secondary he- patic steatosis [excessive (>20 g/day) alcohol consumption (n=
20), medications (n=4; steroid, n=3; tamoxifen, n=1)]
3) Unreliable liver stiffness value (LSV) or LSV measurement failure (n=2)
After excluding 32 of 372 participants, a total of 340 subjects were included in the final analysis. This study was approved by the independent Institutional Review Board of Severance Hos- pital of Yonsei University College of Medicine and conformed to the ethical guidelines of the 1975 Helsinki declaration. All patients signed a written informed consent.
Medical examinations and laboratory tests
Anthropometric data, such as body mass index (BMI) and sys- tolic and diastolic blood pressure, were measured. A question- naire was given to all participants to investigate family history of diabetes mellitus, frequency and amount of alcohol consump-
tion, and smoking status (never, past, current). T2DM was de- fined as fasting glucose ≥126 mg/dL, and/or 2-hour post-load- ing glucose ≥200 mg/dL, and/or hemoglobin A1c (HbA1c)
≥6.5%, or history of glucose-lowering medications. The pre- diabetes group included subjects with impaired fasting glyce- mia (fasting glucose 100 to 125 mg/dL) and/or impaired glu- cose tolerance [75 g oral glucose tolerance test (OGTT), 140 to 199 mg/dL], and/or HbA1c 5.7 to 6.4%.21 Hypertension was defined as taking anti-hypertensive medication or blood pressure higher than 140/90 mm Hg at initial examination. Metabolic syndrome was defined according to the criteria established by the Na- tional Cholesterol Education Program Adult Treatment Panel III, except for the determination of abdominal obesity by waist circumference. We used a waist circumference cutoff level based on the report by the International Diabetes Institute/West- ern Pacific World Health Organization/International Obesity Task Force. Metabolic syndrome was diagnosed if three of the five following features were satisfied: 1) waist circumference
>90 cm in men and >80 cm in women; 2) triglycerides ≥150 mg/dL (1.7 mmol/L); 3) high-density lipoprotein (HDL) cho- lesterol <40 mg/dL (1.03 mmol/L) in men and <50 mg/dL (1.29 mmol/L) in women; 4) blood pressure ≥130/85 mm Hg; and 5) fasting plasma glucose ≥100 mg/dL (5.6 mmol/L).
The laboratory tests included serological tests for HBsAg, anti-HCV, aspartate aminotransferase, alanine aminotrans- ferase (ALT), total bilirubin, gamma glutamyltranspeptidase (GGT), and lipid profiles (triglycerides and total HDL, and low- density lipoprotein cholesterol). Biomarkers related to T2DM included fasting glucose, fasting insulin, fasting C-peptide, HbA1c, glycoalbumin, homeostasis model assessment of in- sulin resistance of insulin resistance (HOMA-IR), homeostasis model assessment of beta cell function (HOMA-β), and high sensitive C-reactive protein (hs-CRP). HOMA-IR was calculat- ed as fasting serum insulin (IU/dL)×fasting serum glucose (mg/
dL)/22.5, and HOMA-β as [20×fasting serum insulin (IU/dL)]/
[fasting serum glucose (mg/dL)-3.5].
Imaging tests
All subjects underwent abdominal ultrasonography and tran- sient elastography (FibroScan®, EchoSens, Paris, France). Ab- dominal ultrasonography was performed by two experienced hepatologists. Liver steatosis by ultrasonography was assessed as absent, mild, moderate, or severe on the basis of the liver-kid- ney difference in echo amplitude caused by abnormally in- tense echoes arising from the hepatic parenchyma due to liver fat, echo attenuation by fat into the deep portion of liver, and blurring of the blood vessel structures in the liver.22 Two hepa- tologists who performed ultrasonography independently re- viewed all ultrasonographic findings. In cases of discrepancy, a final consensus opinion was adopted.
CAP and liver stiffness measurement were performed on the right lobe of the liver through the intercostal spaces with sub- jects lying in the dorsal decubitus position with the right arm in
maximal abduction by one experienced technician who was blind to the subjects’ clinical data. The principle of CAP calcu- lation has been described previously.23 Briefly, CAP measures ultrasonic attenuations by the liver fat at 3.5 MHz using signals acquired by the FibroScan®, and is simultaneously calculated with LSV using the same signals. CAP value and LSV are ex-
pressed as dB/m and kPa, respectively. The median values of successful measurements were selected as the representative CAP values and LSV. The interquartile range (IQR) was defined as the interval containing 50% of valid measurements between the 25th and 75th percentiles. As an indicator of variability, the ratio of the IQR of CAP values and LSV to the median (IQR/
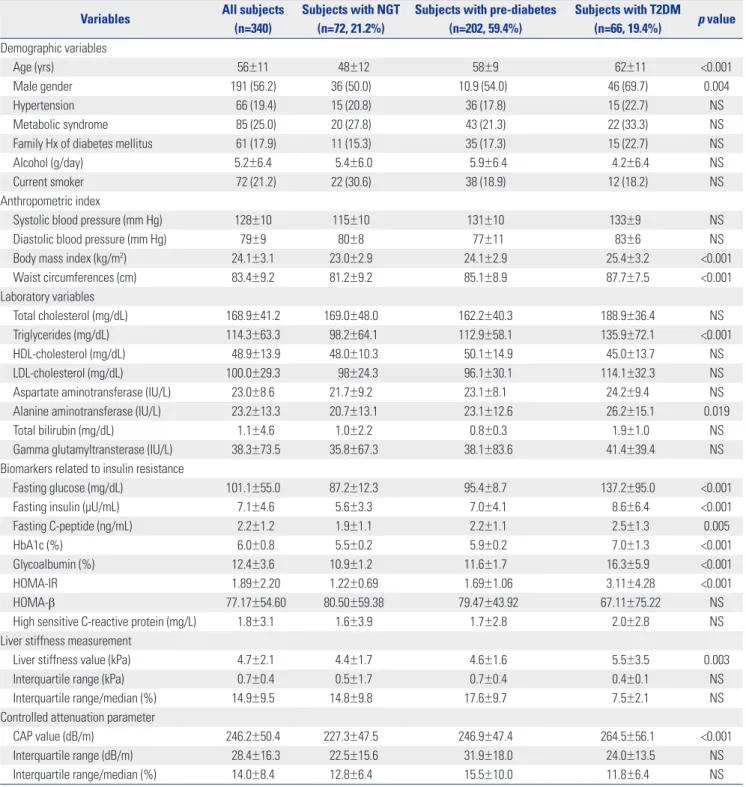
Table 1. Baseline Characteristics
Variables All subjects
(n=340)
Subjects with NGT (n=72, 21.2%)
Subjects with pre-diabetes (n=202, 59.4%)
Subjects with T2DM (n=66, 19.4%) p value Demographic variables
Age (yrs) 56±11 48±12 58±9 62±11 <0.001
Male gender 191 (56.2) 36 (50.0) 10.9 (54.0) 46 (69.7) 0.004
Hypertension 66 (19.4) 15 (20.8) 36 (17.8) 15 (22.7) NS
Metabolic syndrome 85 (25.0) 20 (27.8) 43 (21.3) 22 (33.3) NS
Family Hx of diabetes mellitus 61 (17.9) 11 (15.3) 35 (17.3) 15 (22.7) NS
Alcohol (g/day) 5.2±6.4 5.4±6.0 5.9±6.4 4.2±6.4 NS
Current smoker 72 (21.2) 22 (30.6) 38 (18.9) 12 (18.2) NS
Anthropometric index
Systolic blood pressure (mm Hg) 128±10 115±10 131±10 133±9 NS
Diastolic blood pressure (mm Hg) 79±9 80±8 77±11 83±6 NS
Body mass index (kg/m2) 24.1±3.1 23.0±2.9 24.1±2.9 25.4±3.2 <0.001
Waist circumferences (cm) 83.4±9.2 81.2±9.2 85.1±8.9 87.7±7.5 <0.001
Laboratory variables
Total cholesterol (mg/dL) 168.9±41.2 169.0±48.0 162.2±40.3 188.9±36.4 NS
Triglycerides (mg/dL) 114.3±63.3 98.2±64.1 112.9±58.1 135.9±72.1 <0.001
HDL-cholesterol (mg/dL) 48.9±13.9 48.0±10.3 50.1±14.9 45.0±13.7 NS
LDL-cholesterol (mg/dL) 100.0±29.3 98±24.3 96.1±30.1 114.1±32.3 NS
Aspartate aminotransferase (IU/L) 23.0±8.6 21.7±9.2 23.1±8.1 24.2±9.4 NS
Alanine aminotransferase (IU/L) 23.2±13.3 20.7±13.1 23.1±12.6 26.2±15.1 0.019
Total bilirubin (mg/dL) 1.1±4.6 1.0±2.2 0.8±0.3 1.9±1.0 NS
Gamma glutamyltransterase (IU/L) 38.3±73.5 35.8±67.3 38.1±83.6 41.4±39.4 NS
Biomarkers related to insulin resistance
Fasting glucose (mg/dL) 101.1±55.0 87.2±12.3 95.4±8.7 137.2±95.0 <0.001
Fasting insulin (µU/mL) 7.1±4.6 5.6±3.3 7.0±4.1 8.6±6.4 <0.001
Fasting C-peptide (ng/mL) 2.2±1.2 1.9±1.1 2.2±1.1 2.5±1.3 0.005
HbA1c (%) 6.0±0.8 5.5±0.2 5.9±0.2 7.0±1.3 <0.001
Glycoalbumin (%) 12.4±3.6 10.9±1.2 11.6±1.7 16.3±5.9 <0.001
HOMA-IR 1.89±2.20 1.22±0.69 1.69±1.06 3.11±4.28 <0.001
HOMA-β 77.17±54.60 80.50±59.38 79.47±43.92 67.11±75.22 NS
High sensitive C-reactive protein (mg/L) 1.8±3.1 1.6±3.9 1.7±2.8 2.0±2.8 NS
Liver stiffness measurement
Liver stiffness value (kPa) 4.7±2.1 4.4±1.7 4.6±1.6 5.5±3.5 0.003
Interquartile range (kPa) 0.7±0.4 0.5±1.7 0.7±0.4 0.4±0.1 NS
Interquartile range/median (%) 14.9±9.5 14.8±9.8 17.6±9.7 7.5±2.1 NS
Controlled attenuation parameter
CAP value (dB/m) 246.2±50.4 227.3±47.5 246.9±47.4 264.5±56.1 <0.001
Interquartile range (dB/m) 28.4±16.3 22.5±15.6 31.9±18.0 24.0±13.5 NS
Interquartile range/median (%) 14.0±8.4 12.8±6.4 15.5±10.0 11.8±6.4 NS
NS, not significant (p-value>0.05); NGT, normal glucose tolerance; T2DM, type 2 diabetes mellitus; HDL, high-density lipoprotein; LDL, low-density lipoprotein;
HbA1c, hemoglobin A1c; HOMA-IR, homeostasis model assessment of insulin resistance; HOMA-β, homeostasis model assessment of beta cell function; CAP, controlled attenuation parameter.
Variables are expressed as mean±SD (range) or n (%).
Mcap and IQR/M, respectively) was calculated. In this study, only measurements with at least 10 valid shots and a success rate of at least 60% were considered reliable and were used for statistical analysis.24 A CAP value of 250 dB/m was selected as the cutoff for presence of steatosis and a CAP value of 300 dB/m was the cutoff for moderate to severe steatosis.20
Statistical analysis
Data are expressed as means±standard deviation, median (range), or n (%), as appropriate. Categorical data were compared using chi-square test and continuous data were compared with in- dependent t-test. Differences of median CAP values according to diabetic group were analyzed with the Kruskal-Wallis test.
Binary logistic regression analysis was used to identify the fac- tors associated with T2DM. Correlations between CAP value and biomarkers related to T2DM were evaluated by Spearman correlation coefficients. A one-way analysis of variance was performed to compare HOMA-IR and fasting C-peptide ac- cording to CAP groups (CAP value <250 vs. CAP value 250–300 vs. CAP value ≥300). All statistical analyses were performed using SPSS 19.0 (SPSS Inc., Chicago, IL, USA) and two-sided p- values <0.05 were considered significant.
RESULTS
Baseline characteristics
Among the 340 participants (191 men and 139 women), 66 (19.4%) subjects had T2DM. Among 274 (80.6%) subjects with- out T2DM, 202 (59.4%) had pre-diabetes and 72 (21.2%) showed normal glucose tolerance (NGT). The baseline characteristics
of study subjects according to patients with and without T2DM are shown in Table 1. According to the glucose tolerance status, patients with T2DM rather than patients with pre-diabetes or NGT were more likely to be older and male (both p<0.05). These subjects also had higher BMI, waist circumference, and triglyc- eride level, as well as elevated biomarkers related to T2DM (fasting glucose, fasting insulin, fasting C-peptide, HbA1c, gly- coalbumin, and HOMA-IR) (all p<0.05). CAP values and LSV were also significantly higher in patients with T2DM than those with pre-diabetes or NGT (CAP values, 264.5±56.1 dB/m vs.
246.9±47.4 dB/m vs. 227.3±47.5 dB/m, p<0.001; LSV, 5.5±3.5 kPa vs. 4.6±1.6 kPa vs. 4.4±1.7 kPa, p=0.003).
Prevalence of NAFLD according to the glucose tolerance status
The proportion of subjects with presence of NAFLD (CAP value
≥250 dB/m) increased according to the glucose tolerance sta- tus [31.9% (n=23) in NGT; 47.0% (n=95) in pre-diabetes, 57.6%
(n=38) in T2DM; NGT vs. pre-diabetes, p=0.027; NGT vs.
T2DM, p=0.003; pre-diabetes vs. T2DM, p=0.157]. The propor- tion of subjects with moderate to severe NAFLD (CAP value
≥300 dB/m) also increased according to the glucose tolerance status (9.7% in NGT, 15.3% in pre-diabetes, 33.3% in T2DM;
NGT vs. pre-diabetes, p=0.321; NGT vs. T2DM, p=0.001; pre- diabetes vs. T2DM, p=0.02) (Fig. 1A). In addition, the proportion of subjects with NAFLD diagnosed by ultrasonography dif- fered according to the glucose tolerance status (27.8% in NGT, 35.6% in pre-diabetes, 54.5% in T2DM; NGT vs. pre-diabetes, p=0.425; NGT vs. T2DM, p=0.024; pre-diabetes vs. T2DM, p=
0.057). The proportion of subjects with moderate to severe NAFLD diagnosed by ultrasonography also increased accord-
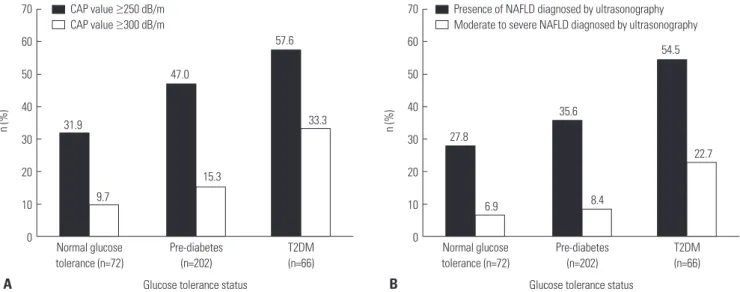
Fig. 1. Prevalence of NAFLD according to the glucose tolerance status. (A) Subjects with NAFLD (CAP value ≥250 dB/m) increased according to the glu- cose tolerance status (31.9% in NGT; 47.0% in pre-diabetes; 57.6% in T2DM) (black bar). Subjects with moderate to severe NAFLD (CAP value ≥300 dB/m) increased according to the glucose tolerance status (9.7% in NGT; 15.3% in pre-diabetes; 33.3% in T2DM) (white bar). (B) Subjects with presence of NAFLD (diagnosed by ultrasonography) increased according to the glucose tolerance status (27.8% in NGT; 35.6% in pre-diabetes; 54.5% in T2DM) (black bar). Subjects with moderate to severe NAFLD (diagnosed by ultrasonography) increased according to the glucose tolerance status (6.9% in NGT; 8.4% in pre-diabetes; 22.7% in T2DM) (white bar). NAFLD, non-alcoholic fatty liver disease; CAP, controlled attenuation parameter; NGT, normal glucose toler- ance; T2DM, type 2 diabetes mellitus.
70 60 50 40 30 20 10 0
70 60 50 40 30 20 10 Normal glucose 0
tolerance (n=72)
Normal glucose tolerance (n=72) Pre-diabetes
(n=202)
Pre-diabetes (n=202)
Glucose tolerance status Glucose tolerance status
T2DM (n=66)
T2DM (n=66)
31.9 27.8
47.0
35.6
57.6 54.5
9.7 6.9
15.3
8.4 33.3
22.7
n (%) n (%)
CAP value ≥250 dB/m CAP value ≥300 dB/m
Presence of NAFLD diagnosed by ultrasonography Moderate to severe NAFLD diagnosed by ultrasonography
A B
ing to the glucose tolerance status (6.9% in NGT, 8.4% in pre- diabetes, 22.7% in T2DM; NGT vs. pre-diabetes, p=0.406; NGT vs. T2DM, p=0.031; pre-diabetes vs. T2DM, p=0.044) (Fig. 1B).
Severity of NAFLD according to the glucose tolerance status
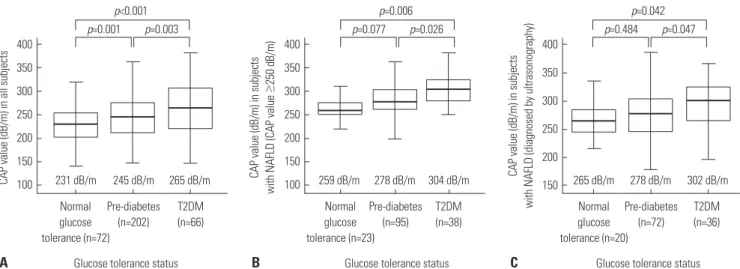
Subjects with T2DM had significantly higher median CAP val- ues than those with NGT (265 dB/m vs. 231 dB/m, p<0.001) or pre-diabetes (265 dB/m vs. 245 dB/m, p=0.003). The median CAP value was significantly higher in the pre-diabetes group than in the NGT group (245 dB/m vs. 231 dB/m, p=0.001) (Fig.
2A). In subjects with NAFLD (CAP value ≥250 dB/m), the me- dian CAP values increased according to the glucose tolerance status: 259 dB/m in NGT, 278 dB/m in pre-diabetes, and 304 dB/m in the T2DM group (comparison between groups;
T2DM vs. NGT, p=0.006; T2DM vs. pre-diabetes, p=0.026; pre- diabetes vs. NGT, p=0.077) (Fig. 2B). In subjects with NAFLD (diagnosed by ultrasonography), the median CAP values also increased according to the glucose tolerance status: 265 dB/m in NGT, 278 dB/m in pre-diabetes, and 302 dB/m in the T2DM group (comparison between groups; T2DM vs. NGT, p=0.042;
T2DM vs. pre-diabetes, p=0.047; pre-diabetes vs. NGT, p=
0.484) (Fig. 2C).
Factors associated with T2DM
In univariate binary logistic regression analyses, T2DM was sig- nificantly associated with fasting glucose, fasting insulin, fast- ing C-peptide, HbA1c, glycoalbumin, and HOMA-IR (all p<
0.05). In addition, among all variables described in Table 1, T2DM was associated with age, male gender, BMI, waist circum- ference, triglyceride, HDL-cholesterol, LSV, and CAP value (all p<0.05).
Multivariable logistic regression analysis was performed to control for other established risk factors for T2DM and to de- termine whether CAP value was independently associated with T2DM (Table 2). After adjusting for age, gender, BMI, waist circumference, triglyceride, HDL-cholesterol, and LSV, sub- jects with CAP value ≥300 dB/m were found to have a 2.8-fold higher risk of having T2DM than those with CAP value <250 dB/m [p=0.017; odds ratio (OR)=2.83; 95% confidence interval (CI), 1.21–6.64]. Subjects with a CAP value of 250–300 dB/m had a very similar risk of developing T2DM as those with CAP value <250 dB/m (p=0.374; OR=1.10; 95% CI, 0.59–2.16). As ex- pected, age was also closely related to the risk of T2DM (p<0.001;
OR=1.07; 95% CI, 1.04–1.11). However, gender, BMI, waist cir- cumference, triglycerides, HDL-cholesterol, and LSV showed no significant associations with T2DM.
Correlation between CAP value and baseline factors Biomarkers related to T2DM and other factors were measured in all subjects (n=340) to investigate their correlation with CAP Normal
glucose tolerance (n=72)
Normal glucose tolerance (n=23)
Normal glucose tolerance (n=20) Pre-diabetes
(n=202)
Pre-diabetes (n=95)
Pre-diabetes (n=72) T2DM
(n=66)
T2DM (n=38)
T2DM (n=36)
265 dB/m 304 dB/m 302 dB/m
245 dB/m 278 dB/m 278 dB/m
231 dB/m
p=0.001 p=0.003 p=0.077 p=0.026 p=0.484 p=0.047
p<0.001 p=0.006 p=0.042
Glucose tolerance status Glucose tolerance status Glucose tolerance status
259 dB/m 265 dB/m
Fig. 2. Severity of NAFLD according to the glucose tolerance status. (A) Subjects with T2DM had significantly higher median CAP values than those with NGT (265 dB/m vs. 231 dB/m, p<0.001) or pre-diabetes (265 dB/m vs. 245 dB/m, p=0.003). (B) In subjects with NAFLD (CAP value ≥250 dB/m), the median CAP value increased according to the glucose tolerance status: 259 dB/m, 278 dB/m, and 304 dB/m in NGT, pre-diabetes, and T2DM groups, respectively (comparison between groups: T2DM vs. NGT, p=0.006; T2DM vs. pre-diabetes, p=0.026; pre-diabetes vs. NGT, p=0.077). (C) In subjects with NAFLD (diag- nosed by ultrasonography), the median CAP values increased according to the glucose tolerance status: 265 dB/m in NGT, 278 dB/m in pre-diabetes, and 302 dB/m in T2DM group (comparison between groups; T2DM vs. NGT, p=0.042; T2DM vs. pre-diabetes, p=0.047; pre-diabetes vs. NGT, p=0.484). NAFLD, non-alcoholic fatty liver disease; CAP, controlled attenuation parameter; T2DM, type 2 diabetes mellitus; NGT, normal glucose tolerance.
400 350 300 250 200 150 100
400 350 300 250 200 150 100
400 350 300 250 200
CAP value (dB/m) in all subjects CAP value (dB/m) in subjects with NAFLD (CAP value ≥250 dB/m) CAP value (dB/m) in subjects with NAFLD (diagnosed by ultrasonography) 150
Table 2. Multiple Logistic Regression Analyses of Factors Associated with T2DM
Odd ratio (95% CI) p value
Age (yrs) 1.07 (1.04–1.11) <0.001
CAP value (group 0 vs. 1) 1.10 (0.59–2.16) 0.374 CAP value (group 0 vs. 2) 2.83 (1.21–6.64) 0.017 Models controlled for age, gender, BMI, waist circumference, triglycer- ide, HDL-cholesterol, and LSV.
T2DM, type 2 diabetes mellitus; BMI, body mass index; HDL, high-density lipo- protein; LSV, liver stiffness value; CI, confidence interval; CAP, controlled at- tenuation parameter.
Group 0, CAP value <250 dB/m; Group 1, 250 dB/m ≤CAP value <300 dB/m;
Group 2, CAP value ≥300 dB/m.
A B C
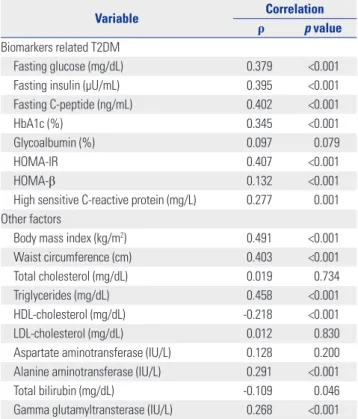
value (Table 3). Among biomarkers related to T2DM, CAP val- ue showed significant correlation; HOMA-IR (ρ=0.407, p<0.001) and fasting C-peptide (ρ=0.402, p<0.001). In addition, CAP val- ue showed a correlation with fasting insulin (ρ=0.395, p<0.001), fasting glucose (ρ=0.379, p<0.001), HbA1c (ρ=0.345, p<0.001), hs-CRP (ρ=0.277, p=0.001), and HOMA-β (ρ=0.132, p<0.001).
Among other factors, CAP value showed significant correla- tion with BMI (ρ=0.491, p<0.001), triglycerides (ρ=0.458, p<
0.001), and waist circumference (ρ=0.403, p<0.001). Moreover, CAP showed a correlation with ALT (ρ=0.291, p<0.001), GGT (ρ=0.268, p<0.001), HDL-cholesterol (ρ=-0.218, p<0.001), and total bilirubin (ρ=-0.109, p=0.046). HOMA-IR was significantly higher in the group with CAP value ≥300 dB/m than in the groups with CAP value between 250–300 or CAP value <250 dB/m (HOMA-IR, 3.00±1.99 vs. 1.64±1.04 vs. 1.63±2.59, respec- tively; p<0.001) (Fig. 3A). Subjects with a CAP value >300 dB/
m showed significantly higher fasting C-peptide than those with CAP value between 250–300 dB/m or <250 dB/m (fasting C-peptide; 2.71±0.95 ng/mL vs. 2.29±1.62 ng/mL vs. 1.97±0.88 ng/mL, respectively; p<0.001) (Fig. 3B).
DISCUSSION
The important findings of the present study are 1) subjects with T2DM had a more severe degree of NAFLD, as represented by CAP value, than those with NGT; 2) hepatic fat was a signifi- cant risk factor for T2DM; and 3) a clear association between hepatic fat and insulin resistance was demonstrated.
In our study, subjects with T2DM had higher BMI, higher tri- glycerides, and lower HDL cholesterol level than those with- out T2DM, thus presenting a higher metabolic risk in general.
The higher mean CAP value in subjects with T2DM in our study can be explained in the same context and the metabolic signif- icance of the CAP value was also demonstrated by its signifi- cant correlation with BMI (ρ=0.491, p<0.001), triglycerides (ρ=
0.458, p<0.001), and waist circumference (ρ=0.403, p<0.001).
Therefore, CAP value may be an additional parameter that can supplement the traditional variables representing metabolic risk. In addition, considering the fact that NAFLD is now ac- Table 3. Correlations between CAP Values and Baseline Factors (n=340)
Variable Correlation
ρ p value
Biomarkers related T2DM
Fasting glucose (mg/dL) 0.379 <0.001
Fasting insulin (µU/mL) 0.395 <0.001
Fasting C-peptide (ng/mL) 0.402 <0.001
HbA1c (%) 0.345 <0.001
Glycoalbumin (%) 0.097 0.079
HOMA-IR 0.407 <0.001
HOMA-β 0.132 <0.001
High sensitive C-reactive protein (mg/L) 0.277 0.001 Other factors
Body mass index (kg/m2) 0.491 <0.001
Waist circumference (cm) 0.403 <0.001
Total cholesterol (mg/dL) 0.019 0.734
Triglycerides (mg/dL) 0.458 <0.001
HDL-cholesterol (mg/dL) -0.218 <0.001
LDL-cholesterol (mg/dL) 0.012 0.830
Aspartate aminotransferase (IU/L) 0.128 0.200 Alanine aminotransferase (IU/L) 0.291 <0.001
Total bilirubin (mg/dL) -0.109 0.046
Gamma glutamyltransterase (IU/L) 0.268 <0.001 CAP, controlled attenuation parameter; T2DM, type 2 diabetes mellitus; HbA1c, hemoglobin A1c; HOMA-IR, homeostasis model assessment of insulin resis- tance; HOMA-β, homeostasis model assessment of beta cell function; HDL, high-density lipoprotein; LDL, low-density lipoprotein.
Fig. 3. HOMA-IR and fasting C-peptide level according to CAP values. (A) HOMA-IR was significantly higher in the group with CAP value ≥300 dB/m com- pared with the groups with CAP value of 250–300 or <250 dB/m (HOMA-IR, 3.00±1.99 vs. 1.64±1.04 vs. 1.63±2.59, respectively; p<0.001). (B) Subjects with CAP value >300 dB/m showed significantly higher fasting C-peptide than those with CAP value of 250–300 dB/m or <250 dB/m (fasting C-peptide, 2.71±0.95 ng/mL vs. 2.29±1.62 ng/mL vs. 1.97±0.88 ng/mL, respectively; p<0.001). HOMA-IR, homeostasis model assessment of insulin resistance; CAP, controlled attenuation parameter.
3.50 3.00 2.50 2.00 1.50 1.00 0.50 0.00
3.00
2.50
2.00
1.50
1.00
0.50
<250 dB/m 250–300 dB/m 0.00 <250 dB/m
CAP group
250–300 dB/m CAP group
≥300 dB/m ≥300 dB/m
1.63
1.97
1.64
2.29
3.00 2.71
HOMA-IR C-peptide (ng/mL)
A B
cepted as a hepatic manifestation of metabolic syndrome, the CAP value would likely be used as a unique metabolic parame- ter that specifically targets the liver.
Subjects with T2DM had a high prevalence of NAFLD, ap- proximately 60%.24,25 Using CAP as a tool, the present study confirmed that the prevalence of NAFLD increases according to the glucose tolerance status (31.9% in NGT, 47.0% in pre-di- abetes, and 57.6% in T2DM), which was compatible with the previous study.26 Specifically, the prevalence of NAFLD was higher when it was diagnosed by CAP than ultrasonography, because CAP is a sensitive method for detecting small amount (less than 20%) of hepatic fat. In addition, we found that the se- verity of NAFLD represented by CAP value increased in sub- jects with T2DM. As far as we are aware of, this is the only study to demonstrate quantitative differences in the accumulation of hepatic fat according to glucose tolerance status.
In the present study, we investigated the correlation between CAP and T2DM-related biomarkers to explain the association between the incidence of T2DM and prevalence of NAFLD, as well as the differences in hepatic fat accumulation according to glucose tolerance status. Among all T2DM-related biomark- ers, the association between CAP value and HOMA-IR was the strongest. Therefore, HOMA-IR may play a key role in linking hepatic fat to the incidence of T2DM. Previous studies have reported that hepatic fat plays a key role in the impairment of insulin-mediated inhibition of hepatic glucose production that leads to insulin resistance.27 The mechanism of this NAFLD- associated hepatic insulin resistance was investigated by mea- suring hepatic glucose and insulin using a low-dose hyperin- sulinemic-euglycemic clamp combined with a glucose tra- cer.28-30 In patients with NAFLD, endogenous glucose produc- tion was normal but peripheral glucose disposal was markedly decreased due to impaired glucose oxidation and glycogen syn- thesis.
Transient elastography, which was used to measure CAP in this study, is a simple, reproducible, non-invasive tool16,20 that demonstrated a very strong relationship with insulin resistance, a main causative factor of T2DM, and a factor associated with obesity. Therefore, it has substantial clinical implications as a monitoring tool for NAFLD, and the change in the amount of hepatic steatosis in association with an improvement or deteri- oration in insulin resistance can be dynamically monitored us- ing the CAP value during follow up.
There are several limitations in this study that should be ac- knowledged. The inclusion of participants who are able to af- ford a health check-up in a tertiary hospital may imply selection bias toward older age and high economic status. For this rea- son, our participants tended to show a higher prevalence of T2DM compared with the general population.31 Second, the cross-sec- tional approach of the present study precludes solid conclu- sions on the relationship between CAP value and biomarkers related to T2DM and on prediction of the prognosis of subjects with T2DM according to the degree of hepatic steatosis. There-
fore, there is a need for further study that validates our data us- ing a large sample cohort with a well-balanced spectrum of age and economic status and is designed in a longitudinal manner.
In conclusion, this study proved that subjects with T2DM had a higher prevalence of severe NAFLD than those with NGT.
Moreover, increased hepatic steatosis was significantly associ- ated with the presence of T2DM, and insulin resistance induced by hepatic fat may be an important mechanistic connection.
Longitudinal prospective studies are necessary to investigate the clinical implication of the relationship between CAP value and T2DM-related biomarkers and their association with the prognosis of T2DM.
ACKNOWLEDGEMENTS
The authors are grateful to Dong-Su Jang (Medical Illustrator, Medical Research Support Section, Yonsei University College of Medicine, Seoul, Korea), for his help with the figures.
REFERENCES
1. Marchesini G, Brizi M, Bianchi G, Tomassetti S, Bugianesi E, Lenzi M, et al. Nonalcoholic fatty liver disease: a feature of the metabolic syndrome. Diabetes 2001;50:1844-50.
2. Angulo P. Nonalcoholic fatty liver disease. N Engl J Med 2002;346:
1221-31.
3. Kojima S, Watanabe N, Numata M, Ogawa T, Matsuzaki S. Increase in the prevalence of fatty liver in Japan over the past 12 years: analy- sis of clinical background. J Gastroenterol 2003;38:954-61.
4. Browning JD, Szczepaniak LS, Dobbins R, Nuremberg P, Horton JD, Cohen JC, et al. Prevalence of hepatic steatosis in an urban pop- ulation in the United States: impact of ethnicity. Hepatology 2004;
40:1387-95.
5. Kim HC, Choi KS, Jang YH, Shin HW, Kim DJ. Normal serum ami- notransferase levels and the metabolic syndrome: Korean National Health and Nutrition Examination Surveys. Yonsei Med J 2006;47:
542-50.
6. Moore JB. Non-alcoholic fatty liver disease: the hepatic conse- quence of obesity and the metabolic syndrome. Proc Nutr Soc 2010;
69:211-20.
7. Kotronen A, Yki-Järvinen H. Fatty liver: a novel component of the metabolic syndrome. Arterioscler Thromb Vasc Biol 2008;28:27-38.
8. Sanyal AJ; American Gastroenterological Association. AGA tech- nical review on nonalcoholic fatty liver disease. Gastroenterology 2002;123:1705-25.
9. Lee J, Hong SW, Rhee EJ, Lee WY. GLP-1 Receptor agonist and non- alcoholic fatty liver disease. Diabetes Metab J 2012;36:262-7.
10. Kim HJ, Kim HJ, Lee KE, Kim DJ, Kim SK, Ahn CW, et al. Metabolic significance of nonalcoholic fatty liver disease in nonobese, non- diabetic adults. Arch Intern Med 2004;164:2169-75.
11. Anstee QM, Targher G, Day CP. Progression of NAFLD to diabetes mellitus, cardiovascular disease or cirrhosis. Nat Rev Gastroenterol Hepatol 2013;10:330-44.
12. Park SK, Seo MH, Shin HC, Ryoo JH. Clinical availability of nonal- coholic fatty liver disease as an early predictor of type 2 diabetes mellitus in Korean men: 5-year prospective cohort study. Hepatol- ogy 2013;57:1378-83.
13. Bae JC, Rhee EJ, Lee WY, Park SE, Park CY, Oh KW, et al. Combined effect of nonalcoholic fatty liver disease and impaired fasting glu-
cose on the development of type 2 diabetes: a 4-year retrospective longitudinal study. Diabetes Care 2011;34:727-9.
14. Shibata M, Kihara Y, Taguchi M, Tashiro M, Otsuki M. Nonalcoholic fatty liver disease is a risk factor for type 2 diabetes in middle-aged Japanese men. Diabetes Care 2007;30:2940-4.
15. Saadeh S, Younossi ZM, Remer EM, Gramlich T, Ong JP, Hurley M, et al. The utility of radiological imaging in nonalcoholic fatty liver disease. Gastroenterology 2002;123:745-50.
16. Sasso M, Beaugrand M, de Ledinghen V, Douvin C, Marcellin P, Poupon R, et al. Controlled attenuation parameter (CAP): a novel VCTETM guided ultrasonic attenuation measurement for the evalu- ation of hepatic steatosis: preliminary study and validation in a co- hort of patients with chronic liver disease from various causes. Ul- trasound Med Biol 2010;36:1825-35.
17. Myers RP, Pollett A, Kirsch R, Pomier-Layrargues G, Beaton M, Levstik M, et al. Controlled Attenuation Parameter (CAP): a non- invasive method for the detection of hepatic steatosis based on transient elastography. Liver Int 2012;32:902-10.
18. Sasso M, Tengher-Barna I, Ziol M, Miette V, Fournier C, Sandrin L, et al. Novel controlled attenuation parameter for noninvasive as- sessment of steatosis using Fibroscan(®): validation in chronic hep- atitis C. J Viral Hepat 2012;19:244-53.
19. Kumar M, Rastogi A, Singh T, Behari C, Gupta E, Garg H, et al. Con- trolled attenuation parameter for non-invasive assessment of he- patic steatosis: does etiology affect performance? J Gastroenterol Hepatol 2013;28:1194-201.
20. Chon YE, Jung KS, Kim SU, Park JY, Park YN, Kim do Y, et al. Con- trolled attenuation parameter (CAP) for detection of hepatic ste- atosis in patients with chronic liver diseases: a prospective study of a native Korean population. Liver Int 2014;34:102-9.
21. American Diabetes Association. Standards of medical care in dia- betes--2012. Diabetes Care 2012;35 Suppl 1:S11-63.
22. Saverymuttu SH, Joseph AE, Maxwell JD. Ultrasound scanning in
the detection of hepatic fibrosis and steatosis. Br Med J (Clin Res Ed) 1986;292:13-5.
23. Castera L, Forns X, Alberti A. Non-invasive evaluation of liver fibro- sis using transient elastography. J Hepatol 2008;48:835-47.
24. Jimba S, Nakagami T, Takahashi M, Wakamatsu T, Hirota Y, Iwamo- to Y, et al. Prevalence of non-alcoholic fatty liver disease and its association with impaired glucose metabolism in Japanese adults.
Diabet Med 2005;22:1141-5.
25. Adams LA, Lindor KD. Nonalcoholic fatty liver disease. Ann Epide- miol 2007;17:863-9.
26. de Lédinghen V, Vergniol J, Capdepont M, Chermak F, Hiriart JB, Cassinotto C, et al. Controlled attenuation parameter (CAP) for the diagnosis of steatosis: a prospective study of 5323 examinations. J Hepatol 2014;60:1026-31.
27. Barma P, Bhattacharya S, Bhattacharya A, Kundu R, Dasgupta S, Biswas A, et al. Lipid induced overexpression of NF-kappaB in skeletal muscle cells is linked to insulin resistance. Biochim Bio- phys Acta 2009;1792:190-200.
28. Seppälä-Lindroos A, Vehkavaara S, Häkkinen AM, Goto T, West- erbacka J, Sovijärvi A, et al. Fat accumulation in the liver is associat- ed with defects in insulin suppression of glucose production and serum free fatty acids independent of obesity in normal men. J Clin Endocrinol Metab 2002;87:3023-8.
29. Bugianesi E, Gastaldelli A, Vanni E, Gambino R, Cassader M, Baldi S, et al. Insulin resistance in non-diabetic patients with non-alco- holic fatty liver disease: sites and mechanisms. Diabetologia 2005;
48:634-42.
30. Kiesewetter CH, Sheron N, Vettukattill JJ, Hacking N, Stedman B, Millward-Sadler H, et al. Hepatic changes in the failing Fontan cir- culation. Heart 2007;93:579-84.
31. Jeon JY, Ko SH, Kwon HS, Kim NH, Kim JH, Kim CS, et al. Preva- lence of Diabetes and Prediabetes according to Fasting Plasma Glu- cose and HbA1c. Diabetes Metab J 2013;37:349-57.