D I A B E T E S & M E T A B O L I S M J O U R N A L
This is an Open Access article distributed under the terms of the Creative Commons Attribution Non-Commercial License (https://creativecommons.org/licenses/by-nc/4.0/) which permits unrestricted non-commercial use, distribution, and reproduction in any medium, provided the original work is properly cited.
Albuminuria Is Associated with Steatosis Burden in
Patients with Type 2 Diabetes Mellitus and Nonalcoholic Fatty Liver Disease
Eugene Han
1, Mi Kyung Kim
1, Byoung Kuk Jang
2, Hye Soon Kim
1Divisions of 1Endocrinology and Metabolism, 2Gastroenterology and Hepatology, Department of Internal Medicine, Keimyung University School of Medicine, Daegu, Korea
Background: This study aimed to investigate the association between hepatic steatosis burden and albuminuria in Korean pa- tients with type 2 diabetes mellitus (T2DM) and nonalcoholic fatty liver disease (NAFLD).
Methods: We recruited 100 patients with both T2DM and NAFLD, but without chronic kidney disease. Albuminuria was defined as a spot urinary albumin-to-creatinine ratio (ACR) ≥30 mg/g. Transient elastography was performed, and the steatosis burden was quantified by controlled attenuation parameter (CAP) with significant steatosis defined as CAP >302 dB/m.
Results: The prevalence of significant steatosis and albuminuria was 56.0% and 21.0%, respectively. Subjects with significant ste- atosis were significantly younger and had a significantly shorter duration of T2DM, greater waist circumference, and higher body mass index, total cholesterol, triglyceride, and low density lipoprotein cholesterol levels, than subjects without severe NAFLD (all P<0.05). Albuminuria was higher in patients with significant steatosis than in patients without significant steatosis (32.1% vs.
6.8%, P=0.002). Urinary ACR showed a correlation with CAP (r=0.331, P=0.001), and multiple linear regression analysis re- vealed a significant association between a high degree of albuminuria and high CAP value (r=0.321, P=0.001). Additionally, mul- tivariate logistic regression analysis demonstrated the independent association between urinary ACR and significant steatosis af- ter adjustment for confounding factors including age, body mass index, duration of T2DM, low density lipoprotein level, and re- nin-angiotensin system blocker use (odds ratio, 1.88; 95% confidence interval, 1.31 to 2.71; P=0.001).
Conclusion: T2DM patients with NAFLD had a higher prevalence of albuminuria, which correlated with their steatosis burden.
Keywords: Albuminuria; Diabetes mellitus, type 2; Non-alcoholic fatty liver disease
Corresponding author: Hye Soon Kim https://orcid.org/0000-0001-6298-3506 Department of Internal Medicine, Keimyung University School of Medicine, 1095 Dalgubeol-daero, Dalseo-gu, Daegu 42601, Korea
E-mail: [email protected]
INTRODUCTION
Due to the increasing prevalence of obesity and type 2 diabetes mellitus (T2DM), nonalcoholic fatty liver disease (NAFLD) has emerged as one of the most common chronic liver diseas- es, with an estimated worldwide prevalence of 25.2% [1]. The prevalence of NAFLD in patients with T2DM is much greater than in the general population and is reported to be 55.5% [2].
As NAFLD shows a 3% rise in the annual incidence rate, the prevalence of NAFLD is expected to rise as individuals with
obesity and T2DM age [3]. NAFLD is defined by the presence of fat accumulation in hepatocytes, after the exclusion of exces- sive alcohol use, hepatitis virus infection, iron overloading, au- toimmune disease, or medications, which can cause chronic liver disease. NAFLD can advance to non-alcoholic steatohep- atitis (NASH) that can progress to cirrhosis, end-stage liver disease, and finally, hepatocellular carcinoma (HCC) [4].
Moreover, NAFLD, per se, accounts for the most predominant cause of HCC, even without cirrhotic progression [5]. The risk of HCC rises at least two-fold in populations with T2DM and https://doi.org/10.4093/dmj.2020.0118
pISSN 2233-6079 · eISSN 2233-6087
obesity [6].
Albuminuria is an independent risk factor for cardiovascu- lar and renal diseases [7,8]. Additionally, it is a marker of insu- lin resistance and systemic inflammation. Consequently, an as- sociation between albuminuria and other metabolic diseases has been reported [9,10]. Although NAFLD and albuminuria are independently associated with the aggravation of coexist- ing metabolic diseases, the interactive influence of NALFD and albuminuria is not fully determined, especially in subjects with normal kidney function. Therefore, we aimed to investi- gate the association between the degree of steatosis and albu- minuria, independent of other metabolic factors. Furthermore, we investigated whether albuminuria is associated with the he- patic burden in NAFLD.
METHODS
Study population
In this cross-sectional study, a total of 100 Korean subjects, aged 18 years or above, with T2DM were recruited at Keimy- ung University Dongsan Hospital, a tertiary university hospital in Korea. T2DM was defined according to the American Dia- betes Association guidelines [11]. This study complied with the Declaration of Helsinki and Good Clinical Practice guidelines.
The study protocol received ethical approval from the Institu- tional Review Board at the Keimyung University School of Medicine (2017-09-045). Informed consent was obtained from the patients prior to each examination.
All patients had NAFLD, as diagnosed using abdominal ul- trasound or computed tomography and confirmed by a radiol- ogist. Patients were excluded if they fulfilled any one of the fol- lowing criteria: (1) diagnosis of type 1 diabetes mellitus, gesta- tional diabetes mellitus, or any other form of diabetes other than T2DM; (2) history of addiction to alcohol, heavy alcohol consumption (≥210 g/week for men or ≥140 g/week for wom- en); (3) other causes of liver disease (e.g., active viral or auto- immune hepatitis), liver cirrhosis, or HCC; (4) estimated glo- merular filtration rate (eGFR) <45 mL/min/1.73 m
2; (5) medi- cations associated with fatty liver disease (e.g., amiodarone, methotrexate, tamoxifen, or valproate); and (6) pregnant or nursing women.
Measurement of steatosis burden and albuminuria
All patients underwent physical examination and clinical labo- ratory tests after an overnight (over 8 hours) fasting period for
baseline parameters. Liver fat content was assessed via the con- trolled attenuation parameter (CAP), and liver fibrotic burden was assessed via the liver stiffness measurement (LSM). Both CAP and LSM measure ultrasonic attenuations at 3.5 MHz, us- ing signals acquired by transient liver elastography (FibroScan;
Echosens, Paris, France) with XL probe. To achieve an accurate CAP value, we calculated only ultrasonic attenuation when the matched LSM was valid while attempting to collect at least 10 valid LSMs. A success rate of ≥60% and a ratio for the inter- quartile range (IQR) to the median value of LSM of ≤30%
were considered reliable and used for the final analysis [12].
The final CAP value was the median of each individual CAP value using the same valid measurements [13,14]. The steatosis grade (S) was determined using the following CAP-cutoff val- ues that have been reported earlier: 236 dB/m for S ≥1, 270 dB/m for S ≥2, and 302 dB/m for S ≥3. We characterized sig- nificant steatosis when CAP was over 302 dB/m [15-17].
Urinary albumin and creatinine levels were measured in a fasting, morning spot urine sample obtained from each partic- ipant. Urinary albumin levels were expressed as the urinary al- bumin-to-creatinine ratio (ACR) to minimize the influence of variations in kidney function. The urine albumin level was measured by an immunoturbidimetric method using an AU680 automated chemistry analyzer (Beckman Coulter Inc., Brea, CA, USA). The urine creatinine level was also measured using the AU680 analyzer (Beckman Coulter Inc.) by the ki- netic Jaffe method. Albuminuria was defined as urinary ACR
≥30 mg/g.
Clinical parameters and biochemical analysis
Body weight, waist circumference, blood pressure, glycemic
parameters (i.e., fasting plasma glucose and glycosylated he-
moglobin [HbA1c]), lipids (i.e., total cholesterol, high density
lipoprotein cholesterol [HDL-C], low density lipoprotein cho-
lesterol [LDL-C], and triglycerides), and liver enzymes (i.e., as-
partate aminotransferase [AST], alanine transaminase [ALT],
and gamma-glutamyl transferase [γ-GT]) were measured. An
eGFR was calculated using the Modification of Diet in Renal
Disease equation [18]. The homeostasis model assessment of
insulin resistance (HOMA-IR) was calculated as follows: fast-
ing glucose (mg/dL)×fasting insulin (μIU/L)/405. Subjects
were considered as obese when their body mass index (BMI)
was ≥25 kg/m
2. Central obesity was defined on the basis of the
waist circumference criteria from the Korean Society for the
Study of Obesity (≥90 cm for men and ≥85 cm for women)
[19]. Regular exercise was defined as more than 20 minutes per session and at least three times per week. Hypertension was defined as systolic pressure over 140 mm Hg and diastolic pressure over 90 mm Hg, or if the subject was currently pre- scribed antihypertensive medications. Cardiovascular disease was defined as any prior history of acute coronary syndromes, cerebrovascular accidents, or peripheral arterial diseases. The presence of diabetic neuropathy and diabetic retinopathy was defined by the patient’s medical record diagnosed by a neurol- ogist/ophthalmologist, or if the patient was currently pre- scribed medication for neuropathy/retinopathy.
Statistical analysis
Data are presented as mean±standard deviation for paramet-
ric variables and as median (IQR) for non-parametric variables or percent for categorical variables. We analyzed differences in the patient characteristics between the two groups using paired t-tests for parametric continuous variables and chi-square tests for categorical variables. The urinary ACR, total cholesterol, triglyceride, HDL-C, LDL-C, AST, ALT, γ-GT, insulin, and HOMA-IR values were not normally distributed; analyses, therefore, were performed using the Mann-Whitney U test.
The association between NAFLD and albuminuria was evalu- ated using the chi-square test after transforming the variables into tertiles. Correlations between urinary ACR, CAP, and other parameters were analyzed using Spearman’s correlation coefficients. Backward multiple linear regression analysis was performed on CAP to analyze the relationship between CAP Table 1. Baseline characteristics of study population
Characteristic Total
(n=100)
Patients without significant steatosis
(n=44)
Patients with significant steatosis
(n=56) P value
Age, yr 53.0±15.5 56.8±14.5 49.9±15.7 0.026
Male sex 53 (53.0) 23 (52.3) 30 (53.6) 0.897
Duration of T2DM, yr 7.1±7.3 8.9±8.7 5.7±5.9 0.036
Body mass index, kg/m
226.5±4.3 24.6±3.4 28.1±4.2 <0.001
Obesity 59 (59.0) 16 (36.4) 43 (76.8) <0.001
Waist circumference, cm 90.7±10.5 87.4±9.7 93.3±10.4 0.005
Central obesity 60 (60.0) 21 (47.7) 39 (69.6) 0.026
Current smoking 23 (23.0) 15 (34.1) 8 (14.8) 0.064
Regular exercise 33 (33.0) 14 (28.0) 19 (38.0) 0.288
SBP, mm Hg 126.7±12.5 125.1±13.0 128.0±12.0 0.229
DBP, mm Hg 72.8±11.7 70.1±14.0 74.9±9.0 0.056
FPG, mg/dL 136.5±50.1 142.8±58.8 131.5±42.0 0.267
HbA1c, % 7.9±2.0 8.0±2.2 7.9±2.0 0.986
PPPG, mg/dL 186.2±65.2 184.0±61.5 188.0±68.6 0.757
BUN, mg/dL 14.9±5.3 15.9±6.5 14.2±3.9 0.097
Creatinine, mg/dL 0.8±0.2 0.8±0.2 0.8±0.2 0.371
eGFR, mL/min/1.73 m
298.5±25.1 93.4±22.6 102.5±26.4 0.069
Albumin, mg/dL 4.6±0.4 4.5±0.4 4.6±0.4 0.602
Total cholesterol, mg/dL 150.0 (126.0–181.0) 142.5 (119.5–170.3) 159.0 (136.0–195.0) 0.019
Triglyceride, mg/dL 124.0 (101–177.7) 117.2 (90.4–157.6) 141.0 (111.0–185.0) 0.034
HDL-C, mg/dL 47.1 (36.4–53.4) 48.5 (35.3–58.0) 46.1 (40.1–52.1) 0.726
LDL-C, mg/dL 74.0 (54.5–94.0) 61.5 (47.0–81.0) 80.7 (63.3–100.1) 0.006
AST, IU/L 25.0 (19.0–37.0) 25.0 (19.0–40.8) 24.5 (20.0–36.3) 0.622
ALT, IU/L 29.0 (17.0–51.0) 28.5 (16.3–51.8) 29.5 (19.5–50.5) 0.391
(Continued to the next page)
and demographic and laboratory parameters. The relative risk factors for severe NAFLD were obtained using multiple logistic regression, and the risk was reported as odds ratios (ORs) with 95% confidence intervals (CIs). All statistical analyses were performed using SPSS version 25.0 (IBM Corp., Armonk, NY, USA). For all tests, P<0.05 was considered as statistically sig- nificant.
RESULTS
Baseline characteristics of the study population
Baseline characteristics according to the status of NAFLD are shown in Table 1. The prevalence of significant steatosis and albuminuria was 56.0% and 21.0%, respectively. Subjects with significant steatosis were significantly younger and had a sig- nificantly shorter duration of T2DM. They had greater waist
circumferences, higher BMI, total cholesterol, triglycerides, and LDL-C, than subjects without severe NAFLD (all P<0.05).
Furthermore, the proportion of central obesity and obesity was significantly higher in subjects with significant steatosis, whereas the proportion of hypertension and cardiovascular diseases was similar between the two groups. Liver function tests, including ALT, AST, γ-GT levels, were mostly within the normal range for both groups, with no significant difference between the values. The prevalence of albuminuria was higher in patients with significant steatosis than in subjects without significant steatosis (32.1% vs. 6.8%, P=0.002). Ninety-seven patients were prescribed metformin, and 35 patients were us- ing angiotensin-converting enzyme (ACE) inhibitors or angio- tensin II receptor blockers (ARB), and the proportion of anti- diabetic medications and ACE inhibitors/ARB was similar be- tween the severe and non-severe NAFLD groups. In addition, Table 1. Continued
Characteristic Total
(n=100)
Patients without significant steatosis
(n=44)
Patients with significant steatosis
(n=56) P value
γ-GT, IU/L 35.0 (21.0–55.0) 35.0 (17.3–52.8) 33.0 (23.0–61.0) 0.428
HOMA-IR 2.1 (1.2–4.0) 1.8 (1.3–3.8) 2.2 (1.4–4.3) 0.242
CAP, dB/m 302.3±47.2 260.3±29.9 335.3±28.2 <0.001
Liver stiffness measurement, kPa 6.1±2.6 5.7±2.7 6.4±2.5 0.194
Urinary ACR, mg/g creatinine 5.0 (1.7–17.2) 2.8 (1.1–8.0) 8.8 (2.4–50.8) 0.002
Albuminuria 21 (21.0) 3 (6.8) 18 (32.1) 0.002
Comorbidities
Hypertension 36 (35.0) 18 (40.9) 18 (32.1) 0.365
Cardiovascular disease 10 (10.0) 6 (13.6) 4 (7.1) 0.283
Diabetic retinopathy 6 (6.0) 4 (9.1) 2 (3.0) 0.249
Diabetic neuropathy 16 (16.0) 9 (20.5) 7 (12.5) 0.281
Medications
Metformin 97 (97.0) 43 (97.7) 54 (96.4) 0.706
Sulfonylurea 30 (30.0) 14 (31.8) 16 (28.6) 0.725
Thiazolidinedione 7 (7.0) 1 (2.3) 6 (10.7) 0.101
Insulin 24 (24.0) 9 (20.5) 15 (26.8) 0.462
Lipid lowering agents 70 (70.0) 29 (65.9) 41 (73.2) 0.429
ACE inhibitor/ARB 35 (35.0) 18 (40.9) 17 (30.4) 0.272
Values are presented as mean±standard deviation, number (%), or median (interquartile range).
T2DM, type 2 diabetes mellitus; SBP, systolic blood pressure; DBP, diastolic blood pressure; FPG, fasting plasma glucose; HbA1c, glycosylated
hemoglobin; PPPG, postprandial plasma glucose; BUN, blood urea nitrogen; eGFR, estimated glomerular filtration rate; HDL-C, high density
lipoprotein cholesterol; LDL-C, low density lipoprotein cholesterol; AST, aspartate transaminase; ALT, alanine transferase; γ-GT, gamma glu-
tamyltransferase; HOMA-IR, homeostatic model assessment of insulin resistance; CAP, controlled attenuation parameter; ACR, albumin-to-
creatinine ratio; ACE, angiotensin-converting enzyme; ARB, angiotensin II receptor blocker.
the fibrotic burden, LSM was comparable between the two groups.
Correlation between CAP and urinary ACR
After stratifying into CAP and urinary ACR tertiles (<2.39, 2.39 to 11.41, >11.41 mg/g), individuals with a higher CAP had a higher urinary ACR than those with a lower CAP (Fig.
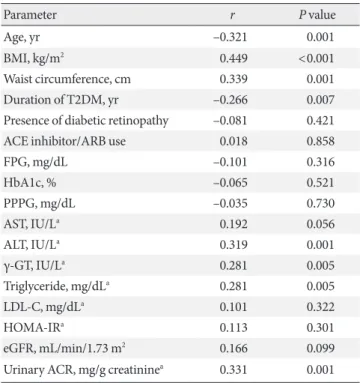
1A). When stratified by severity of NAFLD (S0, S1, S2, and S3 stages assigned to 12, 14, 18, and 56 subjects, respectively), the proportion of the highest urinary ACR tertile and significant albuminuria gradually increased and was the highest in sub- jects with S3 stage NAFLD (Fig. 1B and C). To assess the asso- ciation between CAP and other metabolic components, we performed a linear correlation analysis. As shown in Table 2, BMI, waist circumference, ALT, γ-GT, and urinary ACR posi- tively correlated with CAP, displaying statistical significance, whereas age and duration of T2DM showed a negative correla- tion with CAP. Furthermore, to determine which factors were significantly associated with CAP, we performed multiple lin- ear analyses (Table 3). After adjusting for age and sex in Model 1, BMI, waist circumference, and urinary ACR were indepen- dently associated with CAP. In Model 2, adjusting further for the geodemographic parameters, including duration of T2DM, diabetic retinopathy, and ACE inhibitors/ARB use, led to a sig- nificant association of triglyceride level, BMI, waist circumfer- ence, and urinary ACR with CAP. On further adjusting Model 2 for laboratory findings (HbA1c, ALT, γ-GT, and triglyceride)
Table 2. Correlation between CAP and other parameters
Parameter r P value
Age, yr –0.321 0.001
BMI, kg/m
20.449 <0.001
Waist circumference, cm 0.339 0.001
Duration of T2DM, yr –0.266 0.007
Presence of diabetic retinopathy –0.081 0.421
ACE inhibitor/ARB use 0.018 0.858
FPG, mg/dL –0.101 0.316
HbA1c, % –0.065 0.521
PPPG, mg/dL –0.035 0.730
AST, IU/L
a0.192 0.056
ALT, IU/L
a0.319 0.001
γ-GT, IU/L
a0.281 0.005
Triglyceride, mg/dL
a0.281 0.005
LDL-C, mg/dL
a0.101 0.322
HOMA-IR
a0.113 0.301
eGFR, mL/min/1.73 m
20.166 0.099
Urinary ACR, mg/g creatinine
a0.331 0.001 CAP, controlled attenuation parameter; BMI, body mass index;
T2DM, type 2 diabetes mellitus; ACE, angiotensin-converting en- zyme; ARB, angiotensin II receptor blocker; FPG, fasting plasma glu- cose; HbA1c, glycosylated hemoglobin; PPPG, postprandial plasma glucose; AST, aspartate transaminase; ALT, alanine transferase; γ-GT, gamma glutamyltransferase; LDL-C, low density lipoprotein choles- terol; HOMA-IR, homeostatic model assessment of insulin resistance;
eGFR, estimated glomerular filtration rate; ACR, albumin-to-creati- nine ratio.
a
Log transformed.
Fig. 1. Association between albuminuria and steatosis burden. (A) Association of urinary albumin-to-creatinine ratio (ACR) with controlled attenuation parameter (CAP) by tertiles. T1 for the lowest tertile, T2 for middle tertile, and T3 for the highest tertile group. (B) Association of urinary ACR tertiles according to the steatosis grade. T1 for the lowest tertile, T2 for middle tertile, and T3 for the highest tertile group. (C) Proportion of albuminuria (urinary ACR ≥30 mg/g) according to the steatosis grade. The steatosis grade (S) was determined using the following CAP-cutoff values: 236 dB/m for S ≥1, 270 dB/m for S ≥2, and 302 dB/m for S ≥3.
100 90 80 70 60 50 40 30 20 10 0
100 90 80 70 60 50 40 30 20 10 0
100 90 80 70 60 50 40 30 20 10 0
Pr op or tio n (%) Pr op or tio n (%) Pr op or tio n o f a lb umin ur ia (%)
CAP T1
(lowest) S0 S0
(n=12)
S1 S1
(n=14)
S2 S2
(n=18)
S3 S3
(n=56)
45.5 50.0
0 50.0
4.8 38.9
9.5
19.5 85.7
20.6 27.3
42.4 50.0
0
28.6 33.3 41.2 24.2 35.7
12.1 38.2 48.5 21.4 27.8 44.6
CAP T2 CAP T3 (highest)
Urinary ACR T3 (highest) Urinary ACR T2 Urinary ACR T1 (lowest)
P for trend=0.006 P for trend=0.001 P for trend=0.003
A B C
(Model 3), BMI, waist circumference, and urinary ACR re- mained independently associated factors. Finally, Model 3 ad- justed for BMI and waist circumference (Model 4) showed a significant association between urinary ACR and CAP.
Association between significant steatosis and urinary ACR We demonstrated a relationship between CAP and urinary ACR; likewise, we analyzed the clinical and demographical factors related to significant steatosis. Table 4 shows that age, BMI, waist circumference, duration of T2DM, triglycerides, LDL-C, and urinary ACR demonstrated a significant associa- tion with significant steatosis. Similar to the linear association, younger age and shorter duration of T2DM was associated with a higher risk of significant steatosis ([OR, 0.97; 95% CI, 0.94 to 0.99; P=0.030 for age], [OR, 0.94; 95% CI, 0.89 to 0.99;
P=0.034 for the duration of T2DM]), along with higher BMI, waist circumference, triglycerides, LDL-C, and urinary ACR (OR ranges 1.02 to 3.79; all P<0.05). To determine the inde- pendence of these risk factors, we performed multivariable lo- gistic regression analysis. After adjusting covariate factors in- cluding age, duration of T2DM, BMI, use of ACE inhibitors or ARB, LDL-C, and BMI, LDL-C, urinary ACR still remained statistically significant ([OR, 1.34; 95% CI, 1.15 to 1.57; P<
0.001 for BMI], [OR, 4.33; 95% CI, 1.20 to 15.63; P=0.025 for
LDL-C], [OR, 1.88; 95% CI, 1.31 to 2.71; P=0.001 for urinary ACR]).
DISCUSSION
This prospective and cross-sectional study demonstrates a sig- nificant association between CAP and urinary ACR, and an increased risk of significant steatosis in subjects with albumin- uria and T2DM. Urinary ACR showed a significant positive correlation with CAP and independently predicted fatty bur- den of NAFLD after adjustment for clinical variables, includ- ing age, sex, waist circumference, BMI, duration of T2DM, presence of diabetic retinopathy and the use of ACE inhibitor/
ARB, along with laboratory test results including HbA1c, ALT, γ-GT, triglycerides, and LDL-C. After further adjustments, we observed an approximately 2-fold rise in the adjusted risk of significant steatosis in patients with albuminuria and T2DM (OR, 1.88; 95% CI, 1.31 to 2.71; P=0.001).
There have been several attempts made to elucidate the asso- ciation between NAFLD and albuminuria. Although previous studies consistently indicated a strong association between NAFLD and chronic kidney disease (CKD) [20,21], the results from investigations regarding NAFLD and albuminuria are conflicting; especially in populations with T2DM. A meta- Table 3. Multiple linear regression analysis for CAP
Variable Model 1 Model 2 Model 3 Model 4
STD β P value STD β P value STD β P value STD β P value
Duration of T2DM, yr –0.160 0.135 - - - - - -
Diabetic retinopathy –0.414 0.680 - - - - - -
ACE inhibitor/ARB use 0.382 0.704 - - - - - -
HbA1c, % –0.177 0.083 –0.157 0.131 - - - -
ALT, IU/L
a0.153 0.119 0.195 0.081 - - - -
γ-GT, IU/L
a0.096 0.344 0.060 0.574 - - - -
Triglyceride, mg/dL
a0.198 0.062 0.213 0.047 - - - -
BMI, kg/m
20.391 0.001 0.380 <0.001 0.364 <0.001 - -
Waist circumference, cm 0.287 0.003 0.284 0.006 0.300 0.003 - -
Urinary ACR, mg/g creatinine
a0.305 0.001 0.321 0.001 0.299 0.004 0.321 0.001
Model 1: adjusted for age and sex; Model 2: adjusted for Model 1+duration of T2DM, diabetic retinopathy and ACE inhibitor/ARB use; Model 3: adjusted for Model 2+glycated hemoglobin, alanine aminotransferase
a, gamma glutamyl transferase
aand triglyceride
a; Model 4: adjusted for Model 3+body mass index and waist circumference.
CAP, controlled attenuation parameter; STD, standardized coefficient; T2DM, type 2 diabetes mellitus; ACE, angiotensin-converting enzyme;
ARB, angiotensin II receptor blocker; HbA1c, glycosylated hemoglobin; ALT, alanine transferase; γ-GT, gamma glutamyltransferase; BMI, body mass index; ACR, albumin-to-creatinine ratio.
a
Log transformed.
analysis study showed a 2.25-fold elevated risk of albuminuria among patients with NAFLD without diabetes; however, they could not find any significant association between albuminuria and NAFLD among subjects with diabetes [22]. A Chinese cross-sectional study of 1,763 patients with T2DM and NAFLD (ascertained using transient elastography), showed only a sig- nificant association between fibrotic burden and albuminuria, but not between steatosis burden and albuminuria, in subjects with T2DM [23]. Compared to the Chinese study, our study population was relatively younger (mean age 53.0±15.5 years vs. 60.7±11.5 years in the Chinese study), and had a shorter Table 4. Logistic regression analysis for significant steatosis
Parameter Odds ratio
(95% CI) P value Univariate logistic regression analysis
Age, yr 0.97 (0.94–0.99) 0.030
Male sex 1.05 (0.48–2.32) 0.897
BMI, kg/m
21.29 (1.13–1.48) <0.001
Waist circumference, cm 1.02 (1.02–1.11) 0.008 Duration of T2DM, yr 0.94 (0.89–0.99) 0.034 ACE inhibitors or ARB use 0.27 (0.28–1.44) 0.273
HbA1c, % 1.00 (0.83–1.21) 0.986
HOMA-IR
a1.32 (0.85–2.05) 0.223
AST, IU/L
a1.22 (0.52–2.86) 0.643
ALT, IU/L
a1.36 (0.74–2.51) 0.328
γ-GT, IU/L
a1.33 (0.76–2.32) 0.317
Triglyceride, mg/dL
a2.43 (1.04–5.68) 0.040
LDL-C, mg/dL
a3.79 (1.36–10.55) 0.011
Urinary ACR, mg/g creatinine
a1.54 (1.17–2.03) 0.002 Multivariable logistic regression analysis
Age, yr 1.02 (0.98–1.06) 0.443
BMI, kg/m
21.34 (1.15–1.57) <0.001
Duration of T2DM, yr 0.97 (0.89–1.05) 0.475 ACE inhibitors or ARB use 0.38 (0.12–1.14) 0.085
LDL-C, mg/dL
a4.33 (1.20–15.63) 0.025
Urinary ACR, mg/g creatinine
a1.88 (1.31–2.71) 0.001 CI, confidence interval; BMI, body mass index; T2DM, type 2 diabe- tes mellitus; ACE, angiotensin-converting enzyme; ARB, angiotensin II receptor blocker; HbA1c, glycosylated hemoglobin; HOMA-IR, homeostatic model assessment of insulin resistance; AST, aspartate transaminase; ALT, alanine transferase; γ-GT, gamma glutamyltrans- ferase; LDL-C, low density lipoprotein cholesterol; ACR, albumin-to- creatinine ratio.
a