Original Article
Associations between combinations of body mass index
plus non-alcoholic fatty liver disease and diabetes
mellitus among Korean adults
Sang-Hwan Kim
MD1, Ji-Won Lee
MD2, Hee-Jin Hwang
MD11
Department of Family Medicine, Myongji Hospital, Kwandong University College of Medicine, Goyang, Korea
2
Department of Family Medicine, Severance Hospital, Yonsei University College of Medicine, Seoul, Korea
The purpose of this study was to investigate associations between combinations of body mass index (BMI) cate-gories plus non-alcoholic fatty liver disease (NAFLD) and diabetes mellitus (DM) among Korean adults. We prepared the data of 5665 subjects aged 20 years and over who had visited a health promotion center. We ex-cluded 582 subjects as they had a viral or alcoholic liver disease. According to BMI-NAFLD status, the subjects were categorized as non-obese (BMI<25 kg/m2) without NAFLD (n=2568), obese (BMI≥25 kg/m2) without
NAFLD (n=572), non-obese with NAFLD (n=748), or obese with NAFLD (n=1195). The prevalence of NAFLD was highest in the obese subjects with DM (87.9%). In non-obese and non-DM subjects, the prevalence of NAFLD was lowest (18.4%). After adjustment of age, gender, waist circumference, smoking status, alcohol drinking, regular exercise, the odd ratios for DM or DM plus impaired fasting glucose (IFG) of subjects with mild NAFLD regardless of obesity were almost 2-fold compared to non-obese subjects without NAFLD. More-over, those of subjects with moderate or severe NAFLD regardless of obesity were about 4- fold. Clinicians and investigators need to pay attention to non-obese patients with fatty liver.
Key Words: fatty liver, glucose metabolism, diabetes, body mass index, obesity
INTRODUCTION
Diabetes mellitus (DM) is diagnosed and characterized by chronic hyperglycemia.1 The effects of DM include
long-term damage, dysfunction, and failure of various organs, especially the eyes, kidneys, heart, and blood vessels.2
The incidence of DM is increasing rapidly worldwide, with the economic burden of diabetes caused by increased health resource use and lost productivity increase rapidly.3
Non-alcoholic steatohepatitis (NASH) was first de-scribed by Ludwig et al.4 about 30 years ago and is now
considered part of a spectrum of non-alcoholic fatty liver diseases (NAFLD). Epidemiological studies have docu-mented that NAFLD is independently associated with obesity, hypertriglyceridemia, low HDL-cholesterol, insu-lin resistance.5-8 Patients with NAFLD have an increased
risk of developing not only liver but also cardiovascular morbidity.
Once the liver is fatty, the action of insulin to inhibit hepatic glucose production is impaired, which results in hyperglycemia and hyperinsulinemia.9 Although the
pre-valence of DM increased in obesity,10 not all obese subjects
are going to be DM patients. Furthermore, insulin resis-tance can be found even in lean individuals.11 NAFLD is
considered to be an important predisposing step in obese individuals towards the development of diabetes.12
However, in the cases of non-obese patients with fatty liver or obese patients without fatty liver, the relationship between their health status and DM is quite unknown.
The purpose of this study was to examine the prevalence of NAFLD in both non-obese and obese people according to DM classification and to investigate associations be-tween combinations of body mass index categories plus NAFLD and DM among Korean adults.
MATERIALS AND METHODS
Subjects
We prepared the data of 5665 subjects aged 20 years and over who had visited a health promotion center from Jan-uary 2006 and December 2007. Subjects were subse-quently divided into groups of normal glucose (NG), im-paired fasting glucose (IFG), and DM.13 Subjects with
normal fasting glucose had values below 100 mg/dL. Ac-cording to the American Diabetes Association guidelines,14
subjects with IFG were defined by fasting glucose values of 100 to 125 mg/dL. Subjects with DM were defined by fasting glucose above 126 mg/dL or by taking any hypo-glycemic agents including insulin.
Corresponding Author: Dr Hee-Jin Hwang, Department of
Family Medicine, Myongji Hospital, Kwandong University College of Medicine, 697-24, Hwajeong-dong, Deogyang-gu, Goyang, Gyeonggi-do, Korea.
Tel: 82-11-778-1052; Fax: 82-31-969-0500
Email: [email protected]; [email protected] Manuscript received 19 July 2010. Initial review completed 13 October 2010. Revision accepted 25 November 2010.
We excluded subjects from the analysis if they had a daily alcohol consumption of more than 2 drinks (alcohol use ≥30 g/day) for men or more than 1.5 drinks (alcohol use ≥20 g/day) for women. We also excluded subjects who were positive for the hepatitis B surface antigen or hepatitis C virus antibody. Subjects who had a medical history of chronic liver disease or liver cirrhosis, as well as those taking current medications for liver disease were also excluded from the study. The final study population consisted of 5083 subjects (2552 men and 2531 women). The institutional review board of the Myongji Hospital approved this study.
Measurements
During subjects’ health promotion center visits, medical
history and life-style-related data (alcohol consumption, smoking, and exercise status) were collected via a ques-tionnaire and history taking. Current medication use was verified by an examination of prescriptions. A smoking habit was defined as currently smoking cigarettes. Alco-hol consumption was measured according to the amount of alcohol more than one bottle of soju (a kind of distilled spirits containing 56.8 g of pure alcohol) consumed per week. Regular exercise was defined as 30 min or more at a time, three times per week regularly.
Body weight was measured to the nearest 0.1 kg using an electronic scale. Height was measured to the nearest 0.1 cm using a stadiometer. Body mass index (BMI) was calculated as weight/height2 (kg/m2). Obesity was defined
as BMI over 25 according to Western Pacific Region of
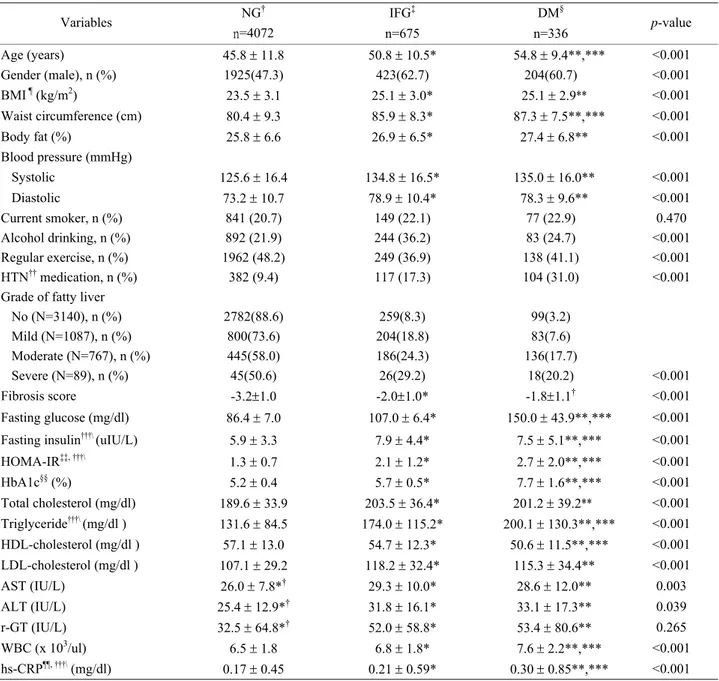
Table 1. Clinical and metabolic characteristics of subjects
NG† IFG‡ DM§ Variables n=4072 n=675 n=336 p-value Age (years) 45.8 ± 11.8 50.8 ± 10.5* 54.8 ± 9.4**,*** <0.001 Gender (male), n (%) 1925(47.3) 423(62.7) 204(60.7) <0.001 BMI ¶ (kg/m2) 23.5 ± 3.1 25.1 ± 3.0* 25.1 ± 2.9** <0.001 Waist circumference (cm) 80.4 ± 9.3 85.9 ± 8.3* 87.3 ± 7.5**,*** <0.001 Body fat (%) 25.8 ± 6.6 26.9 ± 6.5* 27.4 ± 6.8** <0.001 Blood pressure (mmHg) Systolic 125.6 ± 16.4 134.8 ± 16.5* 135.0 ± 16.0** <0.001 Diastolic 73.2 ± 10.7 78.9 ± 10.4* 78.3 ± 9.6** <0.001 Current smoker, n (%) 841 (20.7) 149 (22.1) 77 (22.9) 0.470 Alcohol drinking, n (%) 892 (21.9) 244 (36.2) 83 (24.7) <0.001 Regular exercise, n (%) 1962 (48.2) 249 (36.9) 138 (41.1) <0.001 HTN†† medication, n (%) 382 (9.4) 117 (17.3) 104 (31.0) <0.001
Grade of fatty liver
No (N=3140), n (%) 2782(88.6) 259(8.3) 99(3.2) Mild (N=1087), n (%) 800(73.6) 204(18.8) 83(7.6) Moderate (N=767), n (%) 445(58.0) 186(24.3) 136(17.7) Severe (N=89), n (%) 45(50.6) 26(29.2) 18(20.2) <0.001 Fibrosis score -3.2±1.0 -2.0±1.0* -1.8±1.1† <0.001 Fasting glucose (mg/dl) 86.4 ± 7.0 107.0 ± 6.4* 150.0 ± 43.9**,*** <0.001 Fasting insulin†††\ (uIU/L) 5.9 ± 3.3 7.9 ± 4.4* 7.5 ± 5.1**,*** <0.001
HOMA-IR‡‡, †††\ 1.3 ± 0.7 2.1 ± 1.2* 2.7 ± 2.0**,*** <0.001 HbA1c§§ (%) 5.2 ± 0.4 5.7 ± 0.5* 7.7 ± 1.6**,*** <0.001 Total cholesterol (mg/dl) 189.6 ± 33.9 203.5 ± 36.4* 201.2 ± 39.2** <0.001 Triglyceride†††\ (mg/dl ) 131.6 ± 84.5 174.0 ± 115.2* 200.1 ± 130.3**,*** <0.001 HDL-cholesterol (mg/dl ) 57.1 ± 13.0 54.7 ± 12.3* 50.6 ± 11.5**,*** <0.001 LDL-cholesterol (mg/dl ) 107.1 ± 29.2 118.2 ± 32.4* 115.3 ± 34.4** <0.001 AST (IU/L) 26.0 ± 7.8*† 29.3 ± 10.0* 28.6 ± 12.0** 0.003 ALT (IU/L) 25.4 ± 12.9*† 31.8 ± 16.1* 33.1 ± 17.3** 0.039 r-GT (IU/L) 32.5 ± 64.8*† 52.0 ± 58.8* 53.4 ± 80.6** 0.265 WBC (x 103/ul) 6.5 ± 1.8 6.8 ± 1.8* 7.6 ± 2.2**,*** <0.001 hs-CRP¶¶, †††\ (mg/dl) 0.17 ± 0.45 0.21 ± 0.59* 0.30 ± 0.85**,*** <0.001
Data are shown as means ± the standard deviation.
†fasting blood sugar (FBS) <100 mg/dL, ‡100≤FBS<126 mg/dL, §FBS≥126 mg/dL or taken anti-diabetic agents, ¶body mass index, ††
hyper-tension, ‡‡homeostasis model assessment of insulin resistance, §§hemoglobin A1c, ¶¶high sensitivity C-reactive protein, †††\values have been
analyses after log-transformation
*NG versus IFG: p<0.05, **NG versus DM: p<0.05, ***IFG versus DM: p<0.05.
Fibrosis score=-1.675 + 0.037 x age (years) + 0.094 x BMI (kg/m2) + 1.13 x IFG/diabetes (yes = 1, no = 0) + 0.99 x AST/ALT ratio - 0.013 x platelet (x109/l) - 0.66 x albumin (g/dl).
WHO criteria.15 Waist circumference was measured
midway between the lowest rib and the iliac crest with subjects in the standing position. The percent body fat was determined using bioelectrical impedance analysis (InBody 720, Biospace Co., Seoul, Korea). An abdominal ultrasonography was conducted to assess the presence and severity of NAFLD. The same operator who was blinded to the medical histories and laboratory results of the par-ticipants performed all of the ultrasounds. Fatty liver was diagnosed on ultrasound when there is a diffuse increased echogenicity of the liver texture compared to the right kidney. The ultrasounds were performed with a high reso-lution B-mode scanner (EnVisor HD, version C.0.1, USA). Blood samples collected after overnight fasting (>12 hours), and were analyzed for fasting glucose, lipid me-tabolites indices such as total cholesterol, triglyceride, HDL-cholesterol, LDL-cholesterol (ADVIA 1650, Sie-mens, Tarrytown, NY, USA), and hemoglobin A1c (HbA1c) (HLC-723GHb, TOSOH, Siba, Minaoto-ku, Japan). We measured high-sensitive C-reactive protein as a marker of systemic low-grade inflammation, which was measured by turbidmetric immunoassay using a Hitachi 7170 S (Hitachi Hi-Tech, Tokyo, Japan). Additionally, insulin was measured by chemiluminescence using Advia Centaur XP (Siemens Healthcare Diagnostics, Los Ange-les, CA, USA) and, as a marker of insulin resistance, ho-meostasis model assessment of insulin resistance (HOMA-IR) index [(Insulin (μIU/ml) × Fasting glucose (mg/dl)/18)/22.5]) was calculated.
Statistical analyses
Data are presented as mean±SD. Variables such as fasting insulin, HOMA-IR, triglyceride, and hs-CRP were loga-rithmically transformed prior to statistical analyses to approximate a normal distribution. Clinical characteristics were compared among the three groups using one-way analysis of variance. Prevalence of NAFLD in both non-obese and non-obese people according to DM categories was calculated with chi-square test. After adjusting for age, gender and waist circumference, an analysis of covari-ance was used to seek differences in adiposity indices, glucose metabolism-related parameters, liver functions,
and fibrosis score among BMI-NAFLD categories. A logistic regression analysis for DM or DM plus IFG was performed to determine the associations with combina-tions of BMI categories plus NAFLD grades after ad-justment of potential confounders. Significance was de-fined at the 0.05 level of confidence. All calculations were performed using the SPSS software, version 15.0 (SPSS, Chicago, IL, USA).
RESULTS
Baseline characteristics of the subjects
Clinical and metabolic characteristics of the subjects are presented in Table 1. Statistic significances were found in age, gender, BMI, waist circumference, body fat, blood pressure, alcohol, exercise, hypertension, grade of fatty liver, fibrosis score, glucose indices, lipid profiles, AST, ALT, WBC and hs-CRP between normal glucose, IFG, and DM group. Current smoking and r-GT were not sig-nificantly different between 3 groups.
Prevalence of NAFLD in both non-obese and obese people according to DM categories
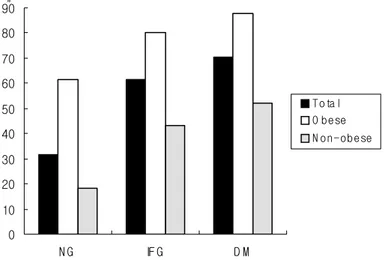
Overall prevalence of NAFLD in the present study was 38.2% and the prevalences of NAFLD in subjects with normal glucose, IFG, and DM were 31.7%, 61.6%, and 70.5%. In both obese and non-obese subjects, prevalence of NAFLD increased according to DM categories. Preva-lence of NAFLD was lowest in the non-obese group with normal glucose (18.4%), highest in the obese group with diabetes (87.9%). (Figure 1)
Associations between BMI-NAFLD categories and glu-cose metabolism
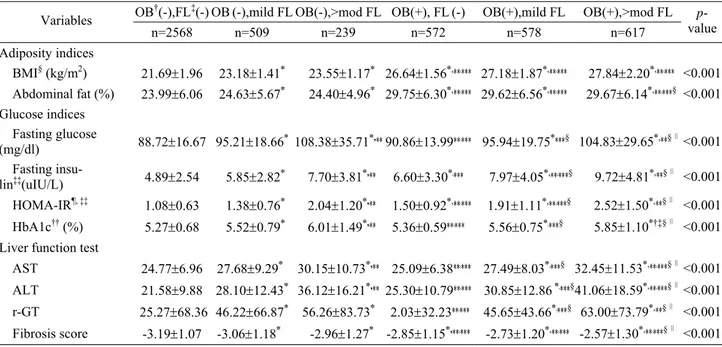
Having either obesity or not, subjects with NAFLD have higher glucose indices, liver enzyme levels, and fibrosis scores than non-obese subjects without NAFLD. And non-obese subjects with moderate or severe NAFLD also have higher glucose indices than obese subjects without NAFLD. In each obesity or non-obesity group, all vari-ables show an increasing tendency according to the sever-ity of NAFLD (Table 2).
After adjustment of age, gender, waist circumference,
0 10 20 30 40 50 60 70 80 90 N G IF G D M % T ota l O be se N o n -o b e se
Figure 1. Prevalence of NAFLD in subjects with normal glucose (NG), impaired fasting glucose (IFG), and diabets mellitus (DM) accord-ing to obesity. NG: fastaccord-ing blood sugar (FBS) <100 mg/dL, IFG: 100≤FBS<126 mg/dL, DM: FBS≥126 mg/dL or taken anti-diabetic agents.
smoking status, alcohol drinking, regular exercise, the odds ratios (95% confidence interval) for DM were 1.00 (0.59-1.73) in obese participants without NAFLD, 1.72 (1.13-2.62) in non-obese participants with mild NALFD, 5.53 (3.62-8.46) in non-obese participants with moderate or severe NALFD, 1.91 (1.18-3.07) in obese participants with mild NALFD and 4.45 (2.83-6.99) in obese partici-pants with moderate or severe NALFD compared with non-obese individuals without NALFD. And odds ratios (95% confidence interval) for DM+IFG were 1.16 (0.85-1.57) in obese participants without NAFLD, 1.91 (1.47-2.46) in non-obese participants with mild NALFD, 4.39 (3.23-5.97) in non-obese participants with moderate or severe NALFD, 2.10 (1.57-2.81) in obese participants with mild NALFD and 3.80 (2.83-5.09) in obese partici-pants with moderate or severe NALFD compared with non-obese individuals without NALFD (Table 3).
DISCUSSION
The number of patients with DM have increased world-wide.10 In order to prevent the development of DM,
med-ical interventions such as metformin or life style change have been studied.16,17 WHO proposed two approaches
for the prevention of DM. One is preventing obesity in general population, and the other is preventing and delay-ing the development of DM in high-risk groups.18
There-fore, it is important to find patients at high-risk of DM and manage their changeable risk factors.
In a study among healthy Japanese adults, the preva-lence of NAFLD was 27% in subjects with normal glu-cose and 43% in those with impaired fasting gluglu-cose and 62% in subjects with diabetes.19 In our study, overall
pre-valence of NAFLD in the present study was 38.2% and prevalence of NAFLD in subjects with normal glucose, impaired fasting glucose, and DM were 31.7%, 61.6%, and 70.5%. Although the prevalence of NAFLD in obese subjects was higher than in non-obese subjects, preva-lence of NAFLD in both obese and non-obese subjects increased according to DM categories.
There have been many studies about the relationship between obesity and DM.20-22 and NAFLD is well known
to be associated with DMand insulin resistance.23-29 Most
Table 2. Adiposity indices and glucose metabolism related variables according to BMI-NAFLD categories
OB†(-),FL‡(-) OB(-),mild FL OB(-),>mod FL OB(+), FL(-) OB(+),mild FL OB(+),>mod FL
Variables n=2568 n=509 n=239 n=572 n=578 n=617 p-value Adiposity indices BMI§ (kg/m2) 21.69±1.96 23.18±1.41* 23.55±1.17* 26.64±1.56*,**,*** 27.18±1.87*,**,*** 27.84±2.20*,**,*** <0.001 Abdominal fat (%) 23.99±6.06 24.63±5.67* 24.40±4.96* 29.75±6.30*,**,*** 29.62±6.56*,**,*** 29.67±6.14*,**,***§ <0.001 Glucose indices Fasting glucose (mg/dl) 88.72±16.67 95.21±18.66* 108.38±35.71*,** 90.86±13.99**,*** 95.94±19.75****§ 104.83±29.65*,**§∥<0.001 Fasting insu-lin‡‡(uIU/L) 4.89±2.54 5.85±2.82* 7.70±3.81*,** 6.60±3.30*,*** 7.97±4.05*,**,***§ 9.72±4.81*,**§∥ <0.001 HOMA-IR¶, ‡‡ 1.08±0.63 1.38±0.76* 2.04±1.20*,** 1.50±0.92*,**,*** 1.91±1.11*,**,***§ 2.52±1.50*,**§∥ <0.001 HbA1c†† (%) 5.27±0.68 5.52±0.79* 6.01±1.49*,** 5.36±0.59**,*** 5.56±0.75*,***§ 5.85±1.10*†‡§∥ <0.001 Liver function test
AST 24.77±6.96 27.68±9.29* 30.15±10.73*,** 25.09±6.38**,*** 27.49±8.03*,***§ 32.45±11.53*,**,***§∥<0.001
ALT 21.58±9.88 28.10±12.43* 36.12±16.21*,** 25.30±10.79**,*** 30.85±12.86 *,***§ 41.06±18.59*,**,***§∥<0.001
r-GT 25.27±68.36 46.22±66.87* 56.26±83.73* 2.03±32.23**,*** 45.65±43.66*,***§ 63.00±73.79*,**§∥ <0.001
Fibrosis score -3.19±1.07 -3.06±1.18* -2.96±1.27* -2.85±1.15*,**,*** -2.73±1.20*,**,*** -2.57±1.30*,**,***§∥ <0.001
P-values were calculated by the ANCOVA model, adjusted for age, gender and waist circumference. Data are shown as mean ± standard
error.
†obesity, ‡non-alcoholic fatty liver disease, §body mass index, ¶homeostasis model assessment of insulin resistance, ††hemoglobin A1c, ‡‡values have been analyses after log-transformation
*
p<0.05 vs. OB(-), FL(-),**p<0.05 vs. OB(-),mild FL, ***p<0.05 vs OB(-),>moderate FL, §p<0.05 vs OB(+), FL(-) , ∥p<0.05 vs OB(+),
mild FL.
Table 3. Logistic regression analysis for DM or DM plus IFG
DM†, OR (95% CI) DM + IFG‡, OR (95% CI)
Dependant variable
Prevalence Crude Adjusted Prevalence Crude Adjusted
OB§(-), FL¶(-) 3.04 1 1 10.48 1 1 OB (-), mild 7.47 2.58 (1.73-3.84) 1.72 (1.13-2.62) 24.75 2.81 (2.22-3.57) 1.91 (1.47-2.46) OB (-),>mod 19.67 7.82 (5.29-11.55) 5.53 (3.62-8.46) 43.10 6.47 (4.87-8.61) 4.39 (3.23-5.97) OB (+), FL(-) 3.67 1.23 (0.75-1.99) 1.00 (0.59-1.73) 15.56 1.58 (1.22-2.04) 1.16 (0.85-1.57) OB (+), mild 7.79 2.70 (1.85-3.94) 1.91 (1.18-3.07) 27.85 3.30 (2.64-4.12) 2.10 (1.57-2.81) OB (+),>mod 17.34 6.70 (4.93-9.10) 4.45 (2.83-6.99) 42.63 6.35 (5.18-7.78) 3.80 (2.83-5.09)
Adjusted by age, gender, waist circumference, smoking status, alcohol drinking, regular exercise. Prevalence is shown as %.
studies mentioned obesity explaining relationship of NAFLD and DM and insulin resistance. But, DM is not always found in obese person.
In our study, subjects with NAFLD had higher in all glucose intolerance indexes (fasting glucose, fasting insu-lin, HOMA-IR, HbA1c) than non-obese subjects without NAFLD regardless of obesity. It is of interest that non-obese subjects with moderate or severe NAFLD also had higher in all glucose intolerance indexes than obese sub-jects without NAFLD. Similarly, fasting glucose and HbA1c of non-obese subjects with mild NAFLD were higher than those of obese subjects without NAFLD. In addition, odd ratios for DM or DM plus IFG of subjects with mild NAFLD regardless of obesity were almost 2- fold compared to non-obese subjects without NAFLD. Moreover, the odd ratios of subjects with moderate or severe NAFLD regardless of obesity were almost 4- fold compared to non-obese subjects without NAFLD. How-ever, this relationship was not found in obese subjects without NAFLD.
Insulin, the most important hormone in diabetes, pro-motes glucose disposal in adipose tissue and muscle and prevents glucose production by inhibition of glyco-genolysis and gluconeogenesis in the liver, one of the insulin-sensitive tissues in the human body.30 A defect in
insulin suppression of glucose production is found in fatty liver9 and then glucose production increases as a
conse-quence of increased hepatic gluconeogenesis.31
There were several limitations in this study. It was not possible to determine if NAFLD itself regardless of osity plays a causal role in the development of DM be-cause of the cross-sectional nature of this study. In this study, NAFLD was diagnosed through the abdominal ultrasonography. Although sensitivity is reduced when hepatic fat infiltration upon liver biopsy is less than 33%, ultrasonography has a sensitivity of 90% and a specificity of 95% in detecting moderate and severe steatosis.32
There were several confounders affecting to NAFLD in this study, including liver disease and alcohol consump-tion. We excluded subjects who had liver disease such as viral and alcoholic origin and used statistical analysis after adjusting for lifestyle factors such as smoking, alco-hol habit and exercise. This was done to lower the possi-bility of residual confounding effects.
Clinically, these fatty liver and obesity are all readily measured and are usually used as a part of routine health check-up programs in Korea. Our data may suggest that liver ultrasonography may be a better screening tool than the BMI for detecting high-risk group of DM in general population and is a non-invasive procedure. Nowadays attention is focused on the prevention, earlier diagnosis and more aggressive control of DM in high-risk groups. Therefore, clinicians and investigators need to pay atten-tion to non-obese patients with fatty liver.
AUTHOR DISCLOSURES
No conflicts of interest.
REFERENCES
1. American Diabetes Association. Report of the expert com-mittee on the diagnosis and classification of diabetes melli-tus. Diabetes Care. 1997;20:1183-97.
2. Barzilay JI, Spiekerman CF, Wahl PW, Kuller LH, Cush-man M, Furberg CD, Dobs A, Polak JF, Savage PJ. Cardio-vascular disease in older adults with glucose disorders: Comparison of American Diabetes Association criteria for diabetes mellitus with WHO criteria. Lancet. 1999;354:622-5. 3. O Brien JA, Patrick AR, Caro J. Estimates of direct medical
costs for microvascular and macrovascular complications resulting from type 2 diabetes mellitus in the United States in 2000. Clin Ther. 2003;25:1017-38.
4. Ludwig J, Viggiano TR, McGill DB, Oh BJ. Nonalcoholic steatohepatitis: Mayo Clinic experience with a hitherto un-named disease. Mayo Clin Proc. 1980;55:434-8.
5. Clark JM, Brancati FL, Diehl AM. The prevalence and eti-ology of elevated aminotransferase levels in the United States. Am J Gastroenterol. 2003;98:960-7.
6. Ruhl CE, Everhart JE. Determinants of the association of overweight with elevated serum alanine aminotransferase activity in the United States. Gastroenterology. 2003;124: 71-9.
7. Cortez-Pinto H, Camilo ME, Baptista A, De Oliveira AG, De Moura MC. Non-alcoholic fatty liver: another feature of the metabolic syndrome? Clin Nutr. 1999;18:353-8. 8. Laine F, Bendavid C, Moirand R, Tessier S, Perrin M,
Guil-lygomarch A et al. Prediction of liver fibrosis in patients with features of the metabolic syndrome regardless of alco-hol consumption. Hepatology. 2004;39:1639-46.
9. Seppala-Lindroos A, Vehkavaara S, Hakkienen AM, Goto T, Westerbacka J, Sovijarvi A Halavaara J, Yki-Jarvinen H. Fat accumulation in the liver is associated with defects in insulin suppression of glucose production and serum free fatty acids independent of obesity in normal men. J Clin En-docrinol Metab. 2002;87:3023-8.
10. Harris MI, Flegal KM, Cowie CC, Eberhardt MS, Goldstein DE, Little RR, Wiedmeyer HM, Byrd-Holt DD. Prevalence of diabetes, impaired fasting glucose, and imparted glucose tolerance in US adults: the Third National Health and Nutri-tion ExaminaNutri-tion Survey, 1988-94. Diabetes Care. 1998;21: 518-24.
11. Reaven GM. Banting lecture 1988. Role of insulin resis-tance in human disease. Diabetes. 1988;37:1595-607. 12. Adams LA, Waters OR, Knuiman MW, Elliott RR, Olynyk
JK. NAFLD as a risk factor for the development of diabetes and the metabolic syndrome: an eleven-year follow-up study. Am J Gastroenterol. 2009;104:861-7.
13. Genuth S, Alberti KG, Bennett P, Buse J, Defronzo R, Kahn R et al. Expert committee on the diagnosis and classification of diabetes mellitus. Follow-up report on the diagnosis of diabetes mellitus. Diabetes Care. 2003;26:3160-7.
14. The Expert Committee on the Diagnosis and Classification of Diabetes Mellitus. Follow-up report on the diagnosis of diabetes mellitus. Diabetes Care. 2004;26:3160-7.
15. Western Pacific Regional Office of the World Health Or-ganization, the International Obesity Task Force. The Asia-Pacific perspective: redefining obesity and its treatment. Sydney: Health Communications Australia; 2000.
16. Knowler WC, Barrett-Connor E, Fowler SE, Hamman RF, Lachin JM, Walker EA, Nathan DM. Diabetes Prevention Program Research Group. Diabetes Prevention Program Re-search Group. Reduction in the incidence of type 2 diabetes with lifestyle intervention or metformin. N Engl J Med. 2002;346:393-403.
17. Tuomilehto J, Lindström J, Eriksson JG, Valle TT, Hama-lainen H, Ilanne-Parikka P et al. Prevention of type 2 diabe-tes mellitus by changes in lifestyle among subjects with im-paired glucose tolerance. N Engl J Med. 2001;344:1343-50.
18. WPDD committee. Plan of action for the Western Pacific Declaration on Diabetes 2000~2005. Manila: World Health Organization Western Pacific Regional Office; 2001. 19. Jimba S, Nakagami T, Takahashi M, Wakamatsu T, Hirota
Y, Iwamoto Y, Wasada T. Prevalence of non-alcoholic fatty liver disease and its association with impaired glucose me-tabolism in Japanese adults. Diabet Med. 2005;22:1141-5. 20. Kasuga M. Insulin resistance and pancreatic beta cell failure.
J Clin Invest. 2006;116:1756-60.
21. Feinleib M. Epidemiology of obesity in relation to health hazards. Ann Intern Med. 1985;103:1019-24.
22. Ohlson LO, Larsson B, Bjorntorp P, Eriksson H, Svardsudd K, Welin L, Tibblin G, Wilhelmsen L. Risk factors for type 2 (non-insulin-dependent) diabetes mellitus. Thirteen and one-half years of follow-up of the participants in a study of Swedish men born in 1913. Diabetologia. 1988;31:798-805. 23. Bacon BR, Farahvash MJ, Janney CG, Neuschwander-Tetri
BA. Nonalcoholic steatohepatitis: an expanded clinical en-tity. Gastroenterology. 1994;107:1103-9.
24. Powell EE, Cooksley WG, Hanson R, Searle J, Halliday JW, Powell LW. The natural history of nonalcoholic steatohepa-titis: a follow-up study of forty-two patients for up to 21 years. Hepatology. 1990;11:74-80.
25. Lee RG. Nonalcoholic steatohepatitis: a study of 49 patients. Hum Path. 1989;20:594-8.
26. Marchesini G, Brizi M, Morselli-Labate AM, Bianchi G, Bugianesi E, McCullough AJ. Association of nonalcoholic fatty liver disease with insulin resistance. Am J Med. 1999; 107:450-5.
27. Cortez-Pinto H, Camilo ME, Baptista A, De Oliveira AG, De Moura MC. Non-alcoholic fatty liver: another feature of the metabolic syndrome? Clin Nutr. 1999;18:353-8.
28. Sanyal AJ, Campbell-Sargent C, Mirshahi F, Rizzo WB, Contos MJ, Sterling RK. Nonalcoholic steatohepatitis: asso-ciation of insulin resistance and mitochondrial abnormalities. Gastroenterology. 2001;120:1183-92.
29. Capeau J. Insulin resistance and steatosis in humans. Diabe-tes Metab. 2008;34:649-57.
30. Yki-Jarvinen H. Action of insulin on glucose metabolism in vivo. Baillieres Clin Endocrinol Metab. 1993;7:903-27. 31. Magnusson I, Rothman DL, Katz Ld, Shulman RG,
Shul-man GI. Increased rate of gluconeogenesis in type II diabe-tes mellitus. A 13C nuclear magnetic resonance study. J Clin Invest. 1992;90:1323-7.
32. Saadeh S, Younossi ZM, Remer EM, Gramlich T, Ong JP, Hurley M et al. The utility of radiological imaging in non-alcoholic fatty liver disease. Gastroenterology. 2002;123: 745-50.
Original Article
Associations between combinations of body mass index
plus non-alcoholic fatty liver disease and diabetes
mellitus among Korean adults
Sang-Hwan Kim
MD1, Ji-Won Lee
MD2, Hee-Jin Hwang
MD11
Department of Family Medicine, Myongji Hospital, Kwandong University College of Medicine, Goyang, Ko-rea
2
Department of Family Medicine, Severance Hospital, Yonsei University College of Medicine, Seoul, Korea