Relationship of Liver Stiffness and Controlled Attenuation Parameter Measured by Transient Elastography with Diabetes Mellitus in Patients with Chronic Liver Disease
High prevalence of diabetes mellitus in patients with liver cirrhosis has been reported in many studies. The aim of our study was to evaluate the relationship of hepatic fibrosis and steatosis assessed by transient elastography with diabetes in patients with chronic liver disease. The study population consisted of 979 chronic liver disease patients. Liver fibrosis and steatosis were assessed by liver stiffness measurement (LSM) and controlled
attenuation parameter (CAP) on transient elastography. Diabetes was diagnosed in 165 (16.9%) of 979 patients. The prevalence of diabetes had significant difference among the etiologies of chronic liver disease. Higher degrees of liver fibrosis and steatosis, assessed by LSM and CAP score, showed higher prevalence of diabetes (F0/1 [14%], F2/3 [18%], F4 [31%], P < 0.001; S0/1 [15%], S2 [17%], S3 [26%], P = 0.021). Multivariate analysis showed that the independent predictive risk factors for diabetes were hypertension (OR, 1.98; P = 0.001), LSM F4 (OR, 1.86; P = 0.010), male gender (OR, 1.60; P = 0.027), and age > 50 yr (OR, 1.52; P = 0.046). The degree of hepatic fibrosis but not steatosis assessed by transient elastography has significant relationship with the prevalence of diabetes in patients with chronic liver disease.
Keywords: Chronic Liver Disease; Diabetes Mellitus; Transient Elastography; Fibrosis;
Steatosis Jem Ma Ahn, Yong-Han Paik,
So Hyun Kim, Jun Hee Lee, Ju Yeon Cho, Won Sohn, Geum-Youn Gwak,
Moon Seok Choi, Joon Hyeok Lee, Kwang Cheol Koh, Seung Woon Paik, and Byung Chul Yoo
Department of Medicine, Samsung Medical Center, Sungkyunkwan University School of Medicine, Seoul, Korea
Received: 22 January 2014 Accepted: 7 May 2014 Address for Correspondence:
Yong-Han Paik, MD
Department of Medicine, Samsung Medical Center, Sungkyunkwan University School of Medicine, 81 Irwon-ro, Gangnam-gu, Seoul 135-710, Korea
Tel: +82.2-3410-3878, Fax: +82.2-3410-6983 E-mail: [email protected]
http://dx.doi.org/10.3346/jkms.2014.29.8.1113 • J Korean Med Sci 2014; 29: 1113-1119
INTRODUCTION
The prevalence of diabetes mellitus in patients with liver cir- rhosis is higher compared to that in the general population. The prevalence of diabetes has been reported to be between 30%
and 70% depending on the etiology, the severity of liver disease, and the diagnostic criteria (1, 2). Nonalcoholic fatty liver dis- ease (NAFLD), chronic hepatitis C (CHC), hemochromatosis, and alcoholic liver disease (ALD) are regarded as major chronic liver diseases associated with diabetes (2). The prevalence of diabetes was reported to be between 21% and 45% in NAFLD (3), between 17% and 33% in CHC (1, 4), between 50% and 85%
in advanced hemochromatosis (1), and 18% in ALD (5), respec- tively. The relationship of diabetes with chronic hepatitis B (CHB) is uncertain (6-8), although the prevalence of diabetes increas- es in patients with hepatitis B-related liver cirrhosis (2). The re- lationship of diabetes in patients with chronic liver disease can be explained by the simultaneous occurrence of the following two abnormalities: an inadequate secretion of insulin due to decreased response of the beta-cells and insulin resistance in muscle and adipose tissue (1).
Many studies have reported the association between liver cirrhosis or steatosis and diabetes. However, most of the previ-
ous studies were small-scale studies where liver biopsy was performed to measure the degree of liver fibrosis or steatosis.
Liver biopsy has been regarded as the gold standard for the as- sessment of fibrosis or steatosis. However, a biopsy sample rep- resents only 1/50,000 of the total liver volume, and therefore bi- opsy has its limitation in accurate assessment of the whole liver.
Moreover, it has a limited use because of possible complications due to its invasive nature (9). Regarding the relationship between steatosis and diabetes, several large-scaled studies have used abdominal ultrasonography to assess fatty liver change. How- ever abdominal ultrasonography has a limitation to assess the degree of fatty liver because of the subjective interpretation by sonographers (10-13).
Recently, transient elastography has been emerging as a rel- evant tool for assessing hepatic steatosis as well as hepatic fi- brosis. In transient elastography, liver fibrosis is indicated by liver stiffness measurement (LSM), and steatosis, by controlled attenuation parameter (CAP) score (14-17). Several meta-anal- yses have demonstrated the usefulness of transient elastogra- phy: sensitivity of 87%, and specificity of 91% for the diagnosis of liver cirrhosis (14). In addition, CAP score in transient elas- tography has been shown to be significantly correlated with the grade of steatosis in several studies (15-17). Transient elastog- Gastroenterology & Hepatology
raphy has several advantages; it is quick, inexpensive, repro- ducible, and noninvasive and it can sample about 100 times larger portion of liver tissue than liver biopsy (16, 18).
We aimed to evaluate the relationship of hepatic fibrosis and steatosis assessed by transient elastography with diabetes mel- litus in patients with chronic liver disease, especially CHB.
MATERIALS AND METHODS Study population
The study population consisted of 1,383 patients who under- went transient elastography from August 2012 to March 2013 at Samsung Medical Center, Seoul, Korea. Among these patients, those who had one of the following 4 etiologies of liver disease were included; CHB, CHC, ALD, and NAFLD. Exclusion criteria were as follows: 1) alanine aminotransferase (ALT) level > 2 x upper normal limit; 2) total bilirubin (TB) > 1.5 mg/dL; 3) in- terquartile ratio (IQR)/median of both LSM and CAP score > 0.3;
4) miscellaneous other etiologies of liver disease; 5) overlap- ping etiologies; 6) lack of data. After exclusion, a total of 979 pa- tients were analyzed in the study.
Assessment of lifestyle and biochemical parameters At the time of performing transient elastography, information regarding alcohol consumption (quantity and frequency), smok- ing (none, past, current, pack-years), exercise (time, frequency), and comorbidity (hypertension, hypercholesterolemia, diabe- tes mellitus) was collected through questionnaires. The body mass index (BMI) for each patient was calculated as body weight in kilograms divided by height in meters squared (kg/m2).
Laboratory examination including aspartate aminotransfer- ase (AST), ALT, TB, triglyceride (TG), fasting plasma glucose, and hemoglobin A1c (HbA1C) was performed after an 8 hr over- night fast.
Diagnosis of diabetes mellitus
Diagnosis of diabetes mellitus was made if this condition was previously diagnosed by a physician or if the fasting plasma glu- cose level was greater than or equal to 126 mg/dL or HbA1C was greater than or equal to 6.5% on at least 2 occasions according to the 2011 American Diabetes Association (ADA) criteria (19).
LSM and CAP assessed by transient elastography
Transient elastography was performed on the right lobe of the liver through intercostal spaces on patients lying in the decubi- tus position with the right arm in abduction. The success rate was calculated as the number of successful measurements di- vided by total number of acquisitions. The median value of the successful LSM was expressed in kilopascal (kPa), whereas the median value of the successful CAP score was expressed in deci- bel per meter (db/m). Only LSM and CAP score data, acquired
from at least ten successful measurements, success rate of 100%, and IQR/median for both LSM and CAP score of less than 0.3, were considered reliable. LSM and CAP score were assessed by a professionally trained operator.
As previously published, the LSM was graded according to Metavir fibrosis staging by using the following cutoffs: For CHB and CHC, < 8 kPa for no or mild fibrosis (F0/1), 8-14 kPa for significant fibrosis (F2/3), and > 14 kPa for cirrhosis (F4). For ALD and NAFLD, < 8 kPa for no or mild fibrosis (F0/1), 8-19 kPa for significant fibrosis (F2/3), and > 19 kPa for cirrhosis (F4) (3, 18, 20-24). The CAP score was scored according to ste- atosis grade by using the following cutoffs: < 239 db/m for no steatosis (S0), 239-258 db/m for mild steatosis (S1), 259-292 db/
m for moderate steatosis (S2), and > 292 db/m for severe ste- atosis (S3) (15).
Statistical analysis
Continuous variables were expressed as means ± SD. Compari- sons between groups were made using the chi-square or Fish- er’s exact test for categorical variables and Student’s t-test or the Mann-Whitney U-test for continuous variables. We used logis- tic regression analyses to evaluate the predictive variables asso- ciated with the prevalence of diabetes, such as age, gender, BMI, hypertension, hypercholesterolemia, smoking, alcohol con- sumption, exercise, etiology of liver disease, LSM, CAP score, AST, ALT, and TG; and to determine the odds ratios (OR) for risk factors. Non-parametric Spearman test was used for determin- ing statistical correlations between LSM and CAP score. All anal- yses were performed using SPSS software (version 21.0 for Win- dows; SPSS, Chicago, IL, USA).
Ethics statement
The study protocol was approved by the institutional review board of Samsung Medical Center, Seoul, Korea (IRB No. 2013- 07-104). Informed consent was waived by the board.
RESULTS
Patient characteristics
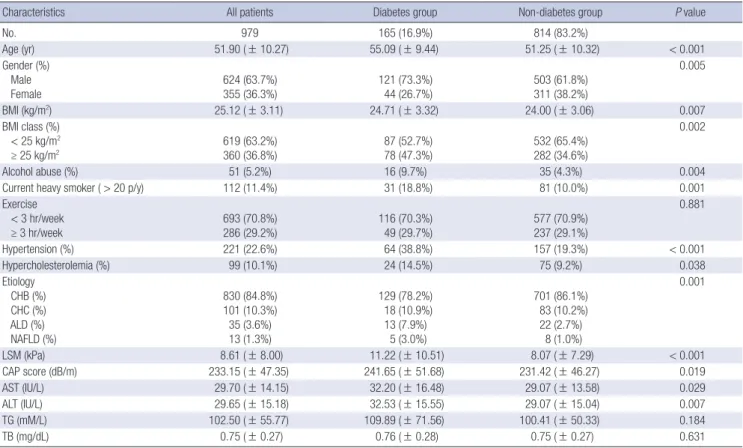
The clinical and laboratory data of the patients are summarized in Table 1. Diabetes was diagnosed in 165 (16.9%) of 979 patients.
Regarding the etiology of liver disease, 830 (84.8%) patients had CHB, 101 (10.3%) patients had CHC, 35 (3.6%) patients had ALD, and 13 (1.3%) patients had NAFLD. The mean LSM was 8.61 ± 8.00 kPa, and the mean CAP score was 233.15 ± 47.35 dB/m.
Also, the clinical and laboratory data classified according to the diabetes group and the non-diabetes group were shown in Table 1. Most of the characteristics except for exercise, TG, and TB were significantly different between the diabetes group and the non-diabetes group. Regarding the etiology of chronic liver disease, there was a significant difference between the diabetes
and the non-diabetes groups (P = 0.001). The mean LSM in the diabetes group (11.22 ± 10.51 kPa) was significantly higher com- pared to that in the non-diabetes group (8.07 ± 7.29 kPa) (P <
0.001). Furthermore, the mean CAP score in the diabetes group (241.65 ± 51.68 dB/m) was significantly higher compared to that in the non-diabetes group (231.42 ± 46.27 dB/m) (P = 0.019).
Comparison of prevalence of diabetes according to the etiologies of liver disease
Regarding the etiology of chronic liver disease, patients with ALD and NAFLD showed a significantly higher prevalence of diabetes than those with CHB (OR, 3.21; P = 0.001, OR, 3.40;
P = 0.034). Patients with CHC did not show a significant differ- ence in the prevalence of diabetes compared with those with CHB (OR, 1.18; P = 0.553).
Comparison of prevalence of diabetes according to LSM and CAP score
As shown in Fig. 1, the prevalence of diabetes was significantly different among the degrees of LSM or CAP score (F0/1 [14%], F2/3 [18%], F4 [31%], P < 0.001; S0/1 [15%], S2 [17%], S3 [26%], P = 0.021). The prevalence of diabetes in F4 group was signifi- cantly higher than that in F0/1 group or F2/3 group (OR, 2.70;
P < 0.001, OR, 2.02; P = 0.011). The prevalence of diabetes in
F2/3 group was higher than that in F0/1 group but there was no significant difference between them (OR, 1.34; P = 0.191). Re- garding steatosis, represented by the CAP score, the prevalence of diabetes in S3 group was significantly higher than that in S0/1 group (OR, 1.91; P = 0.006). The prevalence of diabetes in S3 group was higher than that in S2 group with borderline P value (OR, 1.77; P = 0.054). However there was no significant differ- ence between the prevalence of diabetes in S2 group and S0/1 group (OR, 1.08; P = 0.740).
A significant correlation was observed between LSM and CAP score in the total patients (r = 0.079, P = 0.013). In patients without diabetes, there was a mild but a significant correlation between LSM and CAP score (r = 0.106, P = 0.002), whereas in those with diabetes, there was no significant correlation between LSM and CAP score (r = -0.125, P = 0.109).
Predictive risk factors of diabetes
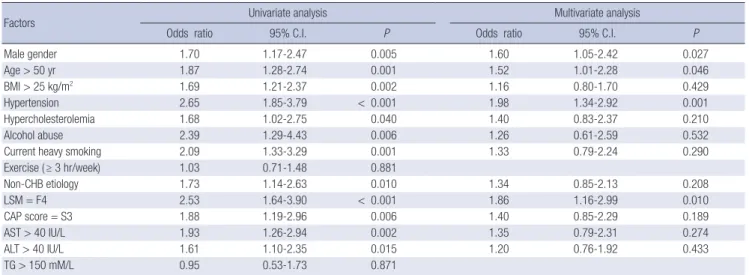
Table 2 shows the significant predictive variables associated with the prevalence of diabetes in univariate analysis including hypertension (OR, 2.65; P < 0.001), LSM F4 (OR, 2.53; P < 0.001), alcohol abuse (OR, 2.39; P = 0.006), current heavy smoking (OR, 2.09; P = 0.001), AST > 40 U/L (OR, 1.93; P = 0.002), CAP score S3 (OR, 1.88; P = 0.006), age > 50 yr (OR, 1.87; P = 0.001), non- CHB etiology (OR, 1.73; P = 0.010), male gender (OR, 1.70; P = Table 1. Baseline characteristics of patients
Characteristics All patients Diabetes group Non-diabetes group P value
No. 979 165 (16.9%) 814 (83.2%)
Age (yr) 51.90 ( ± 10.27) 55.09 ( ± 9.44) 51.25 ( ± 10.32) < 0.001
Gender (%) Male
Female 624 (63.7%)
355 (36.3%) 121 (73.3%)
44 (26.7%) 503 (61.8%)
311 (38.2%)
0.005
BMI (kg/m2) 25.12 ( ± 3.11) 24.71 ( ± 3.32) 24.00 ( ± 3.06) 0.007
BMI class (%) < 25 kg/m2
≥ 25 kg/m2 619 (63.2%)
360 (36.8%) 87 (52.7%)
78 (47.3%) 532 (65.4%)
282 (34.6%)
0.002
Alcohol abuse (%) 51 (5.2%) 16 (9.7%) 35 (4.3%) 0.004
Current heavy smoker ( > 20 p/y) 112 (11.4%) 31 (18.8%) 81 (10.0%) 0.001
Exercise < 3 hr/week
≥ 3 hr/week 693 (70.8%)
286 (29.2%) 116 (70.3%)
49 (29.7%) 577 (70.9%)
237 (29.1%)
0.881
Hypertension (%) 221 (22.6%) 64 (38.8%) 157 (19.3%) < 0.001
Hypercholesterolemia (%) 99 (10.1%) 24 (14.5%) 75 (9.2%) 0.038
Etiology CHB (%) CHC (%) ALD (%) NAFLD (%)
830 (84.8%) 101 (10.3%) 35 (3.6%) 13 (1.3%)
129 (78.2%) 18 (10.9%) 13 (7.9%)
5 (3.0%)
701 (86.1%) 83 (10.2%) 22 (2.7%)
8 (1.0%)
0.001
LSM (kPa) 8.61 ( ± 8.00) 11.22 ( ± 10.51) 8.07 ( ± 7.29) < 0.001
CAP score (dB/m) 233.15 ( ± 47.35) 241.65 ( ± 51.68) 231.42 ( ± 46.27) 0.019
AST (IU/L) 29.70 ( ± 14.15) 32.20 ( ± 16.48) 29.07 ( ± 13.58) 0.029
ALT (IU/L) 29.65 ( ± 15.18) 32.53 ( ± 15.55) 29.07 ( ± 15.04) 0.007
TG (mM/L) 102.50 ( ± 55.77) 109.89 ( ± 71.56) 100.41 ( ± 50.33) 0.184
TB (mg/dL) 0.75 ( ± 0.27) 0.76 ( ± 0.28) 0.75 ( ± 0.27) 0.631
Results are expressed as mean ± SE. BMI, body mass index; p/y, pack/year; CHB, chronic hepatitis B; CHC, chronic hepatitis C; ALD, alcoholic liver disease; NAFLD, non-alco- holic fatty liver disease; LSM, liver stiffness measurement; kPa, kilopascal; CAP, controlled attenuation parameter; dB/m, decibel/meter; AST, aspartate aminotransferase; ALT, alanine aminotransferase; TG, triglyceride; TB, total bilirubin.
0.005), BMI > 25 kg/m2 (OR, 1.69; P = 0.002), hypercholesterol- emia (OR, 1.68; P = 0.040), and ALT > 40 U/L (OR, 1.67; P = 0.015).
Multivariate analysis showed that the significant independent predictors of diabetes were hypertension (OR, 1.98; P = 0.001), LSM F4 (OR, 1.86; P = 0.010), male gender (OR, 1.60; P = 0.027), and age > 50 yr (OR, 1.52; P = 0.046) (Table 2).
Subgroup analysis in patients with CHB
In the subgroup analysis with CHB, the prevalence of diabetes also showed significant difference among the groups of LSM or CAP score (F0/1 [12.7%], F2/3 [15.4%], F4 [33.7%], P < 0.001;
S0/1 [14.4%], S2 [13.2%], S3 [25.8%], P = 0.012) (Fig. 2). The prev- alence of diabetes in F4 group was significantly higher than that Fig. 1. The prevalence of diabetes according to the LSM and CAP score in patients with chronic liver disease. (A) The prevalence of diabetes according to the degree of liver fi- brosis, measured by LSM in patients with chronic liver disease (F0/1 [14%], F2/3 [18%], F4 [31%], P < 0.001). (B) The prevalence of diabetes according to the degree of liver steatosis, measured by CAP score in patients with chronic liver disease (S1 [15%], S2 [17%], S3 [26%], P = 0.021). LSM, liver stiffness measurement; CAP, controlled attenu- ation parameter.
Prevalence of diabetes (%)
F0/1 F2/3 F4
40 30 20 10
0 Prevalence of diabetes (%)
S0/1 S2 S3
40 30 20 10
A 0 B
Table 2. Predictive risk factors for diabetes
Factors Univariate analysis Multivariate analysis
Odds ratio 95% C.I. P Odds ratio 95% C.I. P
Male gender 1.70 1.17-2.47 0.005 1.60 1.05-2.42 0.027
Age > 50 yr 1.87 1.28-2.74 0.001 1.52 1.01-2.28 0.046
BMI > 25 kg/m2 1.69 1.21-2.37 0.002 1.16 0.80-1.70 0.429
Hypertension 2.65 1.85-3.79 < 0.001 1.98 1.34-2.92 0.001
Hypercholesterolemia 1.68 1.02-2.75 0.040 1.40 0.83-2.37 0.210
Alcohol abuse 2.39 1.29-4.43 0.006 1.26 0.61-2.59 0.532
Current heavy smoking 2.09 1.33-3.29 0.001 1.33 0.79-2.24 0.290
Exercise ( ≥ 3 hr/week) 1.03 0.71-1.48 0.881
Non-CHB etiology 1.73 1.14-2.63 0.010 1.34 0.85-2.13 0.208
LSM = F4 2.53 1.64-3.90 < 0.001 1.86 1.16-2.99 0.010
CAP score = S3 1.88 1.19-2.96 0.006 1.40 0.85-2.29 0.189
AST > 40 IU/L 1.93 1.26-2.94 0.002 1.35 0.79-2.31 0.274
ALT > 40 IU/L 1.61 1.10-2.35 0.015 1.20 0.76-1.92 0.433
TG > 150 mM/L 0.95 0.53-1.73 0.871
CI, confidence interval; BMI, body mass index; CHB, chronic hepatitis B; CHC, chronic hepatitis C; ALD, alcoholic liver disease; NAFLD, non-alcoholic fatty liver disease; LSM, liver stiffness measurement; CAP, controlled attenuation parameter; AST, aspartate aminotransferase; ALT, alanine aminotransferase; TG, triglyceride; TB, total bilirubin.
Fig. 2. The prevalence of diabetes according to the LSM and CAP score in patients with chronic hepatitis B. (A) The prevalence of diabetes according to the degree of liver fi- brosis, measured by LSM in patients with chronic hepatitis B (F0/1 [13%], F2/3 [15%], F4 [34%], P < 0.001). (B) The prevalence of diabetes according to the degree of liver steatosis, measured by CAP score in patients with chronic hepatitis B (S0/1 [14%], S2 [13%], S3 [26%], P = 0.012). LSM, liver stiffness measurement; CAP, controlled attenu- ation parameter.
Prevalence of diabetes (%)
F0/1 F2/3 F4
40 30 20 10
0 Prevalence of diabetes (%)
S0/1 S2 S3
40 30 20 10
A 0 B
in F0/1 group and F2/3 group (OR, 3.48; P < 0.001, OR, 2.79;
P = 0.001). The prevalence of diabetes in F2/3 group was higher than that in F0/1 group but there was no significant difference between them (OR, 1.25; P = 0.386). Regarding steatosis, repre- sented by the CAP score, the prevalence of diabetes in S3 group was significantly higher than that in S0/1 group or S2 group (OR, 2.06; P = 0.005, OR, 2.27; P = 0.016). However there was no sig- nificant difference between the prevalence of diabetes in S2 group and S0/1 group (OR, 0.91; P = 0.731).
The significant independent predictors of diabetes in patients with CHB were LSM F4 (OR, 2.48; P = 0.001), age > 50 yr (OR, 1.83; P = 0.010), hypertension (OR, 1.75; P = 0.014), and male gender (OR, 1.60; P = 0.047) (Table 3).
DISCUSSION
In our study, the patients with chronic liver disease had a high prevalence of diabetes compared with that in the general popu- lation, which is known to be about 9% in Korea (25). Especially, the patients with ALD and NAFLD showed a significantly high- er prevalence of diabetes than those with CHB. Previous stud- ies also showed a high prevalence of diabetes in patients with CHC, ALD, NAFLD (1, 2, 26, 27). However, for the patients with CHB, the results for the prevalence of diabetes have been con- flicting (2, 7, 8). Our data indicate that patients with CHB had a higher prevalence of diabetes than the general population, but it was lower than that in patients with other etiologies of chron- ic liver disease. The prevalence of diabetes in CHC was higher than that in CHB, but there was no significant difference.
Our results demonstrate that the degree of liver fibrosis as- sessed by transient elastography has a significant relationship with the prevalence of diabetes in patients with chronic liver disease. Moreover, these results were similarly observed in pa- tients with CHB. Previous studies in which liver biopsy was per-
formed for assessing the fibrosis stage also showed similar re- sults (28). However, liver biopsy has limitations such as invasive- ness, and hence small-scale studies were reported. On the other hand, our study that is large-scaled and in which a non-invasive method, transient elastography, was used showed that liver fi- brosis has a significant relationship with diabetes.
This study identified the significant independent predictive factors of diabetes such as hypertension, liver cirrhosis, male gender, and old age in patients with chronic liver disease includ- ing CHB. More important predictors were hypertension and liver cirrhosis (LSM F4). These risk factors shown in our study were quite different from the risk factors of diabetes in the gen- eral population such as obesity, low exercise, smoking, alcohol consumption, and family history of diabetes (29). Like our study, previous studies also identified different risk factors of diabetes in patients with chronic liver disease compared with those in the general population; however, these risk factors were differ- ent among studies (28-30).
In our study, univariate analysis showed that severe steatosis is significant risk factor for diabetes. However multivariate anal- ysis did not show significant independent relationship between severe steatosis and diabetes. These findings indicate that liver fibrosis is a more important factor for the development of dia- betes than steatosis in patients with chronic liver disease, espe- cially CHB. Previous study which was conducted in patients with CHC also showed similar results through liver biopsy (28).
Several mechanisms could be suggested: blood shunting due to portal hypertension and secretion of pro-inflammatory cyto- kines (TNF-α, NF-κB) from liver cirrhosis mainly result in dia- betes in chronic liver disease (2, 29, 31). Additionally, our study consisted of a large number of CHB group (84.8%) compared to NAFLD group (1.3%). Previous studies with NAFLD have shown that steatosis is an independent risk factor of diabetes (26, 27).
Considering this, if our study had had a large number of patients Table 3. Predictive risk factors for diabetes in the CHB group
Factors Univariate analysis Multivariate analysis
Odds ratio 95% C.I. P Odds ratio 95% C.I. P
Male gender 1.77 1.15-2.71 0.009 1.60 1.01-2.53 0.047
Age > 50 yr 2.14 1.39-3.29 0.001 1.83 1.16-2.89 0.010
BMI > 25 kg/m2 1.48 1.01-2.17 0.043 1.02 0.67-1.55 0.937
Hypertension 2.32 1.54-3.50 < 0.001 1.75 1.12-2.73 0.014
Hypercholesterolemia 1.31 0.72-2.38 0.375
Alcohol abuse 1.97 0.90-4.31 0.092
Current heavy smoking 2.20 1.31-3.70 0.003 1.49 0.85-2.62 0.168
Exercise ( ≥ 3 hr/week) 1.00 0.66-1.50 0.987
LSM = F4 3.32 2.05-5.37 < 0.001 2.48 1.48-4.14 0.001
CAP score = S3 2.10 1.27-3.46 0.004 1.65 0.96-2.84 0.073
AST > 40 IU/L 1.64 0.98-2.75 0.059
ALT > 40 IU/L 1.65 1.07-2.55 0.025 1.36 0.85-2.18 0.200
TG > 150 mM/L 0.84 0.41-1.74 0.643
CHB, chronic hepatitis B; CI, confidence interval; BMI, body mass index; CHC, chronic hepatitis C; ALD, alcoholic liver disease; NAFLD, non-alcoholic fatty liver disease; LSM, liver stiffness measurement; CAP, controlled attenuation parameter; AST, aspartate aminotransferase; ALT, alanine aminotransferase; TG; TG, triglyceride; TB, total bilirubin.
with NAFLD, steatosis might have been an independent pre- dictive factor of diabetes.
Among the etiology of the chronic liver disease, the propor- tion of CHB was more than 70%, whereas the total proportion of other etiologies was less than 30%. Thus we analyzed data limited to the patients with CHB. The subgroup analysis of pa- tients with CHB showed the similar results as those with chron- ic liver disease.
Our study demonstrates the prevalence of diabetes in a rela- tively larger population with major chronic liver diseases, espe- cially CHB, using a non-invasive transient elastography. Espe- cially the CAP score, assessed by transient elastography, was re- cently found to be a promising measurement of steatosis, alth- ough further studies are needed for the CAP score to be accept- ed as a standard measurement of steatosis. It is noteworthy to apply this method in practice for the first time. Moreover, our study excluded the patients with the factors, which may influ- ence values in transient elastography, such as high level of trans- aminase, TB, and IQR/median (22, 32, 33). Therefore the diag- nostic accuracy of transient elastography was increased. In ad- dition, the data about life style were prospectively collected with accuracy.
However, there were several limitations of this study. First, we did not apply all of the ADA criteria to diagnose diabetes such as post prandial or random glucose levels. Therefore, some of the patients with diabetes might not be included in the diabetes group. Second, there was a lack of pathologic data. Although transient elastography is known to be a relevant method, espe- cially in patients with chronic liver disease, liver biopsy is still regarded as the gold standard for assessment of liver fibrosis.
In conclusion, there is a significant association of diabetes with hypertension, liver cirrhosis (LSM F4), male gender, and old age in patients with chronic liver disease. The degree of liver fibrosis, but not steatosis, assessed by transient elastography has a significant relationship with the prevalence of diabetes in patients with chronic liver disease, especially CHB.
DISCLOSURE
None of the authors of this study has any financial interest or potential conflict with industries or parties.
ORCID
Jem Ma Ahn http://orcid.org/0000-0002-3161-5492 Yong-Han Paik http://orcid.org/0000-0002-3076-2327
REFERENCES
1. Garcia-Compean D, Jaquez-Quintana JO, Gonzalez-Gonzalez JA, Mal- donado-Garza H. Liver cirrhosis and diabetes: risk factors, pathophysi-
ology, clinical implications and management. World J Gastroenterol 2009; 15: 280-8.
2. Hickman IJ, Macdonald GA. Impact of diabetes on the severity of liver disease. Am J Med 2007; 120: 829-34.
3. Abenavoli L, Beaugrand M. Transient elastography in non-alcoholic fat- ty liver disease. Ann Hepatol 2012; 11: 172-8.
4. Mehta SH, Brancati FL, Sulkowski MS, Strathdee SA, Szklo M, Thomas DL. Prevalence of type 2 diabetes mellitus among persons with hepatitis C virus infection in the United States. Ann Intern Med 2000; 133: 592-9.
5. Wei M, Gibbons LW, Mitchell TL, Kampert JB, Blair SN. Alcohol intake and incidence of type 2 diabetes in men. Diabetes Care 2000; 23: 18-22.
6. Knobler H, Schihmanter R, Zifroni A, Fenakel G, Schattner A. Increased risk of type 2 diabetes in noncirrhotic patients with chronic hepatitis C virus infection. Mayo Clin Proc 2000; 75: 355-9.
7. Fraser GM, Harman I, Meller N, Niv Y, Porath A. Diabetes mellitus is as- sociated with chronic hepatitis C but not chronic hepatitis B infection.
Isr J Med Sci 1996; 32: 526-30.
8. Papatheodoridis GV, Chrysanthos N, Savvas S, Sevastianos V, Kafiri G, Petraki K, Manesis EK. Diabetes mellitus in chronic hepatitis B and C:
prevalence and potential association with the extent of liver fibrosis. J Viral Hepat 2006; 13: 303-10.
9. Grant A, Neuberger J. Guidelines on the use of liver biopsy in clinical practice: British Society of Gastroenterology. Gut 1999; 45: IV1-11.
10. Schwenzer NF, Springer F, Schraml C, Stefan N, Machann J, Schick F.
Non-invasive assessment and quantification of liver steatosis by ultra- sound, computed tomography and magnetic resonance. J Hepatol 2009;
51: 433-45.
11. Mehta SR, Thomas EL, Bell JD, Johnston DG, Taylor-Robinson SD. Non- invasive means of measuring hepatic fat content. World J Gastroenterol 2008; 14: 3476-83.
12. Hepburn MJ, Vos JA, Fillman EP, Lawitz EJ. The accuracy of the report of hepatic steatosis on ultrasonography in patients infected with hepatitis C in a clinical setting: a retrospective observational study. BMC Gastro- enterol 2005; 5: 14.
13. Lee SS, Park SH, Kim HJ, Kim SY, Kim MY, Kim DY, Suh DJ, Kim KM, Bae MH, Lee JY, et al. Non-invasive assessment of hepatic steatosis: pro- spective comparison of the accuracy of imaging examinations. J Hepatol 2010; 52: 579-85.
14. Talwalkar JA, Kurtz DM, Schoenleber SJ, West CP, Montori VM. Ultra- sound-based transient elastography for the detection of hepatic fibrosis:
systematic review and meta-analysis. Clin Gastroenterol Hepatol 2007;
5: 1214-20.
15. Sasso M, Miette V, Sandrin L, Beaugrand M. The controlled attenuation parameter (CAP): a novel tool for the non-invasive evaluation of steato- sis using Fibroscan. Clin Res Hepatol Gastroenterol 2012; 36: 13-20.
16. Kumar M, Rastogi A, Singh T, Behari C, Gupta E, Garg H, Kumar R, Bha- tia V, Sarin SK. Controlled attenuation parameter for non-invasive as- sessment of hepatic steatosis: does etiology affect performance? J Gastro- enterol Hepatol 2013; 28: 1194-201.
17. De Lédinghen V, Vergniol J, Capdepont M, Chermak F, Hiriart JB, Cassi- notto C, Merrouche W, Foucher J, Brigitte le B. Controlled attenuation parameter (CAP) for the diagnosis of steatosis: a prospective study of 5323 examinations. J Hepatol 2014; 60: 1026-31.
18. Ziol M, Handra-Luca A, Kettaneh A, Christidis C, Mal F, Kazemi F, de Lédinghen V, Marcellin P, Dhumeaux D, Trinchet JC, et al. Noninvasive
assessment of liver fibrosis by measurement of stiffness in patients with chronic hepatitis C. Hepatology 2005; 41: 48-54.
19. American Diabetes Association. Standards of medical care in diabetes:
2011. Diabetes Care 2011; 34: S11-61.
20. Castéra L, Vergniol J, Foucher J, Le Bail B, Chanteloup E, Haaser M, Dar- riet M, Couzigou P, De Lédinghen V. Prospective comparison of transient elastography, Fibrotest, APRI, and liver biopsy for the assessment of fi- brosis in chronic hepatitis C. Gastroenterology 2005; 128: 343-50.
21. Marcellin P, Ziol M, Bedossa P, Douvin C, Poupon R, de Lédinghen V, Beaugrand M. Non-invasive assessment of liver fibrosis by stiffness mea- surement in patients with chronic hepatitis B. Liver Int 2009; 29: 242-7.
22. Castera L, Forns X, Alberti A. Non-invasive evaluation of liver fibrosis using transient elastography. J Hepatol 2008; 48: 835-47.
23. De Lédinghen V, Vergniol J, Gonzalez C, Foucher J, Maury E, Chemineau L, Villars S, Gin H, Rigalleau V. Screening for liver fibrosis by using Fibro- Scan® and FibroTest in patients with diabetes. Dig Liver Dis 2012; 44:
413-8.
24. Stevenson M, Lloyd-Jones M, Morgan MY, Wong R. Non-invasive diag- nostic assessment tools for the detection of liver fibrosis in patients with suspected alcohol-related liver disease: a systematic review and econom- ic evaluation. Health Technol Assess 2012; 16: 1-174.
25. Choi YJ, Kim HC, Kim HM, Park SW, Kim J, Kim DJ. Prevalence and management of diabetes in Korean adults: Korea National Health and Nutrition Examination Surveys 1998-2005. Diabetes Care 2009; 32: 2016- 20.
26. Bae JC, Rhee EJ, Lee WY, Park SE, Park CY, Oh KW, Park SW, Kim SW.
Combined effect of nonalcoholic fatty liver disease and impaired fasting glucose on the development of type 2 diabetes: a 4-year retrospective lon- gitudinal study. Diabetes Care 2011; 34: 727-9.
27. Sung KC, Kim SH. Interrelationship between fatty liver and insulin resis- tance in the development of type 2 diabetes. J Clin Endocrinol Metab 2011; 96: 1093-7.
28. Petit JM, Bour JB, Galland-Jos C, Minello A, Verges B, Guiguet M, Brun JM, Hillon P. Risk factors for diabetes mellitus and early insulin resistance in chronic hepatitis C. J Hepatol 2001; 35: 279-83.
29. Chehadeh W, Abdella N, Ben-Nakhi A, Al-Arouj M, Al-Nakib W. Risk factors for the development of diabetes mellitus in chronic hepatitis C vi- rus genotype 4 infection. J Gastroenterol Hepatol 2009; 24: 42-8.
30. Holstein A, Hinze S, Thiessen E, Plaschke A, Egberts EH. Clinical impli- cations of hepatogenous diabetes in liver cirrhosis. J Gastroenterol Hepa- tol 2002; 17: 677-81.
31. Picardi A, D’Avola D, Gentilucci UV, Galati G, Fiori E, Spataro S, Afeltra A.
Diabetes in chronic liver disease: from old concepts to new evidence. Di- abetes Metab Res Rev 2006; 22: 274-83.
32. Arena U, Vizzutti F, Corti G, Ambu S, Stasi C, Bresci S, Moscarella S, Boddi V, Petrarca A, Laffi G, et al. Acute viral hepatitis increases liver stiffness values measured by transient elastography. Hepatology 2008;
47: 380-4.
33. Kim SU, Han KH, Park JY, Ahn SH, Chung MJ, Chon CY, Choi EH, Kim do Y. Liver stiffness measurement using FibroScan is influenced by se- rum total bilirubin in acute hepatitis. Liver Int 2009; 29: 810-5.