Lobeglitazone, a Novel Thiazolidinedione, Improves Non-
Alcoholic Fatty Liver Disease in Type 2 Diabetes: Its Efficacy and Predictive Factors Related to Responsiveness
Despite the rapidly increasing prevalence of non-alcoholic fatty liver disease (NAFLD) in type 2 diabetes (T2D), few treatment modalities are currently available. We investigated the hepatic effects of the novel thiazolidinedione (TZDs), lobeglitazone (Duvie) in T2D patients with NAFLD. We recruited drug-naïve or metformin-treated T2D patients with NAFLD to conduct a multicenter, prospective, open-label, exploratory clinical trial.
Transient liver elastography (Fibroscan®; Echosens, Paris, France) with controlled attenuation parameter (CAP) was used to non-invasively quantify hepatic fat contents.
Fifty patients with CAP values above 250 dB/m were treated once daily with 0.5 mg lobeglitazone for 24 weeks. The primary endpoint was a decline in CAP values, and secondary endpoints included changes in components of glycemic, lipid, and liver profiles.
Lobeglitazone-treated patients showed significantly decreased CAP values (313.4 dB/m at baseline vs. 297.8 dB/m at 24 weeks; P = 0.016), regardless of glycemic control.
Lobeglitazone improved HbA1C values (7.41% [57.5 mM/M] vs. 6.56% [48.2 mM/M];
P < 0.001), as well as the lipid and liver profiles of the treated patients. Moreover, multivariable linear regression analysis showed that hepatic fat reduction by lobeglitazone was independently associated with baseline values of CAP, liver stiffness, and liver enzymes, and metformin use. Lobeglitazone treatment reduced intrahepatic fat content, as assessed by transient liver elastography, and improved glycemic, liver, and lipid profiles in T2D patients with NAFLD. Further randomized controlled trials using liver histology as an end point are necessary to evaluate the efficacy of lobeglitazone for NAFLD treatment (Clinical trial No. NCT02285205).
Keywords: Non-Alcoholic Fatty Liver Disease; Thiazolidinedione; Type 2 Diabetes;
Transient Liver Elastography Yong-ho Lee,1* Jae Hyeon Kim,2*
So Ra Kim,1 Heung Yong Jin,3 Eun-Jung Rhee,4 Young Min Cho,5 and Byung-Wan Lee1
1Department of Internal Medicine, Yonsei University College of Medicine, Seoul, Korea; 2Division of Endocrinology and Metabolism, Department of Medicine, Samsung Medical Center, Sungkyunkwan University School of Medicine, Seoul, Korea;
3Division of Endocrinology and Metabolism, Department of Internal Medicine, Research Institute of Clinical Medicine, Chonbuk National University Hospital, Chonbuk National University Medical School, Jeonju, Korea; 4Division of Endocrinology and Metabolism, Department of Internal Medicine, Kangbuk Samsung Hospital, Sungkyunkwan University School of Medicine, Seoul, Korea;
5Division of Endocrinology and Metabolism, Department of Internal Medicine, Seoul National University College of Medicine, Seoul, Korea
* Yong-ho Lee and Jae Hyeon Kim contributed equally to this work.
Received: 25 June 2016 Accepted: 15 September 2016 Address for Correspondence:
Byung-Wan Lee, MD
Department of Internal Medicine, Yonsei University College of Medicine, 50-1, Yonsei-ro, Seodaemun-gu, Seoul 03722, Korea E-mail: [email protected]
Funding: This study was financially supported by Chong Keun Dang, Pharmaceutical Co. The funders had no role in study design, data collection and analysis, decision to publish, or preparation of the manuscript.
https://doi.org/10.3346/jkms.2017.32.1.60 • J Korean Med Sci 2017; 32: 60-69
INTRODUCTION
Obesity is a worldwide epidemic that leads to the development of chronic metabolic disorders, such as type 2 diabetes (T2D), cardiovascular disease, and non-alcoholic fatty liver disease (NALFD) (1-3). NAFLD is a condition where fat, mainly triglyc- erides (TG), accumulates in the hepatocytes of patients who have not consumed excessive amounts of alcohol (4). Estimates of the prevalence of NAFLD range from 6.3% to 33%, depend- ing on the population (5,6), and are expected to rise as obesity rates increase, populations become older, and physical activity levels decrease (4). Moreover, there is an increased prevalence
of NAFLD in T2D patients (7), and its severity may be aggravat- ed by T2D (8,9). However, beyond epidemiology, there are many challenges in the diagnosis and treatment of NAFLD.
As patients with NAFLD are mostly asymptomatic, the gold standard for its diagnosis is based on liver biopsy, which is high- ly invasive and expensive. Alternatively, imaging techniques, such as ultrasound (US), computed tomography, and magnetic resonance imaging, are used for NAFLD diagnosis (10). Among these methods, abdominal US is commonly used due to its rel- atively low expense. However, the major drawbacks of US in- clude its inability to quantify liver fat amounts and its variability due to examiner techniques. Recently, a novel physical index,
called controlled attenuation parameter (CAP), has been devel- oped based on the properties of ultrasonic signals examined by transient liver elastography (Fibroscan®; Echosens, Paris, France).
CAP relies on the concept that fat attenuates US propagation, and it non-invasively quantizes this ultrasonic attenuation at the center frequency of the FibroScan® M probe (3.5 MHz) (11).
Furthermore, a large prospective study has demonstrated the accuracy of CAP in diagnosing NAFLD (12).
Despite the increasing number of patients being diagnosed with NAFLD, there are no optimal therapeutic agents to man- age NAFLD. The American Association for the Study of Liver Diseases (AASLD) and the American Gastroenterological Asso- ciation (AGA) have recommended vitamin E supplementation for NAFLD patients without diabetes, and thiazolidinediones (TZDs) for NAFLD patients with diabetes (5). TZDs are potent peroxisome proliferator-activated receptor gamma agonists that lower blood glucose levels by ameliorating systemic insulin sensitivity and inflammation (13). Recently, a novel TZD called lobeglitazone was developed, and is currently being prescribed for T2D in Korea (14). The efficacy and safety of lobeglitazone in T2D has been well-investigated (15-17). To identify better treatment options for T2D patients with NAFLD, we investigat- ed the effects of lobeglitazone on these patients by analyzing al- terations in their CAP values using transient liver elastography, as well as in their glycemic, lipid, and liver profiles.
MATERIALS AND METHODS Study patients
Participants were considered eligible for the study if they had been diagnosed with T2D and were ≥ 20 years old. Participants also had to be drug-free (or naïve for more than three months) with HbA1C values between 7.0% and 8.5% (53.0 and 69.4 mM/
M) or taking a stable dose of metformin with HbA1C values be- tween 7.0% and 9.0% (53.0 and 74.9 mM/M) at the time of screen- ing. Subjects were excluded if they consumed > 210 g/week of alcohol for males and 140 g/week for females or were positive for hepatitis B or C, type 1 diabetes, or secondary diabetes. Sub- jects with a history of renal dysfunction (serum creatinine ≥ 1.5 mg/dL for males and 1.4 mg/dL for females), heart failure (New York Heart Association [NYHA] class III and IV), uncontrolled heart arrhythmia, or cardio-cerebral events (unstable angina, myocardial infarction, transient ischemic attack, cerebral infarct, or hemorrhage) within the 12-week period prior to screening were excluded. Subjects with a history of corticosteroid treat- ment for at least 14 days within the two-month period prior to screening or those with cancer treatment, including chemo- or radiotherapy within two years, were also excluded. Pregnant women and nursing mothers were excluded. Of the remaining T2D subjects, those with NAFLD, as confirmed by a CAP value
≥ 250 dB/m, were enrolled in this study.
Study design
A 24-week, prospective, single-arm, open-label clinical trial (ELLEGANCE [Efficacy and Safety of the Use of LobEGlitazone in T2D PAtients with Non-alcoholiC Fatty LivEr Disease] trial) was conducted in five tertiary medical centers in the Korea to evaluate the efficacy and safety of using once-daily lobeglitazone (0.5 mg) to treat T2D patients with NAFLD. If a patient’s HbA1C
value exceeded 8.5% at 12 weeks after treatment, rescue medi- cation (2.0 mg glimepiride) was introduced. The primary end- point was change in CAP, as measured by transient elastogra- phy (FibroScan®), from baseline to the end of 24-week lobegli- tazone treatment. The secondary endpoints were changes from baselines in multiple values and parameters, including HbA1c, fasting plasma glucose (FPG), glycated albumin (GA), liver en- zymes (aspartate transaminase [AST], alanine transaminase [ALT], and gamma glutamyl transferase [γGTP]), lipid profile components (low-density lipoprotein cholesterol [LDL-C], high- density lipoprotein cholesterol [HDL-C], total cholesterol [TC], and TG), and high-sensitivity C-reactive protein (hsCRP). In addition, alterations from baseline in the homeostasis model assessment of insulin resistance (HOMAIR), which was quanti- fied based on FPG and fasting insulin levels, were used as sec- ondary endpoints. During the study period, patients visited the clinic for initial screening and baseline measurement, in addi- tion to weeks 12 and 24. During both the initial screening and at 12- and 24-week visits, fasting blood samples for all subjects, as well as urine pregnancy tests for female participants of child- bearing age, were taken for laboratory assessment. At the base- line visit, CAP and liver US were performed. At the 24-week vis- it, CAP was performed again. Before entering the study, we as- sessed the daily dietary and exercise routines of all participants, and then, they were educated and asked to maintain a calorie limited-diet while performing more than 150 min/week of me- dium-intensity aerobic exercise.
Laboratory and imaging studies
We used a hexokinase method to measure FPG levels and an enzymatic colorimetric method to measure TG, TC, LDL-C, and HDL-C levels. Serum levels of liver enzymes and other profiles were measured by standard methods at each hospital. Ion-ex- change high-performance liquid chromatography (Bio-Rad Lab- oratories, Hercules, CA, USA) was used to measure HbA1C lev- els. The serum GA level was measured by an enzymatic meth- od, using Lucica GA-L reagents (Asahi Kasei Pharma Co., To- kyo, Japan) and a Hitachi 7699 P module autoanalyzer (Hitachi Instruments Service, Tokyo, Japan).
We used the right lobe of the liver through intercostal space to obtain CAP values and liver stiffness measurements (LSM), as described previously (18). For the CAP assessment, we used a Fibroscan 501® (Echosens), placing the tip of the M probe on the skin between the ribs, over the right lobe of the liver. To ensure
an accurate CAP value, we only calculated US attenuation when the matched LSM was valid, while attempting to collect ≥ 10 valid LSMs. A success rate of ≥ 60% and a ratio for the interquar- tile range (IQR) to the median value of LSM (IQR/MLSM) of ≤ 30%
were considered reliable and used for the final analysis. CAP val- ues were measured by a trained operator following the manufac- turer’s instruction. The steatosis grade (S) was determined using the following CAP-cutoff values that were previously reported by Sasso et al. (11): 238 dB/m for S ≥ 1, 260 dB/m for S ≥ 2, and 293 dB/m for S = 3. US scanning was performed by professional radiologists. Because US was not performed to investigate the study endpoint and merely used to rule out other liver disorders, the US methods and devices were not standardized.
Safety was assessed at every visit via patient-reported adverse events, physical examination, and regular monitoring of multi- ple parameters, including vital signs and laboratory test results.
Peripheral edema, which was defined as a > 10% increase in ankle circumference from baseline, was also monitored, along with pitting edema.
Statistical analyses
All continuous variables were expressed as the mean ± standard deviation (SD). The AST, ALT, and TG values were log transform- ed, because value distributions were skewed. Student’s t-tests and Pearson’s χ2 tests were used for continuous and categorical variables, respectively, to evaluate any differences according to
lobeglitazone responsiveness. A responder to lobeglitazone was defined as any individual who showed a decrease in CAP after treatment. Changes in clinico-laboratory parameters, including CAP and HbA1C values, after lobeglitazone treatment were eval- uated using a paired t-test. We performed correlation analyses to examine the relationship between changes in CAP values and clinico-laboratory parameters at baseline and after treat- ment. Multivariate linear regression analysis was performed to assess the association between CAP value changes and various clinico-laboratory parameters. The results are expressed as val- ues of standardized (STD) β-coefficients and P values. A two- sided P value < 0.05 was considered significant. All statistical analyses were conducted using SPSS for Windows software (ver- sion 20.0; SPSS Inc., Chicago, IL, USA).
Ethics statement
This study complied with the Declaration of Helsinki, and is reg- istered at clinicaltrials.gov. The registration identification num- ber is NCT02285205. The clinical trial protocol was approved by the Institutional Review Board of each center. All patients in the present study provided their written informed consent.
RESULTS
Baseline characteristics of the study population
Of the 50 enrolled patients, 43 had completed the study by week
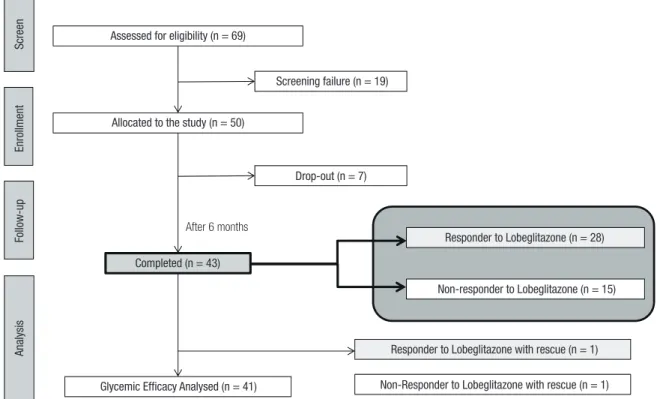
Fig. 1. A flow chart illustrates the disposition of subjects participating in the ELEGANCE study.
ELEGANCE = Efficacy and Safety of the Use of LobEGlitazone in T2D PAtients with Non-alcoholiC Fatty LivEr Disease.
Final analysed study population (n= 816 ) Allocated to HbA1c ≥ 7.5% (n= 716)
Fig. 1
Screen Assessed for eligibility (n = 69)
Screening failure (n = 19)
Allocated to the study (n = 50)
Drop-out (n = 7)
After 6 months
Completed (n = 43)
Glycemic Efficacy Analysed (n = 41) Non-Responder to Lobeglitazone with rescue (n = 1) Responder to Lobeglitazone with rescue (n = 1)
Non-responder to Lobeglitazone (n = 15) Responder to Lobeglitazone (n = 28)
EnrollmentFollow-upAnalysis
24 (Fig. 1). The main reason for drop-out was an outbreak of Mid- dle East Respiratory Syndrome (MERS) that occurred in Korea at the time of clinical trial. Since the drop-out participants feared visiting the hospital, they failed to conform to the study sched- ule. Analysis of baseline characteristics showed that the partici- pants had a mean age of 52 years, body mass index (BMI) of 27.5 kg/m2, and HbA1C of 7.4% (57.4 mM/M) (Table 1). The av- erage levels of HOMAIR, AST, ALT, and γGTP were 5.5 ± 4.1 IU/
L, 31.7 ± 16.1 IU/L, 43.7 ± 28.0 IU/L, and 52.3 ± 40.2 IU/L, re- spectively. The mean CAP value was 313.4 ± 30.9 dB/m, and the mean LSM value was 6.4 ± 2.7 kPa. At baseline visit, about 53%
of the patients were prescribed and, reportedly, taking metformin.
Changes in hepatic steatosis evaluated by CAP after lobeglitazone treatment for 24 weeks
After 24 weeks of treatment with lobeglitazone, the mean CAP value significantly decreased by 5.0%, from 313.4 ± 30.9 dB/m to 297.8 ± 39.1 dB/m (P = 0.016); the mean HbA1C value was re- duced by 11.1%, from 7.4% ± 0.4% (57.9 ± 4.9 mM/M) to 6.6%
± 0.4% (48.5 ± 4.8 mM/M) (P < 0.001) (Fig. 2A and 2B). Among the 43 participants, 28 (65.1%) showed significant decreases in their CAP values after the 24-week lobeglitazone treatment, com- pared with their CAP values at baseline; therefore, the select 28 were defined as lobeglitazone responders.
To assess whether the improvement in hepatic steatosis was associated with better glycemic control, we examined changes in CAP and HbA1C values in patients according to their lobegli- tazone responsiveness (Fig. 2C and 2D). After the 24-week treat- ment, the mean CAP value in the lobeglitazone-responder group decreased from 320.9 dB/m to 282.6 dB/m, whereas the mean CAP value in the lobeglitazone-non-responder group increased from 299.4 dB/m to 326.0 dB/m. Regarding glycemic control, reductions in HbA1C levels were not significantly different be- tween responders (from 7.4% [57.4 mM/M] to 6.5% [47.5 mM/
M]) and non-responders (from 7.4% [57.4 mM/M] to 6.8% [50.8 mM/M]) (P = 0.151). These data indicate that the improvement in hepatic steatosis by lobeglitazone is independent of its glu- cose-lowering effect.
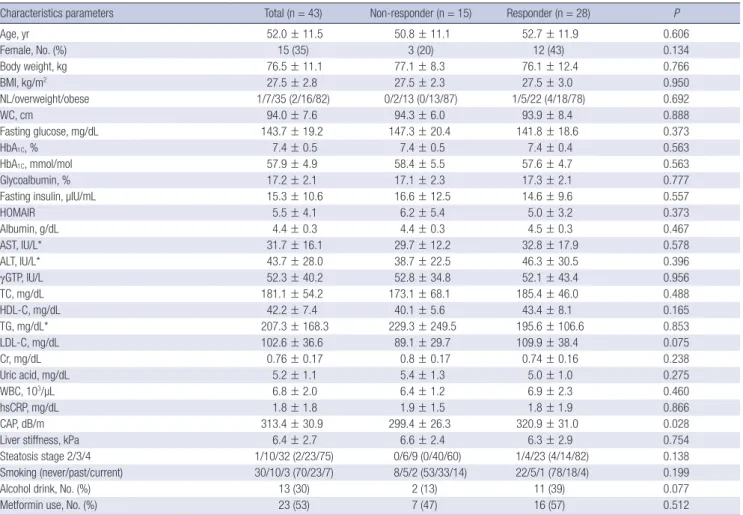
Table 1. Characteristics of study population according to patient responsiveness to lobeglitazone
Characteristics parameters Total (n = 43) Non-responder (n = 15) Responder (n = 28) P
Age, yr 52.0 ± 11.5 50.8 ± 11.1 52.7 ± 11.9 0.606
Female, No. (%) 15 (35) 3 (20) 12 (43) 0.134
Body weight, kg 76.5 ± 11.1 77.1 ± 8.3 76.1 ± 12.4 0.766
BMI, kg/m2 27.5 ± 2.8 27.5 ± 2.3 27.5 ± 3.0 0.950
NL/overweight/obese 1/7/35 (2/16/82) 0/2/13 (0/13/87) 1/5/22 (4/18/78) 0.692
WC, cm 94.0 ± 7.6 94.3 ± 6.0 93.9 ± 8.4 0.888
Fasting glucose, mg/dL 143.7 ± 19.2 147.3 ± 20.4 141.8 ± 18.6 0.373
HbA1C, % 7.4 ± 0.5 7.4 ± 0.5 7.4 ± 0.4 0.563
HbA1C, mmol/mol 57.9 ± 4.9 58.4 ± 5.5 57.6 ± 4.7 0.563
Glycoalbumin, % 17.2 ± 2.1 17.1 ± 2.3 17.3 ± 2.1 0.777
Fasting insulin, µIU/mL 15.3 ± 10.6 16.6 ± 12.5 14.6 ± 9.6 0.557
HOMAIR 5.5 ± 4.1 6.2 ± 5.4 5.0 ± 3.2 0.373
Albumin, g/dL 4.4 ± 0.3 4.4 ± 0.3 4.5 ± 0.3 0.467
AST, IU/L* 31.7 ± 16.1 29.7 ± 12.2 32.8 ± 17.9 0.578
ALT, IU/L* 43.7 ± 28.0 38.7 ± 22.5 46.3 ± 30.5 0.396
γGTP, IU/L 52.3 ± 40.2 52.8 ± 34.8 52.1 ± 43.4 0.956
TC, mg/dL 181.1 ± 54.2 173.1 ± 68.1 185.4 ± 46.0 0.488
HDL-C, mg/dL 42.2 ± 7.4 40.1 ± 5.6 43.4 ± 8.1 0.165
TG, mg/dL* 207.3 ± 168.3 229.3 ± 249.5 195.6 ± 106.6 0.853
LDL-C, mg/dL 102.6 ± 36.6 89.1 ± 29.7 109.9 ± 38.4 0.075
Cr, mg/dL 0.76 ± 0.17 0.8 ± 0.17 0.74 ± 0.16 0.238
Uric acid, mg/dL 5.2 ± 1.1 5.4 ± 1.3 5.0 ± 1.0 0.275
WBC, 103/µL 6.8 ± 2.0 6.4 ± 1.2 6.9 ± 2.3 0.460
hsCRP, mg/dL 1.8 ± 1.8 1.9 ± 1.5 1.8 ± 1.9 0.866
CAP, dB/m 313.4 ± 30.9 299.4 ± 26.3 320.9 ± 31.0 0.028
Liver stiffness, kPa 6.4 ± 2.7 6.6 ± 2.4 6.3 ± 2.9 0.754
Steatosis stage 2/3/4 1/10/32 (2/23/75) 0/6/9 (0/40/60) 1/4/23 (4/14/82) 0.138
Smoking (never/past/current) 30/10/3 (70/23/7) 8/5/2 (53/33/14) 22/5/1 (78/18/4) 0.199
Alcohol drink, No. (%) 13 (30) 2 (13) 11 (39) 0.077
Metformin use, No. (%) 23 (53) 7 (47) 16 (57) 0.512
BMI = body mass index, NL = normal, WC = waist circumference, HOMAIR = homeostasis model assessment of insulin resistance, AST = aspartate transaminase, ALT = alanine transaminase, γGTP = gamma glutamyl transferase, TC = total cholesterol, HDL-C = high-density lipoprotein cholesterol, TG = triglycerides, LDL-C = low-density lipoprotein cholesterol, WBC = white blood cell, hsCRP = high sensitivity C-reactive protein, CAP = controlled attenuation parameter.
*log transformed.
Changes in glycemic, lipid, and hepatic profiles after lobeglitazone treatment for 24 weeks
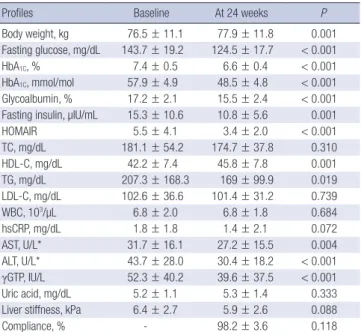
Among secondary endpoints, the 24-week treatment with lobe- glitazone significantly improved glycemic parameters, such as GA and the fasting levels of glucose and insulin (P < 0.001) (Ta- ble 2). Insulin resistance, as assessed by HOMAIR, was amelio- rated from 5.5 to 3.4 by lobeglitazone treatment. Among lipid profile components, lobeglitazone treatment significantly in- creased HDL-C (P = 0.001) and decreased TG levels (P = 0.019).
However, TC and LDL-C levels did not change. All components of the hepatic profile, including AST, ALT, and γGTP, showed sig- nificantly decreased levels after 24 weeks of treatment (P < 0.01).
In addition, LSM and hsCRPs values were marginally decreas- ed, whereas average body weight increased by 1.4 kg after lobe- glitazone treatment. At the 24-week time point, drug compliance was 98.2%.
Clinical and biochemical parameters associated with changes in hepatic steatosis
To investigate whether any clinical and biochemical parame- ters were associated with lobeglitazone responsiveness, base- line characteristics of the study population were stratified by re- sponsiveness (Table 1), followed by two-step correlation and linear regression analyses with three statistical models of inde-
Fig. 2. Changes in CAP (A) and HbA1C (B) values following lobeglitazone treatment for 24 weeks and changes in CAP (C) and HbA1C (D) values according to patient responsive- ness to lobeglitazone, as assessed by CAP, are shown. Values are presented as mean ± standard deviation (SD).
CAP = controlled attenuation parameter, wk = week.
CAP (dB/m)
0 wk 24 wk
350 330 310 290 270 250
P=0.016
313.4
297.8
HbA1C (%)
0 wk 24 wk
8.0 7.6 7.2 6.8 6.4 6.0
P<0.001
7.41
6.56
Changes in CAP (dB/m)
Total Responder
(n = 28) Non-responder (n = 15) 40
30 20 10 0
−10
−20
−30
−40
−50
P<0.001
Changes in HbA1C (%)
Total
Responder (n = 28)
Non-responder (n = 15) 0
−0.2
−0.4
−0.6
−0.8
−1.0
-1.2 P=0.151
A B
C D
Table 2. Changes in glycemic, lipid, and liver profiles by lobeglitazone treatment for 24 weeks
Profiles Baseline At 24 weeks P
Body weight, kg 76.5 ± 11.1 77.9 ± 11.8 0.001
Fasting glucose, mg/dL 143.7 ± 19.2 124.5 ± 17.7 < 0.001
HbA1C, % 7.4 ± 0.5 6.6 ± 0.4 < 0.001
HbA1C, mmol/mol 57.9 ± 4.9 48.5 ± 4.8 < 0.001 Glycoalbumin, % 17.2 ± 2.1 15.5 ± 2.4 < 0.001 Fasting insulin, µIU/mL 15.3 ± 10.6 10.8 ± 5.6 0.001
HOMAIR 5.5 ± 4.1 3.4 ± 2.0 < 0.001
TC, mg/dL 181.1 ± 54.2 174.7 ± 37.8 0.310
HDL-C, mg/dL 42.2 ± 7.4 45.8 ± 7.8 0.001
TG, mg/dL 207.3 ± 168.3 169 ± 99.9 0.019
LDL-C, mg/dL 102.6 ± 36.6 101.4 ± 31.2 0.739
WBC, 103/µL 6.8 ± 2.0 6.8 ± 1.8 0.684
hsCRP, mg/dL 1.8 ± 1.8 1.4 ± 2.1 0.072
AST, U/L* 31.7 ± 16.1 27.2 ± 15.5 0.004
ALT, U/L* 43.7 ± 28.0 30.4 ± 18.2 < 0.001
γGTP, IU/L 52.3 ± 40.2 39.6 ± 37.5 < 0.001
Uric acid, mg/dL 5.2 ± 1.1 5.3 ± 1.4 0.333
Liver stiffness, kPa 6.4 ± 2.7 5.9 ± 2.6 0.088
Compliance, % - 98.2 ± 3.6 0.118
HOMAIR = homeostasis model assessment of insulin resistance, TC = total choles- terol, HDL-C = high-density lipoprotein cholesterol, TG = triglycerides, LDL-C = low- density lipoprotein cholesterol, WBC = white blood cell, hsCRP = high-sensitivity C- reactive protein, AST = aspartate transaminase, ALT = alanine transaminase, γGTP = gamma glutamyl transferase.
*log transformed.
pendent variables (Tables 3 and 4). These analyses showed that the baseline CAP values were higher in patients who responded to lobeglitazone (320.9 ± 31.0 dB/m) than those who failed to respond (299.4 ± 26.3 dB/m) (P = 0.028). Other parameters did not show any association with lobeglitazone responsiveness.
The first-step correlation analyses between changes in CAP values and various baseline parameters also demonstrated that patients with higher CAP values tended to have larger CAP dec- rements after lobeglitazone treatment (r = −0.434, P = 0.004).
Moreover, uric acid levels were positively correlated with chan- ges in CAP values (r = 0.386, P = 0.011). The second-step corre- lation analyses further showed that changes in body weight, as well as AST and ALT levels were significantly correlated with changes in CAP values (P < 0.05). These correlations indicate that people with less of an increase in body weight, or AST and ALT levels, after 24 weeks were also likely to show improvements in hepatic steatosis by lobeglitazone treatment.
For multivariate linear regression analyses, a change in CAP value following lobeglitazone treatment was used as a depen- dent factor, and the baseline variables were adjusted (Model 1).
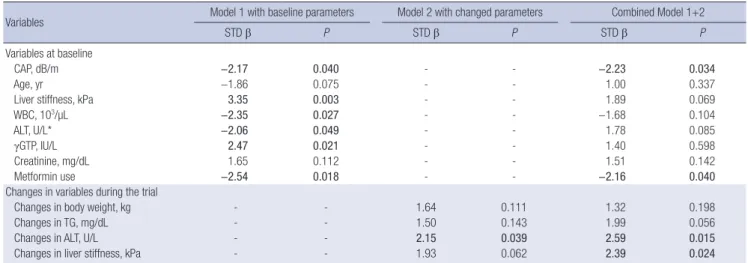
Changes in CAP values were independently associated with base- line CAP and LSM values, white blood cell (WBC) counts, ALT, and γGTP levels, and the use of metformin. Using such analy- ses, we would expect CAP decrements after lobeglitazone treat- ment in subjects with higher baseline levels of CAP, WBC, and ALT, as well as metformin users; on the other hand, we would expect non-responsiveness to lobeglitazone in those who have higher baseline LSM values and γGTP levels. Model 2, which included changes in clinico-laboratory parameters, showed that CAP value changes were only independently associated with alterations in ALT levels after 24 weeks of treatment (STD β = 2.15;
P = 0.039). A combined model revealed that CAP values at base- line (STD β = −2.23), the use of metformin (STD β = −2.16), and alterations in ALT levels (STD β = 2.59) and LSM values (STD β = 2.39) were all significant determinants in the changes in CAP values (P < 0.05).
DISCUSSION
There is accumulating evidence regarding the serious compli- cations and mortality of NAFLD and its large burden on public healthcare systems (19). However, optimal strategies for the pre- vention and treatment of NAFLD, particularly in the context of glucose metabolism, have not yet been fully investigated. Guide- lines put forth by the AGA and the AASLD have recommended that TZD pioglitazone be used to treat patients with biopsy-prov- en, non-alcoholic steatohepatitis (NASH) (5,20). Therefore, we hypothesized that lobeglitazone, a novel TZD, could alleviate hepatic steatosis and improve hepatic function in T2D patients with CAP-proven NAFLD. In this multicenter, prospective, and exploratory trial, transient liver elastography assessed that a 24- week treatment with lobeglitazone had significantly ameliorat- ed hepatic steatosis in T2D patients with NAFLD, independent of glycemic control. Lobeglitazone treatment also resulted in improved glycemic profiles with reduced HbA1C and HOMAIR values, lipid profiles with increased HDL-C and decreased TG levels, and liver profiles with decreased AST, ALT, and γGTP lev- els. Multiple linear regression analyses further demonstrated that hepatic fat reduction by lobeglitazone was independently associated with baseline CAP values, metformin use, and chang- Table 3. Correlation analyses between changes in CAP values and clinico-laboratory
parameters
Parameters Changes in CAP
r P
Variables at baseline
Age, yr −0.143 0.360
BMI, kg/m2 −0.135 0.388
Body weight, kg 0.067 0.668
WC, cm −0.032 0.842
Fasting glucose, mg/dL 0.065 0.680
HbA1C, % 0.011 0.943
Glycoalbumin, % −0.058 0.723
HOMAIR 0.131 0.402
Fasting insulin, µIU/mL 0.075 0.634
TC, mg/dL −0.111 0.480
HDL-C, mg/dL −0.163 0.296
TG, mg/dL* 0.044 0.779
WBC, 103/µL −0.148 0.342
hsCRP, mg/dL −0.129 0.415
Creatinine, mg/dL 0.219 0.158
AST, U/L* −0.090 0.567
ALT, U/L* −0.012 0.938
γGTP, IU/L 0.119 0.448
Albumin, g/dL 0.153 0.327
Uric acid, mg/dL 0.386 0.011
CAP, dB/m −0.434 0.004
Liver stiffness, kPa 0.080 0.610
Changes in variables during the trial
Body weight, kg 0.328 0.032
Fasting glucose, mg/dL 0.122 0.435
HbA1C, % 0.125 0.424
Glycoalbumin, % 0.002 0.989
HOMAIR −0.038 0.808
Fasting insulin, µIU/mL 0.019 0.903
TC, mg/dL −0.006 0.967
HDL-C, mg/dL 0.171 0.273
TG, mg/dL* 0.084 0.594
WBC, 103/µL 0.121 0.441
hsCRP, mg/dL −0.155 0.334
AST, U/L* 0.329 0.031
ALT, U/L* 0.318 0.037
γGTP, IU/L 0.280 0.069
Uric acid, mg/dL −0.010 0.947
Liver stiffness, kPa 0.186 0.231
CAP = controlled attenuation parameter, BMI = body mass index, WC = waist circum- ference, HOMAIR = homeostasis model assessment of insulin resistance, TC = total cholesterol, HDL-C = high-density lipoprotein cholesterol, TG = triglycerides, WBC = white blood cell, hsCRP = high-sensitivity C-reactive protein, AST = aspartate trans- aminase, ALT = alanine transaminase, γGTP = gamma glutamyl transferase.
*log transformed.
es in LSM and ALT levels.
Several clinical studies have investigated the effects of anti- diabetic TZDs on NAFLD (21-25). Ratziu et al. (22) reported that rosiglitazone ameliorates hepatic steatosis and aminotransfer- ases, but not necroinflammation or fibrosis. A randomized clini- cal trial (RCT) conducted with 55 NASH patients who had im- paired glucose tolerance or T2D, showed that pioglitazone treat- ment improves liver enzyme profiles and NASH histology, but not fibrosis (23). Moreover, the trial also found that 73% of the pioglitazone-treated, compared with 24% of the placebo-treat- ed, NASH patients showed improvement. Another RCT, conduct- ed with 61 non-diabetic NASH patients, showed that a 12-month treatment with pioglitazone does not improve steatosis, but ame- liorates hepatocellular injury and fibrosis, compared with pla- cebo treatment on NASH patients (25). However, the Pioglitazone versus Vitamin E versus Placebo for the Treatment of Nondia- betic Patients with Nonalcoholic Steatohepatitis (PIVENS) trial, which is a multicenter RCT of 247 non-diabetic patients with NASH, showed that 69% of pioglitazone-treated patients, com- pared with 31% of placebo-treated patients, achieved improve- ments in hepatosteatosis, as assessed by histology (P < 0.001) (24).
In this study, we showed that 65% of NAFLD patients respond- ed to lobeglitazone treatment, which is comparable to the 69%
improvement in steatosis by pioglitazone treatment that was observed in PIVENS trial. Interestingly, a recent RCT meta-anal- ysis showed that TZDs improve hepatic steatosis and inflam- mation, but not fibrosis (26). Similarly, in this study, we dem- onstrated that lobeglitazone treatment in NAFLD patients im- proved hepatic steatosis, as assessed by CAP, and liver enzyme
profiles, as assessed by aminotransferase and γGTP levels, but not liver fibrosis, based on measurements of liver stiffness. Be- cause this was not a liver-biopsy proven study, we could not as- sess alterations in hepatic inflammation and hepatocellular bal- looning following treatment. Regarding CAP, previous studies have analyzed the association of CAP values with liver histolo- gy, particularly in NAFLD patients with high-grade steatosis and elevated BMI, and have verified the utility of CAP as a non-in- vasive tool for diagnosing and monitoring NAFLD patients (27- 30). However, despite its relatively high accuracy in detecting hepatic steatosis, the agreement between histologic analysis and CAP in hepatic fat quantification varies among individuals with mild steatosis (27). Thus, for our study, we recruited T2D sub- jects with NAFLD using a higher cut-off CAP value (250 dB/m).
A previous study had suggested that better glycemic control affects improvement in fatty liver in T2D patients in response to drug treatment (31). Thus, it could be argued that improvement of glycemic control alone might be responsible for reduced he- patic steatosis. To address this concern, we, in our current study, classified patients into two groups according to their lobeglita- zone responsiveness. During the 24-week trial, two subjects, one in the responder group and the other in the non-responder group, received 2.0 mg glimepiride for rescue therapy. With the excep- tion of these two subjects, participants showed improved glyce- mic control, as assessed by HbA1C and GA levels. Interestingly, although CAP values were only significantly reduced in the re- sponder group, HbA1C values were significantly reduced in both the responder and non-responder groups. These data suggest that the reduction in hepatosteatosis is independent of the de- gree of glycemic control.
Table 4. Multiple linear regression models for factors associated with changes in hepatic steatosis, as assessed by CAP
Variables Model 1 with baseline parameters Model 2 with changed parameters Combined Model 1+2
STD β P STD β P STD β P
Variables at baseline
CAP, dB/m −2.17 0.040 - - −2.23 0.034
Age, yr −1.86 0.075 - - 1.00 0.337
Liver stiffness, kPa 3.35 0.003 - - 1.89 0.069
WBC, 103/µL −2.35 0.027 - - −1.68 0.104
ALT, U/L* −2.06 0.049 - - 1.78 0.085
γGTP, IU/L 2.47 0.021 - - 1.40 0.598
Creatinine, mg/dL 1.65 0.112 - - 1.51 0.142
Metformin use −2.54 0.018 - - −2.16 0.040
Changes in variables during the trial
Changes in body weight, kg - - 1.64 0.111 1.32 0.198
Changes in TG, mg/dL - - 1.50 0.143 1.99 0.056
Changes in ALT, U/L - - 2.15 0.039 2.59 0.015
Changes in liver stiffness, kPa - - 1.93 0.062 2.39 0.024
Model 1: adjusted for age, sex, HbA1c, body weight, BMI, waist circumference, liver stiffness, WBC, AST, ALT, γGTP, creatinine, uric acid, fasting glucose, albumin, TC, HDL-C, TG, hsCRP, Glycoalbumin, HOMAIR, metformin use, and CAP. Model 2: adjusted for age, sex, changes in following variables (HbA1C, body weight, liver stiffness, AST, ALT, γGTP, uric acid, fasting glucose, TG, hsCRP, and HOMAIR). Bold values indicate statistical significance.
BMI = body mass index, STD β = standardized β, CAP = controlled attenuation parameter, WBC = white blood cell, AST = aspartate transaminase, ALT = alanine transami- nase, γGTP = gamma glutamyl transferase, TC = total cholesterol, HDL-C = high-density lipoprotein cholesterol, TG = triglycerides, hsCRP = high-sensitivity C-reactive protein, HOMAIR = homeostasis model assessment of insulin resistance.
*log transformed.
There have been studies that investigate the pharmacologic mechanisms of TZDs in altering fat content and adipocytes (13), and these mechanisms are thought to positively affect the dis- tribution of fat mass and the proliferation of adipocytes result- ing in weight gain (32). Nevertheless, TZDs have also been shown to reduce liver fat content and enhance peripheral tissue glucose uptake (31). In this regard, the negative side effects of TZDs on weight gain should be viewed in a balanced manner. Previous studies have shown that pioglitazone treatment increases body weight between 2.5 and 4.7 kg, depending on the study (23-25).
In our study, lobeglitazone treatment showed a lower increase in the average body weight of 1.4 kg (from 76.5 ± 11.1 kg to 77.9
± 11.8 kg [P = 0.001]), which is similar to the weight gain, rang- ing from 0.89 to 1.48 kg, that was observed in other clinical trials using 0.5 mg/day lobeglitazone (15-17).
In this study, we identified predictive factors that were asso- ciated with lobeglitazone responsiveness, and found that indi- viduals with higher values of CAP, WBC, and ALT, and lower val- ues of LSM and γGTP at baseline showed greater reductions in hepatic fat following lobeglitazone treatment. Although most previous trials with TZDs did not analyze predictors of respon- siveness, a trial with rosiglitazone showed that responders have lower baseline γGTP levels and higher baseline amounts of ste- atosis than non-responders (22), which is consistent with our findings. Similar to previous studies (22,25), we also observed greater reductions in the ALT levels of responders, compared with those observed in non-responders, following treatment.
Previous studies have also shown that responders show greater increments in serum adiponectin levels after TZD treatment than non-responders (22,23). Furthermore, Ratziu et al. (22) re- ported greater reductions in insulin levels in responders to rosi- glitazone than in non-responders, which we did not observe in our trial. Such difference was likely due to the fact that 100% of patients in our study had diabetes, whereas only 32% of the pa- tients in the Ratziu et al. (22) study had diabetes. Moreover, our multiple regression analysis demonstrated that patients treated with metformin and lobeglitazone showed a greater reduction in hepatic steatosis than patients treated with lobeglitazone alone.
Previous RCTs have shown inconsistent effects using metfor- min alone to treat NAFLD (5,33); thus, the combination of met- formin and lobeglitazone may synergistically act to reduce he- patic fat. One plausible explanation could be that they act to- gether on the pathogenic heterogeneities in NAFLD. For exam- ple, lobeglitazone may play a role in decreasing the availability of plasma fatty acids arising from adipose tissue through abated lipolysis and the positive distribution of fat mass; on the other hand, metformin may activate either fatty acid oxidation or li- pophagy, as well as mitophagy, via upregulation of the adenos- ine monophosphate kinase and/or sirtuin 1 pathways (34,35).
In addition, metformin may ameliorate the adverse effects of weight gain caused by TZD treatment.
The present study has some limitations that should be addre- ssed in future studies. Lobeglitazone is a novel TZD; thus, its long-term safety in treating patients with NAFLD has not been established. Moreover, findings from the current study should be taken with some caution in that our clinical trials included a relatively small number of participants, without having any qual- ity control for CAP measurements conducted by the five cen- ters. Additionally, we did not perform liver biopsy, which is the gold standard method, to evaluate the status of NAFLD because it is a highly invasive and costly procedure. Furthermore, our study does not clearly show how lobeglitazone works on NAFLD.
Finally, we performed a single-arm trial without a placebo or an active arm. However, even with these limitations, the current study has several strengths: First, we conducted a study with the novel drug lobeglitazone to assess its additional benefits on NAFLD in T2D patients. Second, to the best of our knowledge, this is the first trial to demonstrate that CAP can be used as a simple, non-invasive tool to quantify and monitor changes in liver fat content during intervention. Finally, we identified sev- eral parameters that may be used to predict NAFLD-patient re- sponse to lobeglitazone treatment.
In conclusion, we investigated the effects of the anti-diabetic drug lobeglitazone on T2D patients with NAFLD, using transient liver elastography with CAP and gluco-metabolic profile analy- sis, and found that the method was effective not only in lower- ing glucose levels but also in reducing intrahepatic fat content.
Furthermore, increased steatosis grade and metformin use in patients at baseline, as well as decreased ALT and LSM levels after treatment, were all reliable factors in predicting respon- siveness to lobeglitazone. Together, our data indicate that lobe- glitazone is a valid, novel therapeutic that should be used to treat NAFLD patients with T2D.
ACKNOWLEDGMENT
We thank Sun Hee Lee for her help in performing and manag- ing this study.
DISCLOSURE
Dr. Young Min Cho received a lecture fee and consultation fee from Astra-Zeneca, Boeringer Ingelheim, Merck Sharp and Doh- me K.K., LG Life Sciences Ltd., and Hanmi Pharmaceutical Co., Ltd. The funders had no role in study design, data collection and analysis, decision to publish, or preparation of the manuscript.
AUTHOR CONTRIBUTION
Research conception and design: Lee YH, Kim JH, Lee BW. Per- forming the research: Jin HY, Rhee EJ, Cho YM, Lee BW. Statisti- cal analysis: Lee YH, Kim SR, Rhee EJ, Cho YM, Lee BW. Writing
of the manuscript: Lee YH, Kim JH, Kim SR, Lee BW. Approval of final manuscript: all authors.
ORCID
Yong-ho Lee http://orcid.org/0000-0002-6219-4942 Jae Hyeon Kim http://orcid.org/0000-0001-5001-963X So Ra Kim http://orcid.org/0000-0002-5778-370X Heung Yong Jin http://orcid.org/0000-0002-1841-2092 Eun-Jung Rhee http://orcid.org/0000-0002-6108-7758 Young Min Cho http://orcid.org/0000-0002-2331-6126 Byung-Wan Lee http://orcid.org/0000-0002-9899-4992
REFERENCES
1. Wang YC, McPherson K, Marsh T, Gortmaker SL, Brown M. Health and economic burden of the projected obesity trends in the USA and the UK.
Lancet 2011; 378: 815-25.
2. Yoo HJ, Choi KM. Hepatokines as a link between obesity and cardiovas- cular diseases. Diabetes Metab J 2015; 39: 10-5.
3. Park SK, Ryoo JH, Choi JM, Seo MW, Park CM. The risk of abdominal obe- sity according to the degree of non-alcoholic fatty liver disease in Korean men. J Korean Med Sci 2016; 31: 410-6.
4. Lee YH, Bang H, Park YM, Bae JC, Lee BW, Kang ES, Cha BS, Lee HC, Bal- kau B, Lee WY, et al. Non-laboratory-based self-assessment screening score for non-alcoholic fatty liver disease: development, validation and comparison with other scores. PLoS One 2014; 9: e107584.
5. Chalasani N, Younossi Z, Lavine JE, Diehl AM, Brunt EM, Cusi K, Charl- ton M, Sanyal AJ. The diagnosis and management of non-alcoholic fatty liver disease: practice guideline by the American Association for the Study of Liver Diseases, American College of Gastroenterology, and the Ameri- can Gastroenterological Association. Hepatology 2012; 55: 2005-23.
6. Williams CD, Stengel J, Asike MI, Torres DM, Shaw J, Contreras M, Landt CL, Harrison SA. Prevalence of nonalcoholic fatty liver disease and non- alcoholic steatohepatitis among a largely middle-aged population utiliz- ing ultrasound and liver biopsy: a prospective study. Gastroenterology 2011; 140: 124-31.
7. Kim SK, Choi YJ, Huh BW, Park SW, Lee EJ, Cho YW, Huh KB. Nonalco- holic fatty liver disease is associated with increased carotid intima-media thickness only in type 2 diabetic subjects with insulin resistance. J Clin Endocrinol Metab 2014; 99: 1879-84.
8. Harrison SA, Oliver D, Arnold HL, Gogia S, Neuschwander-Tetri BA. De- velopment and validation of a simple NAFLD clinical scoring system for identifying patients without advanced disease. Gut 2008; 57: 1441-7.
9. Chon YE, Kim KJ, Jung KS, Kim SU, Park JY, Kim DY, Ahn SH, Chon CY, Chung JB, Park KH, et al. The relationship between type 2 diabetes melli- tus and non-alcoholic fatty liver disease measured by controlled attenua- tion parameter. Yonsei Med J 2016; 57: 885-92.
10. Kim SY. Noninvasive markers for the diagnosis of nonalcoholic fatty liver disease. Endocrinol Metab (Seoul) 2013; 28: 280-2.
11. Sasso M, Beaugrand M, de Ledinghen V, Douvin C, Marcellin P, Poupon R, Sandrin L, Miette V. Controlled attenuation parameter (CAP): a novel VCTE™ guided ultrasonic attenuation measurement for the evaluation of hepatic steatosis: preliminary study and validation in a cohort of patients
with chronic liver disease from various causes. Ultrasound Med Biol 2010;
36: 1825-35.
12. de Lédinghen V, Vergniol J, Capdepont M, Chermak F, Hiriart JB, Cassino- tto C, Merrouche W, Foucher J, Brigitte le B. Controlled attenuation pa- rameter (CAP) for the diagnosis of steatosis: a prospective study of 5323 examinations. J Hepatol 2014; 60: 1026-31.
13. Corzo C, Griffin PR. Targeting the peroxisome proliferator-activated re- ceptor-gamma to counter the inflammatory milieu in obesity. Diabetes Metab J 2013; 37: 395-403.
14. Kim JW, Kim JR, Yi S, Shin KH, Shin HS, Yoon SH, Cho JY, Kim DH, Shin SG, Jang IJ, et al. Tolerability and pharmacokinetics of lobeglitazone (CKD- 501), a peroxisome proliferator-activated receptor-gamma agonist: a sin- gle- and multiple-dose, double-blind, randomized control study in healthy male Korean subjects. Clin Ther 2011; 33: 1819-30.
15. Kim SG, Kim DM, Woo JT, Jang HC, Chung CH, Ko KS, Park JH, Park YS, Kim SJ, Choi DS. Efficacy and safety of lobeglitazone monotherapy in pa- tients with type 2 diabetes mellitus over 24-weeks: a multicenter, random- ized, double-blind, parallel-group, placebo controlled trial. PLoS One 2014;
9: e92843.
16. Jin SM, Park CY, Cho YM, Ku BJ, Ahn CW, Cha BS, Min KW, Sung YA, Baik SH, Lee KW, et al. Lobeglitazone and pioglitazone as add-ons to metfor- min for patients with type 2 diabetes: a 24-week, multicentre, random- ized, double-blind, parallel-group, active-controlled, phase III clinical tri- al with a 28-week extension. Diabetes Obes Metab 2015; 17: 599-602.
17. Kim SH, Kim SG, Kim DM, Woo JT, Jang HC, Chung CH, Ko KS, Park JH, Park YS, Kim SJ, et al. Safety and efficacy of lobeglitazone monotherapy in patients with type 2 diabetes mellitus over 52 weeks: an open-label ex- tension study. Diabetes Res Clin Pract 2015; 110: e27-30.
18. Chon YE, Jung KS, Kim SU, Park JY, Park YN, Kim DY, Ahn SH, Chon CY, Lee HW, Park Y, et al. Controlled attenuation parameter (CAP) for detec- tion of hepatic steatosis in patients with chronic liver diseases: a prospec- tive study of a native Korean population. Liver Int 2014; 34: 102-9.
19. Claridge LC. Rising liver death rate: food for thought. Lancet 2011; 377:
2179-80.
20. Arab JP, Candia R, Zapata R, Muñoz C, Arancibia JP, Poniachik J, Soza A, Fuster F, Brahm J, Sanhueza E, et al. Management of nonalcoholic fatty liver disease: an evidence-based clinical practice review. World J Gastro- enterol 2014; 20: 12182-201.
21. Sanyal AJ, Mofrad PS, Contos MJ, Sargeant C, Luketic VA, Sterling RK, Stra- vitz RT, Shiffman ML, Clore J, Mills AS. A pilot study of vitamin E versus vitamin E and pioglitazone for the treatment of nonalcoholic steatohepa- titis. Clin Gastroenterol Hepatol 2004; 2: 1107-15.
22. Ratziu V, Giral P, Jacqueminet S, Charlotte F, Hartemann-Heurtier A, Ser- faty L, Podevin P, Lacorte JM, Bernhardt C, Bruckert E, et al. Rosiglitazone for nonalcoholic steatohepatitis: one-year results of the randomized pla- cebo-controlled fatty liver improvement with Rosiglitazone therapy (FLIRT) trial. Gastroenterology 2008; 135: 100-10.
23. Belfort R, Harrison SA, Brown K, Darland C, Finch J, Hardies J, Balas B, Gastaldelli A, Tio F, Pulcini J, et al. A placebo-controlled trial of pioglitazone in subjects with nonalcoholic steatohepatitis. N Engl J Med 2006; 355: 2297- 307.
24. Sanyal AJ, Chalasani N, Kowdley KV, McCullough A, Diehl AM, Bass NM, Neuschwander-Tetri BA, Lavine JE, Tonascia J, Unalp A, et al. Pioglitazone, vitamin E, or placebo for nonalcoholic steatohepatitis. N Engl J Med 2010;
362: 1675-85.
25. Aithal GP, Thomas JA, Kaye PV, Lawson A, Ryder SD, Spendlove I, Austin AS, Freeman JG, Morgan L, Webber J. Randomized, placebo-controlled trial of pioglitazone in nondiabetic subjects with nonalcoholic steatohep- atitis. Gastroenterology 2008; 135: 1176-84.
26. Musso G, Gambino R, Cassader M, Pagano G. A meta-analysis of rando- mized trials for the treatment of nonalcoholic fatty liver disease. Hepatol- ogy 2010; 52: 79-104.
27. Lupșor-Platon M, Feier D, Stefănescu H, Tamas A, Botan E, Sparchez Z, Maniu A, Badea R. Diagnostic accuracy of controlled attenuation param- eter measured by transient elastography for the non-invasive assessment of liver steatosis: a prospective study. J Gastrointestin Liver Dis 2015; 24:
35-42.
28. Shen F, Zheng RD, Mi YQ, Wang XY, Pan Q, Chen GY, Cao HX, Chen ML, Xu L, Chen JN, et al. Controlled attenuation parameter for non-invasive assessment of hepatic steatosis in Chinese patients. World J Gastroenter- ol 2014; 20: 4702-11.
29. Masaki K, Takaki S, Hyogo H, Kobayashi T, Fukuhara T, Naeshiro N, Hon- da Y, Nakahara T, Ohno A, Miyaki D, et al. Utility of controlled attenuation parameter measurement for assessing liver steatosis in Japanese patients with chronic liver diseases. Hepatol Res 2013; 43: 1182-9.
30. de Lédinghen V, Wong GL, Vergniol J, Chan HL, Hiriart JB, Chan AW, Cher- mak F, Choi PC, Foucher J, Chan CK, et al. Controlled attenuation param-
eter for the diagnosis of steatosis in non-alcoholic fatty liver disease. J Gas- troenterol Hepatol 2016; 31: 848-55.
31. Bi Y, Zhang B, Xu W, Yang H, Feng W, Li C, Tong G, Li M, Wang X, Shen S, et al. Effects of exenatide, insulin, and pioglitazone on liver fat content and body fat distributions in drug-naive subjects with type 2 diabetes.
Acta Diabetol 2014; 51: 865-73.
32. Koenen TB, Tack CJ, Kroese JM, Hermus AR, Sweep FC, van der Laak J, Stalenhoef AF, de Graaf J, van Tits LJ, Stienstra R. Pioglitazone treatment enlarges subcutaneous adipocytes in insulin-resistant patients. J Clin Endocrinol Metab 2009; 94: 4453-7.
33. Musso G, Cassader M, Rosina F, Gambino R. Impact of current treatments on liver disease, glucose metabolism and cardiovascular risk in non-al- coholic fatty liver disease (NAFLD): a systematic review and meta-analy- sis of randomised trials. Diabetologia 2012; 55: 885-904.
34. Song YM, Lee YH, Kim JW, Ham DS, Kang ES, Cha BS, Lee HC, Lee BW.
Metformin alleviates hepatosteatosis by restoring SIRT1-mediated auto- phagy induction via an AMP-activated protein kinase-independent path- way. Autophagy 2015; 11: 46-59.
35. Song YM, Lee WK, Lee YH, Kang ES, Cha BS, Lee BW. Metformin restores parkin-mediated mitophagy, suppressed by cytosolic p53. Int J Mol Sci 2016; 17: E122.