Genetic Diversity and Population Structure of a Korean Rice Germplasm Based on DNA Profiles
Kyung Jun Lee 1 , Jung-Ro Lee 1 , Myoung-Jae Shin 1 , Gyu-Taek Cho 1 , Kyung-Ho Ma 1 , Gi-An Lee 1,† , and Jong-Wook Chung 2,†
ABSTRACT Information on the patterns of genetic diversity and population structure is essential for the rational use and efficient management of germplasms; accurate information aids in monitoring germplasms, and can also be used to predict potential genetic gains. In this study, we assessed genetic diversity, focusing on Korean rice accessions for theand their sustainable conserved diversity. Using DNA profiling with 12 simple sequence repeat (SSR) markers, we detected a total of 333 alleles among 2,016 accessions. The number of alleles ranged from 21 to 53, with an average of 27.8. Average polymorphism information content was 0.797, with the lowest being 0.667 and the highest 0.940. CA cluster analysis and the model-based population structure revealed two main groups that could be subdivided into five subgroups. Analysis of the molecular variance study based on the SSR profile data showed 5% variance among the profiles, whereas we recorded 93% variance among individuals and 2%
variance within individuals. Specifically, the utilized diversity for of the breeding program is restricted in that cultivars were located in limited clades. These results revealed that preserving the diversity of Korean landraces could be useful sources for breeding new rice cultivars, and cwould be the basis for the sustainable conservation and utilization of a Korean rice germplasm.
Keywords : genetic diversity, population structure, rice germplasm, SSR marker
DOI : https://doi.org/10.7740/kjcs.2018.63.1.001Original Research Article
ⓒ 본 학회지의 저작권은 한국작물학회지에 있으며, 이의 무단전재나 복제를 금합니다.
This is an Open-Access article distributed under the terms of the Creative Commons Attribution Non-Commercial License (http://creativecommons.org/licenses/by-nc/3.0) which permits unrestricted non-commercial use, distribution, and reproduction in any medium, provided the original work is properly cited.
1)
National Agrobiodiversity Center, National Institute of Agricultural Sciences (NAS), RDA, 370 Nonsaengmyeong-Ro, Wansan-Gu, Jeonju-Si, Jeollabuk-Do, 54874, Korea
2)
Dept. of Industrial Plant Science & Technology, Chungbuk National University, Cheongju, 28644, Korea
†
Corresponding author: Gi-An Lee; (Phone) +82-63-238-4873; (E-mail) [email protected]
: Jong-Wook Chung; (Phone) +82-43-261-2518; (E-mail) [email protected]
<Received 22 November, 2017; Revised 25 January, 2018; Accepted 27 January, 2018>
Rice (Oryza sativa L.) is an important cereal crop consumed exclusively by humans; it supplies staple food for nearly 50%
of the global population (Garris et al., 2005). Researchers in many countries are interested in collecting rice germplasm because genetic rice resources, stored in gene banks throughout the world, could be valuable resources for bioindustry (Rutger et al., 1999). In Korea, the Rural Development Administration (RDA) Gene Bank maintains about 40,000 accessions of rice germplasm (http://www.genebank.rda.go.kr/). Although many RDA Gene Bank rice accessions and phenotypic characteristics have already been evaluated in the field of population diversity, there has been insufficient analysis of genetic diversity and relationship at the molecular level. In addition, most of the archived accessions have been utilized rarely or not at all in rice breeding programs.
The loss of genetic diversity in cultivated rice can have
serious consequences for the crop from susceptibility to epide- mic disease to the lack of evolutionary potential for adaptation to changing environments (Pusadee et al., 2009). To maintain genetic diversity in a rice germplasm, rice accessions with significant genetic variation should be included. In addition, it is necessary to investigate genetic diversity in the rice germplasm to broaden genetic variation in rice breeding because knowledge of germplasm genetic diversity is critical for utilization in crop improvement (Wang et al., 2013). In many previous researches, the genetic diversity of Korean rice germplasm has been performed using various molecular markers to provide useful guidelines for the strategic conserva- tion and utilization of rice germplasm (Lee et al., 2015; Li et al., 2014; Wang et al., 2013; Zhao et al., 2009).
A clear understanding of genetic diversity is essential for
effective conservation and utilization of genetic rice resources
Table 1. Summary of the 2,016 rice accessions used for this study.
Origin Type No. of accessions
KOR (Republic of Korea) Landrace 1,059
Cultivar 410
PRK (People's Republic of Korea) Landrace 327
IRRI (International Rice Research Institute) 220
Total 2,016
Table 2. SSR primers used for genotyping the 2,016 rice accessions, No. of alleles amplified, gene diversity, heterozygosity, and PIC.
Marker Chr. Forward primer Reverse primer MAF
1Na GD He PIC
RM1 1 GCGAAAACACAATGCAAAAA GCGTTGGTTGGACCTGAC 0.484 25 0.701 0.005 0.667
RM249 5 GGCGTAAAGGTTTTGCATGT ATGATGCCATGAAGGTCAGC 0.302 21 0.864 0.012 0.854
RM250 2 GGTTCAAACCAAGCTGATCA GATGAAGGCCTTCCACGCAG 0.308 22 0.828 0.002 0.811
RM335 4 GTACACACCCACATCGAGAAG GCTCTATGCGAGTATCCATGG 0.376 23 0.777 0.002 0.749 RM214 7 CTGATGATAGAAACCTCTTCTC AAGAACAGCTGACTTCACAA 0.437 28 0.774 0.015 0.760
RM257 9 CAGTTCCGAGCAAGAGTACTC GGATCGGACGTGGCATATG 0.210 29 0.889 0.028 0.880
RM418 7 TCGCGTATCGTCATGCATAG GAGCACATATGCCACGTACG 0.208 30 0.866 0.003 0.853
RM5647 8 ACTCCGACTGCAGTTTTTGC AACTTGGTCGTGGACAGTGC 0.396 23 0.763 0.003 0.734
RM144 11 TGCCCTGGCGCAAATTTGATCC GCTAGAGGAGATCAGATGGTAGTGCATG 0.244 26 0.829 0.003 0.808
RM247 12 TAGTGCCGATCGATGTAACG CATATGGTTTTGACAAAGCG 0.439 32 0.762 0.004 0.743
RM206 11 CCCATGCGTTTAACTATTCT CGTTCCATCGATCCGTATGG 0.123 53 0.943 0.088 0.940
RM021 11 ACAGTATTCCGTAGGCACGG GCTCCATGAGGGTGGTAGAG 0.385 21 0.756 0.011 0.725
Mean 0.326 27.8 0.813 0.014 0.797
1
MAF, major allele frequency; Na, Number of alleles; GD, genetic diversity; He, Heterozygosity; PIC, polymorphism information content.
(Tu et al., 2007). Genetic diversity information provides opportunities for plant breeders to develop new and improved cultivars with desirable characteristics including farmer- preferred and breeder-preferred traits (Govindaraj et al., 2015).
Molecular markers are used to assess genetic diversity and population structure to predict hybrid performance and heterosis because these markers are inherited guided by Mendelian rules and are not influenced by environmental factors (Kashiani et al., 2012; Legesse et al., 2007). Among many different molecular markers, simple sequence repeat (SSR) markers are the preferred choice for certain genetic studies because they can easily detect co-dominant alleles, are highly reproducible, and have very high levels of polymor- phisms (Litt and Luty, 1989; Weber and May, 1989).
Genetic analysis is very important to ensure the success of preserving and utilizing plant germplasm in Korea’s RDA Gene Bank. In order to improve breeding material selection
from the conserved germplasm of the gene bank, we evaluated a total of 2,016 rice accessions including Korean (KOR) landraces and cultivars, landraces from the People’s Republic of Korea (PRK), and major International Rice Research Institute (IRRI) rice accessions. Our main objectives were to investigate the genetic diversity of conserved Korean rice accessions using 12 polymorphic SSR markers, evaluate their population structures and clustering patterns, and survey the status of the conserved and utilized genetic diversity. These results will help to improve rice breeding programs and will be helpful for preserving and applying genetic rice resources in Korea.
MATERIALS AND METHODS Plant materials and Data collection
We obtained a total of 2,016 rice accessions (Table 1 and
Supplementary Table 1) from the National Agrobiodiversity
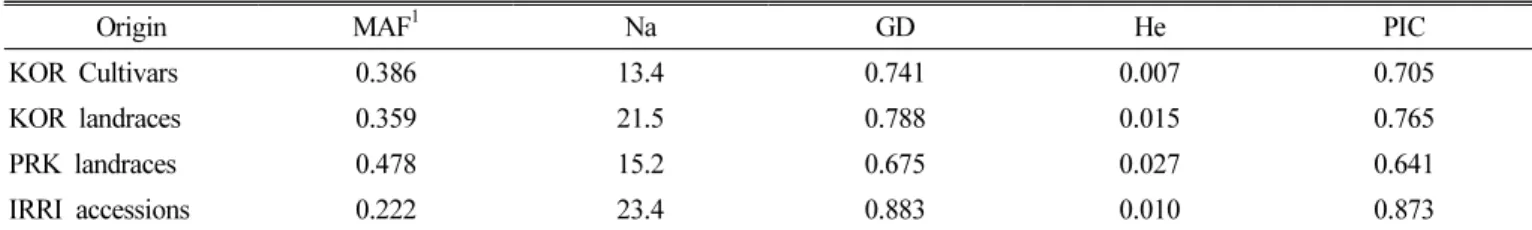
Table 3. Genetic diversity in the 2,016 rice accessions.
Origin MAF
1Na GD He PIC
KOR Cultivars 0.386 13.4 0.741 0.007 0.705
KOR landraces 0.359 21.5 0.788 0.015 0.765
PRK landraces 0.478 15.2 0.675 0.027 0.641
IRRI accessions 0.222 23.4 0.883 0.010 0.873
1
MAF, major allele frequency; Na, Number of alleles; GD, genetic diversity; He, Heterozygosity; PIC, polymorphism information content.
Center of the Rural Development Administration (RDA), Republic of Korea (http://genebank.rda.go.kr).
DNA extraction
We extracted total genomic DNA from young leaf tissue ground in liquid nitrogen using the modified CTAB method (Dellaporta et al., 1983). We determined DNA concentration and quality using a NanoDrop ND-1000 spectrometer (NanoDrop Technologies, Wilmington, DE, USA). We diluted DNA stocks to 20 ng/ μl as working solutions.
SSR analysis
We chose markers according to their location on the rice genetic map and their suitability for high-throughput genotyping, using a total of 12 SSR markers (Table 1). We amplified the alleles in 20- μL volume containing 100 ng template DNA, 1×PCR buffer, and 0.2 mM each of dNTP, 1 U Taq DNA polymerase, and 2 pmol of reverse and forward primer, and we labeled the forward primers with different fluorescence:
FAM, HEX, VIC, and NED. The published amplification conditions were: 94°C for 3 min, 30 cycles of 94°C for 30 s, 55°C (or other annealing temperature depending on the primer) for 45 s, 72°C for 1 min, and a final extension at 72°C for 10 min. We resolved SSR alleles using an ABI 3130xl Genetic Analyzer (Life Δ Technologies Corp., Carlsbad, CA, USA) with GeneScan 3.7 software. The alleles were sized precisely against 6-carboxy-X-rhodamine molecular size standards using Genotyper 3.7 software (Life Technologies Corp.).
Analysis of population structure
As an indicator of genetic diversity, we calculated major allele frequency (MAF), number of alleles (NA), genetic diversity (GD), expected heterozygosity (He), and polymorphism information content (PIC) using the genetic analysis package PowerMarker V3.25 (Liu and Muse, 2005). We constructed
an unweighted neighbor joining tree using DARwin V6.0 and used structure V2.3.4 to detect possible subpopulations (K=1 to K=10) with a model that allowed for admixture and correlated allele frequencies using a burn-in period of 50,000 and MCMC repeats of 50,000 followed by three iterations (Pritchard et al., 2000). The optimal number of populations corresponds to the highest peak in the ΔK graph (Evanno et al., 2005), and we assigned the landraces with membership probabilities ≥ 70% to each subpopulation.
RESULTS SSR markers based analysis
We used 12 SSR markers to characterize 2,016 rice accessions and calculated Na (the number of allele), GD (genetic diversity), He (heterozygosity), MAF (major allele frequency), and PIC (polymorphism information content) for all 12 markers.
We amplified a total of 333 alleles with an average of 27.8 per locus (Table 2); Na amplified per SSR primer varied from 21 to 53, with the maximum number being amplified by primer, RM205 The PICs for the SSR markers ranged from 0.667 (RM1) to 0.940 (RM206) with a mean of 0.797; GD ranged from 0.701 (RM1) to 0.943 (RM206) with an average of 0.813;
He varied from 0.002 (RM250 and RM335) to 0.088 (RM206) with an average of just 0.014; and MAF ranged from 0.123 (RM206) to 0.484 (RM1) with an average of 0.326.
The numbers of alleles were 13.4, 23.4, 21.5, and 15.2 in the
Korean cultivars (KC), Korean landraces (KL), PRK landraces
(PL) and IRRA accessions (IA), respectively (Table 3). The
PICs for KC, KL, PL, and IA were 0.705, 0.765, 0.641, and
0.873, respectively. The GD and He of KC, KL, PL, and IA
were 0.741, 0.788, 0.675, and 0.883 and 0.007, 0.015, 0.027,
and 0.010, both respectively. The MAFs of KC, KL, PL and
IA were 0.386, 0.359, 0.478, and 0.222, also respectively.
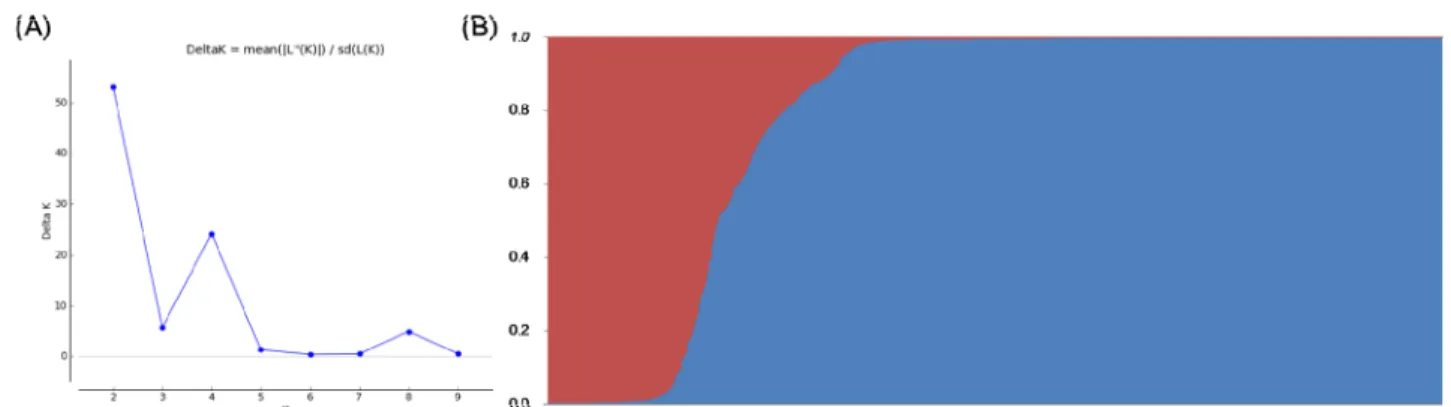
Fig.1. Estimation of population using LnP(D) derived ΔK from 1 to 20 (A) and the population structures of the 2,016 rice accessions (B).
Fig.2. Neighbor-Jjoining (NJ) tree of the 2,016 rice accessions based on the 12 SSR markers; red and blue circles are the population structures pop1 and pop2, respectively.
Fig. 3. Principal coordinate analysis of 2,016 rice accessions based on the 12 SSR markers.
Model-based population structure and hierarchical cluster analysis
We used the amplicons generated by 12 SSR markers across 2,016 accessions to analyze model-based population
structure and hierarchical clusters, and the inferred population
structure and unrooted neighbor joining (NJ) tree (Fig. 1 and
Fig. 2) among the 2,016 accessions revealed that there might
be two main group and five groups, respectively, that were
divergent.
Table 4. Summary of analysis of molecular variance (AMOVA).
Source df
1SS MS Est. Var. % Fst P value
Among Populations 3 660.646 220.215 0.234 5% 0.048 0.001
Among Individuals 2012 18649.052 9.269 4.592 94%
Within Individuals 2016 170.500 0.085 0.085 2%
Total 4031 19480.198 4.911 100%
1