This is an Open Access article distributed under the terms of the Creative Commons Attribution License (http://creativecommons.org/licenses/by/4.0) which permits unrestricted use, distribution, and reproduction in any medium, provided the original work is properly cited.
Copyright © 2021 Korean Society of Women Health Nursing
Do depression and its associated factors differ in women daytime and shift workers?: an analysis of the Korea National Health and Nutrition Examination Survey 2018
Hyun Ju Chae
1, Mijong Kim
21
Department of Nursing, Joongbu University, Geumsan, Korea
2
Department of Nursing, Hannam University, Daejeon, Korea
Purpose: This study examined health behaviors, use of health services, and depression among
women who perform daytime and shift work in Korea, as well as factors related to depression.
Methods: We conducted a secondary analysis using data from the 2018 data of the 7th Korea Na-
tional Health and Nutrition Examination Survey. Data on women, 1,493 regular daytime workers and 322 shift workers, were analyzed.
Results: Women shift workers (χ2
=43.97, p<.001), had a lower education level (χ
2=45.56, p<.001), and lower personal income (χ
2=16.85, p=.030) than their daytime counterparts. A higher propor- tion of shift workers were unmarried (χ
2=37.47, p<.001) and they typically worked fewer than 40 hours per week (χ
2=69.94, p<.001). The depression score of shift workers was higher than that of daytime workers (t=2.85, p=.005). A higher proportion of shift workers also drank alcohol (χ
2=6.49, p=.032) and smoked (χ
2=30.79, p<.001). Over 8% of shift workers typically slept fewer than 5 hours per night (χ
2=14.17, p=.024). It was confirmed that depression in women shift workers was affected by age, personal income, marital status, health status, and smoking status, in addition to cancer screening participation, unmet medical care needs, and unmet dental care needs.
Conclusion: More attention should be given to the health needs of women working shifts. Health
promotion programs specific for women shift workers are needed to improve their physical and men- tal health, encourage use of medical care services, and improve public health policies and systems.
Keywords: Depression; Health behavior; Health services; Shift work schedule; Working women
Introduction
As the desire for higher education and self-actualization has in- creased among women in Korea, their participation in the econ- omy has also increased, with the rate of employment for women rising from 54.9% in 2011 to 60.0% in 2019 [1,2]. However, this remarkable increase in women’s employment rate does not mean that women’s self-actualization and quality of life have necessarily improved. This is because a high proportion of women under- take non-regular shift work and part-time work compared to
Received: January 28, 2001 Revised: May 16, 2021 Accepted: May 17, 2021 Corresponding author:
Mijong Kim
Department of Nursing, Hannam University, 70 Hannamro, Daedeok- gu, Daejeon 34430, Korea Tel : +82-42-629-8477 E-mail: [email protected] pISSN 2287-1640 · eISSN 2093-7695
Korean J Women Health Nurs 2021;27(2):113-127 https://doi.org/10.4069/kjwhn.2021.05.17
men, and inequality has been identified as a new problem related to the different employment rates and employment patterns of men and women [3]. Married women in the workforce in partic- ular, must participate in economic activities on a par with men, while also performing additional household roles such as house- keeping and childcare; these coexisting demands can be consid- ered hazardous to their health [1,4].
Shift work refers to a type of work in which people are divided
into two or more groups, and the daily work is divided into two
or more shifts [5,6]. With the growing emphasis on convenience
in everyday life, shift work has been increasing in popularity in recent years [5], and there has been a growing interest in the im- pact of shift work on workers’ physical, mental, and social health.
Compared to regular daytime workers, shift workers are more likely to experience disruptions in their daily routines and lives due to irregular working hours, and thus have more difficulty maintaining positive everyday health behaviors [7,8]. It is well- known that shift work interferes with workers’ normal sleep- wake cycles, especially night shift workers, for whom the risk of safety accidents is high due to decreased concentration. Thus, a high proportion of shift workers in general tend to engage in un- healthy behaviors such as not getting enough sleep, smoking, and drinking alcohol [8,9]. As a result, shift work can lead to difficul- ties maintaining good health in daily life and increase workers’
vulnerability to diseases. Shift workers frequently experience di- gestive, musculoskeletal, metabolic, and cerebrovascular diseases [8-10], and women shift workers have been reported to have an elevated risk of breast cancer [9,10] and premature birth [10] or miscarriage [10].
Studies on the mental health of shift workers have found that shift workers tend to experience a variety of mental health prob- lems such as high stress [11], depression, and anxiety [7]. Seri- ous depression among women shift workers was also found in preceding studies [11,12]. According to the Korean National Health and Nutrition Examination Survey (KNHANES), wom- en shift workers were 2.94 times more likely to develop depres- sion than their male counterparts [12], and the degree of depres- sion experienced by women shift workers was 1.73 times higher than men according to a meta-analysis of research on shift work- ers [11]. However, previous studies have not provided sufficient evidence regarding why women shift workers experience more
serious depression than men shift workers. Some studies have suggested that women generally have a higher risk of depression than men [11], while others have suggested that hormonal reac- tions can cause women to be more stressed about rotated or shift work, making them more vulnerable to depression than men [12]. One explanation for the high levels of depression among women shift workers may be that childcare or housework duties increase their fatigue and stress levels in addition to the negative physical and mental effects of shift work [1,3]. In order to identi- fy the causes and factors that influence depression among wom- en shift workers, studies that are designed to exclude the effects of exogenous variables should be conducted.
Unmet medical care needs, which occur when people are un- able to use medical services despite experiencing illness or health problems that require medical attention, is an important direct indicator of medical inequality [13,14]. These variables are meaningful indicators of the health of women who perform shift work. According to an analysis of adult women in Korea, the ex- tent to which women received insufficient medical care was at least 1.2 times and up to 1.5 times higher for employed women than for unemployed women, and the reasons for insufficient medical care among women were costs, long wait times at doc- tor’s offices, difficulties obtaining health services during working hours, and childcare responsibilities [15]. For employed women, analysis of unmet medical conditions of daytime workers and shift workers with modified working schedules is sorely lacking and more in-depth research is needed.
Prior studies have found that shift work and depression are re- lated. Although women shift workers reported more serious de- pression than men shift workers, most studies on depression that included women shift workers classified all participants simply as
Summary statement
• What is already known about this topic?
Regular shift work may be harmful to workers’ health. The negative effects of shift work on mental health have been repeatedly verified.
• What this paper adds
This study focused on the health of women shift workers. Compared to their counterparts working daytime, shift working women were more depressed, reported worse health behaviors, and had more unmet health care needs.
• Implications for practice, education, and/or policy
Women shift workers were younger, had lower education levels, and lower incomes than daytime workers. Considering that shift
working women were more depressed, more frequently consumed alcohol and smoked, and had a more vulnerable health status
than daytime workers, health promotion programs specific to their general characteristics and needs are in demand to protect and
promote their health.
shift workers, not accounting for gender differences in their anal- yses [11,12], or examined health behaviors, depression, and quality of life among all women workers regardless of work type [1,15]. In many studies, women shift workers were not distin- guished from other women workers according to their working patterns. In addition, studies of depression among shift workers have typically compared workers by sex, and many of the inter- pretations resulting from these studies have been fragmented [11,12].
Among women workers, those who perform shift work tend to face many health vulnerabilities. Studies that examine women workers should further classify them as daytime or shift-based workers, according to the type of work performed, in order to more accurately identify differences in health status and depres- sion. Furthermore, in order to better understand women shift workers’ health, identifying their unmet medical needs, which tend to be indicators of general characteristics, health behaviors, and medical inequality, is also of value. Depression among wom- en shift workers has already been shown to be at a serious level [11,12]. Thus, it is important and urgent to identify the factors affecting depression among women shift workers as a next step.
This study was therefore conducted to examine shift working women’s health behaviors, health care use, and depression ac- cording to their type of work, and analyze factors related to de- pression. This would improve the existing understanding of women shift workers’ mental health, and enable suggestions for future health promotion programs targeted to women shift work- ers, and provide basic data to support policies that address their needs.
Purpose of the study
This study was conducted to examine health behaviors, the use of medical services, and depression among women daytime workers and shift workers, and to identify factors related to de- pression using the 2018 data of the 7th KNHANES. The specific objectives of this study were as follows.
• To identify and compare the general characteristics, health-re- lated behaviors, use of medical services, and the prevalence of depression among women daytime and shift workers
• To analyze differences in the prevalence and degree of depres- sion according to the general characteristics, health-related be- haviors, and use of medical services of female daytime and shift workers
• To analyze factors related to depression among female daytime and shift workers
Methods
Ethics statement:
This study was exempted by the Institutional Review Board (IRB) of Hannam University (IRB-2020-E-03-01).
This study was a secondary analysis of data and data were received anonymously.
Design
This secondary analysis study used 2018 data from the 7th KN- HANES (2016-2018), with a correlational research design, to compare differences in health-related behaviors, medical service usage, and depression among working women and to identify factors related to depression among working women. This study was described in accordance with the Strengthening the Report- ing of Observational Studies in Epidemiology (STROBE) guide- lines (https://www.strobe-statement.org/index.php? id= strobe- home).
Participants
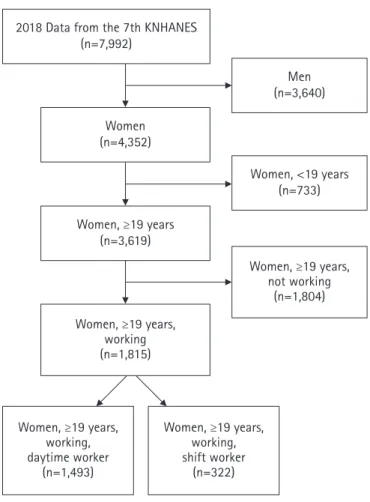
Participants were working women aged 19 years or older who participated in the 7th KNHANES, during the period of January to December 2018, conducted by the Korea Centers for Disease Control and Prevention. Women were considered employed if they answered “yes” to the following question: “Have you worked for more than 1 hour for income in the last week, or in an unpaid role as a family member for more than 18 hours?” Of the total 7,992 people who participated in the survey, 4,352 were women and 1,815 of whom were women aged 19 years or older (Figure 1).
In this study, women were considered daytime workers if they answered “yes” to the following question: “Do you usually work between 6 AM and 6 PM?” Women were considered shift work- ers if they worked any of the following: evening shifts (2 AM to midnight), night shifts (9 PM to 8 AM the next day), regular or irregular day and night shifts, 24-hour shifts, and other alterna- tives to a standard daytime work schedule. Of the 1,815 working women aged 19 years or older, 1,493 were daytime workers and 322 were shift workers.
Variables Depression
Depression in the 7th KNHANES was measured using the Pa-
tient Health Questionnaire-9 (PHQ-9) [16]. The PHQ-9 con-
sists of nine questions for determining if respondents have suf-
fered from depression-related symptoms over the previous 2
weeks, for which there are four possible responses: ‘not at all,’
‘several days,’ ‘more than half the days,’ or ‘nearly every day.’ The PHQ-9 results are calculated by summing scores for each ques- tion (0 not at all, to 3 nearly every day). Higher scores indicate a greater degree of depression. A score of 0–4 points indicates min- imal depression, 5–9 points indicates mild depression, 10–14 points indicates moderate depression, 15–19 points indicates moderately severe depression, and 20–27 points indicates severe depression. For analysis, 10 points was treated as the cutoff, with summed scores of 10 or greater indicating depression.
Health-related behaviors
Health-related behaviors were drinking status, smoking status, frequency of aerobic physical activity, and average nightly sleep- ing hours for both weeknights and weekend nights.
Participants were considered non-drinkers if they had not con- sumed alcohol in the past month, and drinkers if they had. They were considered non-smokers if they did not smoke or had quit
smoking, and smokers if they smoked daily or occasionally. Re- spondents were considered physically inactive if they participat- ed in aerobic physical activity rarely or never; physically active meant they participated in aerobic physical activity daily or often.
Average hours slept for both weeknights and weekend nights were classified in four categories: 4 hours or less, 5–6 hours, 7–8 hours, or 9 hours or more [17,18].
Use of medical services
To determine respondents’ use of medical services, KNHANES collected data on the following: Participants answered ‘yes’ or ‘no’
to questions asking whether they had received a medical check- up and cancer screening within the previous 2 years and a flu vac- cination within the previous year. Unmet medical needs and un- met dental needs were also determined.
General characteristics
General characteristics included age, education level, personal in- come, marital status, household type, relationship with other household members, occupation, average weekly working hours, and subjective health status.
Age was classified according to the following five groups: 19–
29, 30–39, 40–49, 50–59, or 60 years and older. Education level was classified as a middle school level or less, high school level, or college level and above. Income was divided into five classifica- tions according to the quintile classification criteria of the KN- HANES : high, upper middle, middle, lower middle, and low.
Marital status was either married or unmarried, and household types were divided into single-person and multi-person. Job type was classified as managers/professionals, office/service/sales, or other. The number of working hours per week was classified as less than 40 hours, 40 hours, between 40 and 52 hours, and more than 52 hours, based on labor law. Subjectively perceived health status was classified as good, moderate, or poor.
Data collection
The data used for this study were downloaded from the KN- HANES website. The KNHANES consists of a self-reported health survey, check-up survey, and nutrition survey at house- hold level, taking place over a 3-year period. Tests were conduct- ed at mobile screening centers, and nutritional surveys were con- ducted by visiting target households in person. The Korea Cen- ters for Disease Control and Prevention publishes the results of the survey with the disclosure of raw data on the KNHANES website, which only provides anonymous data so that individuals cannot be identified from the survey data in compliance with the Personal Information Protection Act and Statistics Act.
2018 Data from the 7th KNHANES (n=7,992)
Women (n=4,352)
Women, ≥19 years (n=3,619)
Women, ≥19 years, working (n=1,815)
Women, ≥19 years, working, daytime worker
(n=1,493)
Women, ≥19 years, working, shift worker
(n=322)
Men (n=3,640)
Women, <19 years (n=733)
Women, ≥19 years, not working
(n=1,804)
Figure 1. Flowchart of the study population.
KNHANES: Korea National Health and Nutritional Examination
Survey.
Data analysis
Data analysis in this study was conducted using IBM SPSS ver.
20.0 (IBM Corp., Armonk, NY, USA) and complex-sample anal- ysis, considering the complex-sample elements, strata, cluster, and weight. The specific data analysis methods were as follows.
(1) The general characteristics, health-related behaviors, and use of medical services among women daytime and shift workers were analyzed using complex-sample statistics. Depression was quantified using the mean and standard error with com- plex-sample descriptive analysis.
(2) A comparison of the general characteristics, health-related behaviors, and use of medical services between women day- time and shift workers was conducted using the com- plex-sample t-test and cross-tab analysis.
(3) Differences in the prevalence and intensity of depression be- tween women daytime workers and shift workers were ana- lyzed using a complex-sample general linear model.
(4) The general characteristics, health-related behaviors, and dif- ferences in the prevalence and intensity of depression accord- ing to the use of medical services were analyzed using a com- plex-sample general linear model.
(5) The depression-related factors of women daytime workers and shift workers were analyzed using a complex-sample gen- eral linear model.
Results
Differences in general characteristics between women daytime and shift workers
Women daytime and shift workers differed in terms of age, edu- cation level, personal income, marital status, and average hours worked per week. Among the age ranges, the smallest proportion of daytime workers was 19 to 29 years old (16.2%), as opposed to shift workers, for whom women aged 19 to 29 years made up the largest proportion (30.6%), showing a statistically significant difference (χ
2= 43.97, p<.001). There was also a difference in education level, with 46.8% of daytime workers reporting college education or higher, whereas 50.3% of shift workers reporting having graduated from high school (χ
2= 45.56, p <.001). For personal income, the highest proportion of daytime workers re- ported having upper middle (21.6%) or high (22.1%) personal income levels, while the highest proportion of shift workers re- ported having low (21.3%) and lower middle (25.8%) personal income levels (χ
2= 16.85, p=.030). There were also more un- married shift workers (35.6%) than their daytime working coun- terparts (20.1%) (χ
2= 45.56, p<.001). In terms of average hours worked per week, a higher proportion of daytime workers re-
ported working 40 hours per week or between 40 and 52 hours per week than shift workers, who mostly worked fewer than 40 hours per week (χ
2= 69.94, p<.001) (Table 1).
Differences in health-related behaviors, use of health care services, and depression between women daytime and shift workers
Daytime and shift working women differed in terms of drinking status, smoking status, physical activity, average hours slept per night on weeknights, medical check-ups, and cancer screening.
Shift workers had a higher proportion of drinkers (58.3%) than daytime workers (50.6%) (χ
2= 6.49, p=.032). In addition, shift workers had a higher proportion of smokers (15.0%) than day- time workers (6.1%) (χ
2= 30.79, p<.001). Shift workers also en- gaged in physical activity (48.5%) less often than daytime work- ers (40.1%) (χ
2= 7.87, p=.025). Daytime workers averaged 7-8 hours of sleep on weeknights (54.3%) more often than shift workers (49.8%), and more shift workers reported sleeping fewer than 5 hours per weeknight (8.3%) than daytime workers (3.9%) (χ
2= 14.17, p =.024). A lower proportion of shift workers re- ceived a medical check-up within the previous 2 years (60.9%) than daytime workers (73.6%) (χ
2= 21.85, p<.001). Fewer shift workers received cancer screening (54.3%) than daytime work- ers (64.5%) (χ
2= 12.38, p<.001).
The average scores for depression were higher among shift workers (3.19 points) than among daytime workers (2.42 points) (t= 2.85, p=.005). A higher proportion of shift workers also scored more than 10 points (indicating moderate depres- sion) on the PHQ-9 (8.6%) than daytime workers (χ
2= 14.22, p=.001) (Table 2).
Differences in depression according to general characteristics, health-related behaviors, and use of healthcare services among daytime workers
Daytime workers showed different results for depression accord- ing to age, personal income, marital status, household type, health status, drinking status, smoking status, physical activity, average hours slept per night on weeknights, average hours slept per night on weekend nights, medical check-up status, cancer screening status, unmet health care needs, and unmet dental care needs.
Depression was higher in women aged 19 to 29 years than in
women aged 60 years and over (F= 6.88, p<.001), and women
with a high level of personal income showed the lowest level of
depression (F= 6.95, p<.001). Single women more frequently
had depression than married women (F= 18.66, p<.001), and
women from single-person households had higher levels of de-
pression than women from multi-person households (F= 6.24, p=.013). Compared to women who perceived their health as be- ing good, women who perceived having moderate or poor nor- mal or bad health had higher levels of depression (F = 48.24, p<.001). Women who drank alcohol also had higher scores for depression than women who did not drink (F= 10.11, p=.002), and women who smoked had higher depression levels than non-smoking women (F= 14.24, p<.001).
Women who were physically active were more depressed than women who were inactive (F= 6.10, p=.015). In addition, wom- en who slept fewer than 5 hours on average during the week had higher levels of depression (F= 6.80, p<.001), as were women who slept fewer than 5 hours on average during the weekend
(F = 4.07, p =.008). Women who had not received a medical check-up (F = 7.74, p =.009) or cancer screening (F =6.18, p=.014) within the previous 2 years were more depressed on av- erage. Women daytime workers with unmet medical needs (F = 28.18, p <.001) and unmet dental care needs (F =11.46, p=. 001) also showed higher levels of depression (Table 3).
Differences in depression according to general characteristics, health-related behaviors, and use of healthcare services among shift workers
Depression among women shift workers varied depending on age, personal income, marital status, health status, smoking sta- tus, cancer screening status, unmet health care needs, and unmet
Table 1. General characteristics of daytime and shift working women (N=1,815)Characteristics Categories Daytime workers (n= 1,493) Shift workers (n= 322)
χ
2 (p)n† %‡ (SE) n† %‡ (SE)
Age (year) 19–29 173 16.2 (1.3) 75 30.6 (3.2) 43.97 (< .001)
30–39 246 18.9 (1.5) 40 12.8 (1.9)
40–49 349 23.0 (1.4) 77 23.2 (3.0)
50–59 368 24.3 (1.5) 80 22.3 (2.8)
≥ 60 357 17.6 (1.4) 50 11.1 (1.8)
Education level ≤ Middle school 405 22.3 (1.7) 61 16.1 (2.2) 45.56 (< .001)
High school 458 31.0 (1.5) 148 50.3 (3.2)
≥ College 630 46.8 (1.8) 113 33.6 (3.1)
Personal income Low 238 17.9 (1.2) 59 21.3 (3.2) 16.85 (.030)
Lower middle 284 17.9 (1.3) 79 25.8 (3.2)
Middle 300 20.5 (1.3) 57 16.7 (2.4)
Upper middle 328 21.6 (1.4) 66 19.4 (2.8)
High 340 22.1 (1.4) 60 16.8 (2.4)
Marital status Married 1,259 79.9 (1.5) 230 64.4 (3.2) 37.47 (< .001)
Unmarried 234 20.1 (1.5) 92 35.6 (3.2)
Household type Single-person 165 10.6 (1.2) 49 13.5 (2.1) 2.47 (.165)
Multi-person 1,328 89.4 (1.2) 273 86.5 (2.1)
Household head Self 554 35.8 (1.8) 129 36.8 (2.9) 0.12 (.746)
Other 939 64.2 (1.8) 193 63.2 (2.9)
Occupation type Manager/professional 342 25.6 (1.4) 96 26.5 (2.8) 4.77 (.236)
Office/service/sales 713 49.5 (1.5) 159 54.0 (3.5)
Others 438 25.0 (1.6) 67 19.4 (2.4)
Paid worker Yes 1,147 79.0 (1.3) 229 75.2 (2.9) 2.35 (.210)
No 346 21.0 (1.3) 93 24.8 (2.9)
Time spent working (hour/week) ≤ 39 650 41.8 (1.7) 213 66.3 (2.9) 69.94 (< .001)
40 321 22.0 (1.3) 25 9.4 (1.9)
41–51 331 23.9 (1.4) 53 15.2 (2.1)
≥ 52 191 12.4 (1.0) 31 9.2 (1.7)
Perceived health status Poor 245 16.0 (1.2) 52 16.4 (2.3) 0.65 (.800)
Moderate 798 52.7 (1.5) 179 54.5 (3.2)
Good 450 31.3 (1.3) 91 29.1 (3.0)
†Unweighted and valid frequency, ‡valid percentage.
dental care needs.
Depression was higher in women aged 19 to 29 and 30 to 39 compared to the other age ranges (F= 4.12, p=.003). Women with a high level of personal income had the lowest level of de- pression (F= 6.17, p<.001). Single women had higher levels of depression than married women (F = 6.68, p =.011). Women who smoked showed higher levels of depression than women who did not smoke (F= 11.31, p=.001). Compared to women who perceived their health as being good, women who perceived their health as normal or bad had higher levels of depression (F= 14.62, p<.001). Shift work women who had not received a cancer screening (F= 4.06, p=.046) were more depressed, and depression was high among women with unmet health care needs (F= 5.59, p=.019) and unmet dental care needs (F=6.01,
p=.015) (Table 3).
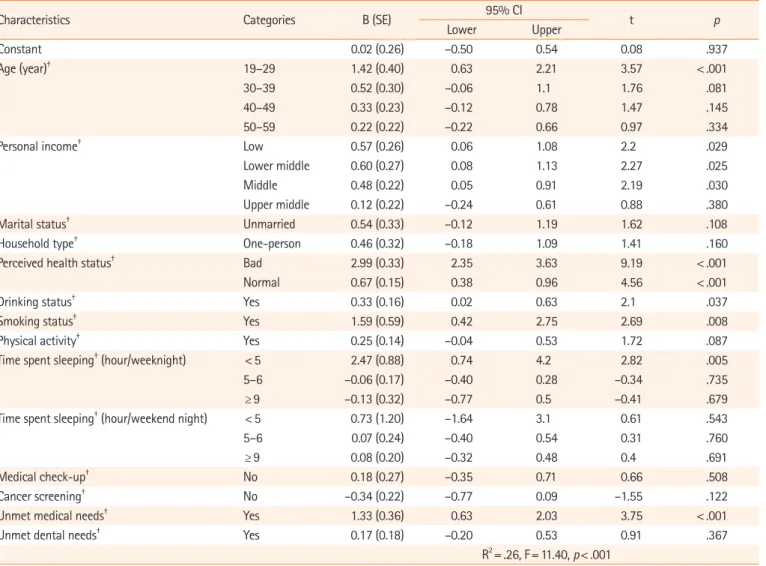
Factors related to depression in women workers
Depression-related factors for women daytime workers were age, personal income, health status, drinking status, smoking status, average hours slept per night, and unmet medical care needs, with 26% model explanation. Depression was higher in women aged 19 to 29 years than in women aged 60 years or older. Lower personal income and poor perceived health status also corre- sponded to higher levels of depression. Women who drank alco- hol and smoked had higher levels of depression than non-drink- ing and non-smoking women. Depression was higher among women who slept on average fewer than 5 hours per night on weeknights compared to women who averaged between 7 and 9
Table 2. Health behaviors and use of health services of women daytime and shift workers (N=1,815)Characteristics Categories
Daytime workers (n= 1,493) Shift workers (n= 322)
χ
2 (p) or t (p) n† or range %‡ (SE) ormean± SE n† or range %‡ (SE) or mean± SE Health behavior
Drinking Yes 703 50.6 (1.6) 175 58.3 (3.1) 6.49 (.032)
No 788 49.4 (1.6) 146 41.7 (3.1)
Smoking Yes 74 6.1 (0.9) 43 15.0 (2.4) 30.79 (< .001)
No 1,416 93.9 (0.9) 279 85.0 (2.4)
Physical activity Yes 583 40.1 (1.5) 147 48.5 (3.3) 7.87 (.025)
No 909 59.9 (1.5) 174 51.5 (3.3)
Time spent sleeping (hour/weeknight) ≤ 4 52 3.9 (0.6) 28 8.3 (1.8) 14.17 (.024)
5–6 512 35.2 (1.5) 110 33.4 (2.8)
7–8 817 54.3 (1.5) 159 49.8 (3.3)
≥ 9 109 6.7 (0.8) 25 8.4 (2.0)
Time spent sleeping (hour/weekend night) ≤ 4 24 1.6 (0.4) 12 3.2 (1.0) 3.63 (.477)
5–6 273 17.4 (1.1) 67 17.0 (2.2)
7–8 806 52.7 (1.4) 165 51.4 (3.3)
≥ 9 387 28.3 (1.5) 78 28.5 (3.4)
Health service use
Medical check-up No 377 26.4 (1.3) 121 39.1 (3.4) 21.85 (< .001)
Yes 1,115 73.6 (1.3) 201 60.9 (3.4)
Cancer screening No 490 35.5 (1.6) 136 45.7 (3.6) 12.38 (< .001)
Yes 1,002 64.5 (1.6) 186 54.3 (3.6)
Influenza vaccination No 890 61.6 (1.6) 202 66.9 (3.0) 3.32 (.113)
Yes 601 38.4 (1.6) 120 33.1 (3.0)
Unmet medical needs No 1331 89.2 (1.0) 293 90.8 (1.7) 0.71 (.448)
Yes 162 10.8 (1.0) 29 9.2 (1.7)
Unmet dental needs No 1,048 71.5 (1.4) 228 71.0 (3.0) 0.04 (.879)
Yes 443 28.5 (1.4) 94 29.0 (3.0)
Depression Total 0–27 2.42± 0.10 0–23 3.19± 0.27 2.85 (.005)
Yes ( ≥ 10) 56 3.8 (0.6) 29 8.6 (1.8) 14.22 (.001)
No (< 10) 1,430 96.2 (0.6) 293 91.4 (1.8)
†Unweighted and valid frequency, ‡valid percentage.
Table 3. Depression according to general characteristics, health behaviors, and use of health services (N=1,815)
Characteristics Categories Daytime workers (n= 1,493) Shift workers (n= 322)
Mean (SE) F (p) Mean (SE) F (p)
Age (year) 19–29 3.72 (0.29) 6.88 (< .001) 3.68 (0.56) 4.12 (.003)
30–39 2.20 (0.22) 4.95 (0.78)
40–49 2.14 (0.16) 2.93 (0.52)
50–59 2.15 (0.21) 2.42 (0.39)
≥ 60 2.21 (0.20) 1.89 (0.47)
Education level ≤ Middle school 2.55 (0.21) 0.43 (.649) 2.96 (0.65) 0.22 (.805)
High school 2.31 (0.16) 3.35 (0.39)
≥ College 2.43 (0.14) 3.05 (0.38)
Personal income Low 2.83 (0.24) 6.95 (< .001) 3.54 (0.68) 6.17 (< .001)
Lower middle 2.94 (0.27) 4.46 (0.64)
Middle 2.58 (0.19) 2.90 (0.53)
Upper middle 2.16 (0.16) 2.86 (0.47)
High 1.76 (0.15) 1.58 (0.29)
Marital status Married 2.17 (0.10) 18.66 (< .001) 2.61 (0.30) 6.68 (.011)
Unmarried 3.42 (0.27) 4.24 (0.53)
Household type Single-person 3.25 (0.35) 6.24(.013) 3.79 (0.52) 1.44 (.233)
Multi-person 2.32 (0.10) 3.10 (0.29)
Household head Self 2.66 (0.16) 3.35 (.069) 3.54 (0.39) 1.17 (.282)
Other 2.83 (0.12) 2.99 (0.35)
Occupation type Manager/professional 2.39 (0.19) 0.34 (.714) 2.95 (0.46) 0.25 (.781)
Office/service/sales 2.49 (0.14) 3.37 (0.40)
Others 2.30 (0.19) 3.04 (0.59)
Paid worker Yes 2.38 (0.10) 0.72 (.396) 3.11 (0.30) 0.31 (.582)
No 2.56 (0.19) 3.43 (0.51)
Time spent working
(hour/week) ≤ 39 2.31 (0.14) 0.92 (.432) 3.04 (0.31) 0.55 (.652)
40 2.31 (0.19) 2.82 (1.06)
41–51 2.73 (0.23) 3.35 (0.49)
≥ 52 2.37 (0.25) 4.41 (1.14)
Perceived health status Bad 4.81 (0.34) 48.24 (< .001) 6.01 (0.76) 14.62 (< .001)
Normal 2.28 (0.13) 3.07 (0.37)
Good 1.45 (0.12) 1.82 (0.30)
Drinking status Yes 2.70 (0.14) 10.11 (.002) 3.59 (0.40) 3.12 (.079)
No 2.14 (0.12) 2.63 (3.34)
Smoking status Yes 4.83 (0.67) 14.24 (< .001) 6.06 (0.96) 11.31 (.001)
No 2.27 (0.09) 2.68 (0.24)
Physical activity Yes 2.69 (0.15) 6.10 (.015) 3.38 (0.39) 0.55 (.461)
No 2.24 (0.12) 3.01 (0.34)
Time spent sleeping
(hour/weeknight) < 5 6.03 (0.82) 6.80 (< .001) 4.34 (1.24) 2.27 (.082)
5–6 2.20 (0.16) 3.41 (0.45)
7–8 2.28 (0.11) 2.63 (0.28)
≥ 9 2.51 (0.30) 4.54 (0.81)
Time spent sleeping
(hour/weekend night) < 5 6.28 (1.29) 4.07 (.008) 4.57 (1.56) 0.50 (.686)
5–6 2.25 (0.22) 3.28 (0.68)
7–8 2.22 (0.12) 2.94 (0.39)
≥ 9 2.66 (0.19) 3.43 (0.47)
Medical check-up No 2.84 (0.19) 7.74 (.009) 3.86 (0.49) 3.76 (.054)
Yes 2.27 (0.11) 2.76 (0.29)
Cancer screening No 2.72 (0.17) 6.18 (.014) 3.76 (0.43) 4.06 (.046)
Yes 2.23 (0.11) 2.71 (0.30)
(Continued to the next page)
hours of sleep on weeknights. Depression was also higher among women with unmet medical care needs (Table 4).
As for women shift workers, depression-related factors included age, personal income, health status, smoking status, unmet health care needs, and unmet dental care needs; the model including
these factors explained 31% of variance. Compared to women aged 60 years or older, depression was higher among women aged 30 to 39 years. Lower personal income and poor perceived health status corresponded to higher levels of depression. Women who smoked experienced higher levels of depression than non-smok-
Characteristics Categories Daytime workers (n= 1,493) Shift workers (n= 322)
Mean (SE) F (p) Mean (SE) F (p)
Influenza vaccination No 2.49 (0.12) 0.87 (.351) 3.42 (0.35) 2.08 (.152)
Yes 2.31 (0.15) 2.72 (0.35)
Unmet medical needs No 2.18 (0.09) 28.18 (< .001) 2.94 (0.25) 5.59 (.019)
Yes 4.37 (0.41) 5.69 (1.14)
Unmet dental needs No 2.20 (0.10) 11.46 (.001) 2.76 (0.28) 6.01 (.015)
Yes 2.97 (0.21) 4.25 (0.56)
Table 4. Factors related to depression among women daytime workers (N=1,493)
Characteristics Categories B (SE) 95% CI
t p
Lower Upper
Constant 0.02 (0.26) –0.50 0.54 0.08 .937
Age (year)† 19–29 1.42 (0.40) 0.63 2.21 3.57 < .001
30–39 0.52 (0.30) –0.06 1.1 1.76 .081
40–49 0.33 (0.23) –0.12 0.78 1.47 .145
50–59 0.22 (0.22) –0.22 0.66 0.97 .334
Personal income† Low 0.57 (0.26) 0.06 1.08 2.2 .029
Lower middle 0.60 (0.27) 0.08 1.13 2.27 .025
Middle 0.48 (0.22) 0.05 0.91 2.19 .030
Upper middle 0.12 (0.22) –0.24 0.61 0.88 .380
Marital status† Unmarried 0.54 (0.33) –0.12 1.19 1.62 .108
Household type† One-person 0.46 (0.32) –0.18 1.09 1.41 .160
Perceived health status† Bad 2.99 (0.33) 2.35 3.63 9.19 < .001
Normal 0.67 (0.15) 0.38 0.96 4.56 < .001
Drinking status† Yes 0.33 (0.16) 0.02 0.63 2.1 .037
Smoking status† Yes 1.59 (0.59) 0.42 2.75 2.69 .008
Physical activity† Yes 0.25 (0.14) –0.04 0.53 1.72 .087
Time spent sleeping† (hour/weeknight) < 5 2.47 (0.88) 0.74 4.2 2.82 .005
5–6 –0.06 (0.17) –0.40 0.28 –0.34 .735
≥ 9 –0.13 (0.32) –0.77 0.5 –0.41 .679
Time spent sleeping† (hour/weekend night) < 5 0.73 (1.20) –1.64 3.1 0.61 .543
5–6 0.07 (0.24) –0.40 0.54 0.31 .760
≥ 9 0.08 (0.20) –0.32 0.48 0.4 .691
Medical check-up† No 0.18 (0.27) –0.35 0.71 0.66 .508
Cancer screening† No –0.34 (0.22) –0.77 0.09 –1.55 .122
Unmet medical needs† Yes 1.33 (0.36) 0.63 2.03 3.75 < .001
Unmet dental needs† Yes 0.17 (0.18) –0.20 0.53 0.91 .367
R2= .26, F= 11.40, p< .001 CI: Confidence interval.
†The reference groups for dummy variables were as follows: age (≥60 years), personal income (high), marital status (married), household type (multi- person), perceived health status (good), drinking status (no), smoking status (no), physical activity (no), time spent sleeping (7–8 hours), medical check- up (yes), cancer screening (yes), unmet medical needs (no), and unmet dental needs (no).
Table 3. Continued
ing women, and depression was also higher among women with unmet medical and dental care needs (Table 5).
Discussion
In this study, depression was higher among women shift workers than among their daytime working counterparts. This is consis- tent with the results of a study of employed women showing a higher rate of depression among women who performed shift work than among women who were daytime workers [19] and a study of male and female workers that also showed a higher rate of depression among shift workers than among daytime workers [8,20]. Considering that the rate of depression is higher among women workers than men [20,21], these results indicate that women who perform shift work experience the most depression among various categories of workers. Because shift work is differ- ent from the 24-hour biological rhythm [22], it interferes with workers’ biological rhythm, leading to a variety of physical health problems as well as various mental health problems such as anxi- ety and depression [23,24]. However, shift work is inevitably performed due to industrial development and flexible working hours [8]. Therefore, efficient and practical interventions for de- pression prevention and management are needed for women shift workers, and to do so, it is necessary to accumulate evidence
through repeated studies that seek to identify the factors related to their experience of depression. In addition, the prevalence of shift work has continued to increase and is expected to further increase in the future [25,26]. This requires community-level and national attention and flexible measures such as adjusting shift work cycles, reducing shift work hours, and ensuring suffi- cient rest during shift work [8].
This study identified common influential factors on depres- sion for women workers: age, personal income, perceived health status, smoking status, and unmet medical needs. For daytime working women drinking status and average hours slept per weeknight were additional factors; whereas unmet dental needs were an extra factor for shift working women.
Age affected depression differently, however, between daytime and shift workers, with daytime workers experiencing higher lev- els of depression in the 19–29 years age range than in the 60 years and older range, while shift workers experienced higher lev- els of depression in the 30–39 years range than in the 60 years and older range. This is somewhat consistent with the results of a study on paid workers that showed higher rates of depression among younger workers, especially those between 19 and 39 years old [27]. The high level of depression among workers aged 19 to 39 years compared to other age ranges reflects the socio- economic environment of Korea, where there has been an in-
Table 5. Factors related to depression among women shift workers (N=322)Characteristics Categories B (SE) 95% CI
t p
Lower Upper
Constant –1.26 (0.71) –2.66 0.13 –1.79 .076
Age (year)† 19–29 1.26 (1.13) –0.98 3.49 1.11 .268
30–39 1.94 (0.83) 0.29 3.58 2.33 .021
40–49 0.77 (0.59) –0.40 1.94 1.3 .196
50–59 0.06 (0.64) –1.21 1.32 0.09 .927
Personal income† Low 1.15 (0.58) 0.01 2.29 1.99 .049
Lower middle 2.24 (0.61) 1.05 3.44 3.7 < .001
Middle 1.29 (0.56) 0.18 2.4 2.3 .023
Upper middle 1.10 (0.52) 0.07 2.14 2.1 .037
Marital status† Unmarried 0.90 (0.85) –0.78 2.58 1.06 .29
Perceived health status† Bad 3.08 (0.67) 1.77 4.4 4.63 < .001
Normal 1.19 (0.43) 0.35 2.04 2.81 .006
Smoking status† Yes 2.07 (0.86) 0.37 3.76 2.4 .017
Cancer screening† No 0.07 (0.45) –0.82 0.97 0.16 .870
Unmet medical needs† Yes 2.90 (0.92) 1.09 4.7 3.17 .002
Unmet dental needs† Yes 1.11 (0.52) 0.08 2.14 2.13 .035
R2= .31, F= 4.66, p< .001 CI: Confidence interval.
†The reference groups for dummy variables were as follows: age (≥60 years), personal income (high), marital status (married), perceived health status (good), smoking status (no), cancer screening (yes), unmet medical needs (no), and unmet dental needs (no).