Prevalence and Associated Factors of Depression in General
Population of Korea: Results from the Korea National Health and Nutrition Examination Survey, 2014
Depressive disorder is a common mental illness and remains a major cause of morbidity worldwide. The present study, a cross-sectional, nationwide, population-based survey assessed the prevalence of depression in the general population of Korea through a random sampling of the non-institutionalized population for the Korea National Health and Nutrition Examination Survey (KNHANES) VI. The Patient Health Questionnaire (PHQ)-9 was first introduced into the KNHANES to detect depression. The point prevalence of depression (PHQ score of 10 or higher) was 6.7% (95% confidence interval [CI], 5.7–7.6) in 4,949 subjects. Based on the analysis using the diagnostic algorithm of the PHQ-9, the prevalence of major depressive disorder was 2.7% (95% CI, 2.2–3.3). Multiple logistic regression analysis, after adjusting the sociodemographic variables, also showed that the factors associated with depression were perceived stress and health status. This study reported for the first time that the point prevalence of depression screened using the PHQ- 9 in this nationwide survey of the Korean population was similar to that of the western countries. As the KNHANES to detect depression is conducted biennially, further studies on the accumulated data are expected in the future.
Keywords: Depression; Prevalence of Depression; PHQ-9; Korea National Health and Nutrition Examination Survey; General Population; Korea
Cheolmin Shin,1 Yoonjung Kim,2 Suyeon Park,2 Seoyoung Yoon,3 Young-Hoon Ko,1 Yong-Ku Kim,1 Seung-Hyun Kim,4 Sang Won Jeon,5 and Changsu Han1
1Department of Psychiatry, Korea University College of Medicine, Korea University Ansan Hospital, Ansan, Korea; 2Division of Health and Nutrition Survey, Centers for Disease Control and Prevention, Cheongju, Korea; 3Department of Psychiatry, Daegu Catholic University Medical Center, Daegu, Korea;
4Department of Psychiatry, Korea University College of Medicine, Korea University Guro Hospital, Seoul, Korea; 5Department of Psychiatry, Sungkyunkwan University School of Medicine, Seoul, Korea Received: 13 June 2017
Accepted: 29 July 2017 Address for Correspondence:
Changsu Han, MD, PhD, MHSc
Department of Psychiatry, Korea University College of Medicine, Korea University Ansan Hospital, 123 Jeokgeum-ro, Danwon-gu, Ansan 15355, Republic of Korea
E-mail: [email protected]
https://doi.org/10.3346/jkms.2017.32.11.1861 • J Korean Med Sci 2017; 32: 1861-1869
INTRODUCTION
Depressive disorder is a common mental illness and is consid- ered a leading cause of major health problems worldwide (1).
Depression results in an increase of the health-seeking behav- ior, decreased quality of life and high risk of suicidal tendencies (2). Nevertheless, patients with depressive disorder are often undertreated (3). An epidemiological study on depression may collect basic data to identify a mental health program that can classify the high-risk group and provide an appropriate treat- ment for the patients. Therefore, large-scale epidemiological studies on mental disorders have been conducted for decades (4-7). Studies using the Composite International Diagnostic In- terview (CIDI) to diagnose major depressive disorder (MDD) reported that the lifetime prevalence in the Western countries ranged from 12.8% to 16.2%, while the 1-year prevalence ranged from 3.9% to 6.6% (4,6). In Asian countries, the prevalence of depression was relatively lower than that of the western coun- tries (8). For instance, a Taiwanese nationwide survey estimat- ed that the lifetime prevalence of MDD using the CIDI was 1.2%,
while the 1-year prevalence was 0.6% (7).
Recently, several epidemiological studies have reported the prevalence of depressive symptoms in the Korean population.
In 1998, Cho et al. (9) reported the nationwide prevalence of depression in SouthKorea (hereafter referred to as “Korea”) by using the Center for Epidemiologic Studies Depression Scale, which is a self-reporting instrument. Since 2001, epidemiologi- cal surveys on mental disorders in Korea are conducted every 5 years, and reported a gradually increasing lifetime prevalence of MDD (2001, 4.0%; 2006, 5.6%; 2011, 6.7%) (10,11). These sur- veillances primarily investigate the prevalence of mental disor- ders, based on demographic and clinical data. Recently, the public health authority in Korea focused on mental health, par- ticularly depression, due to the high suicidal rate in the Organi- zation for Economic Cooperation and Development (OECD) member countries for years. The quinquennial surveillance program failed to meet the required observation and utilization of mental health data in a timely manner.
The Korea National Health and Nutrition Examination Sur- vey (KNHANES) is a cross-sectional, nationwide, and popula- ORIGINAL ARTICLE
Psychiatry & Psychology
2017-03-16 https://crossmark-cdn.crossref.org/widget/v2.0/logos/CROSSMARK_Color_square.svg
tion-based analysis that monitors the health and nutritional status of the Korean population. Prior to the 2014 KNHANES, only simple questions about depression/anxiety symptom (i.e., I am not anxious or depressed, I am somewhat anxious or de- pressed, I am very anxious or depressed) as part of the Europe- an Quality of Life-5 Dimensions, and feeling of sadness or hope- lessness as part of mental health were administered to detect symptoms of depression. However, a well-validated instrument to detect depression was assumed capable of deriving significant epidemiological information. The Patient Health Questionnaire (PHQ)-9 was introduced into the KNHANES to detect the prev- alence of depression in the general population of Korea.
This study aimed to determine the current prevalence of de- pression in Korea using an annual nationwide surveillance pro- gram. We also presented the associated factors of depression that were diagnosed using the PHQ-9.
MATERIALS AND METHODS Study population
The data used in this study was taken from the 2014 KNHANES, which used PHQ-9 for the first time as a screening instrument for depression. The KNHANES is a nationwide cross-sectional analysis that is conducted every year by the Korea Centers for Disease Control and Prevention. The target population is repre- sentative of the non-institutionalized civilians in Korea. The sam- pling plan follows a multi-stage clustered probability design. Each survey year includes a new sample of approximately 10,000 in- dividuals aged ≥ 1 year. Trained interviewers and medical tech- nicians conducted health interviews, health examinations, and nutritional surveys. The PHQ-9 was administered to adults aged
≥ 19 years by a trained interviewer.
Socio-demographic and health-related variables
We assessed the socio-demographic characteristics, health-re- lated behaviors, and diagnose of chronic diseases in adults aged
≥ 19 years via health interviews and examinations. The educa- tional level was categorized as ≤ 6 years, 7–12 years, and ≥ 13 years. The living arrangement was classified as living alone, with partner, and with other family members. The household income level was calculated by dividing the total household monthly income to the square root of the household size; the obtained levels then grouped into quartiles. The presence of chronic health conditions such as hypertension, diabetes, stroke, thyroid dis- ease, arthritis, and cancer was diagnosed by a medical doctor, which was dichotomized into present (at least one of six) and none. Health interviewers assessed the lifetime diagnosis and current treatment of depression. Perceived health status (very good, good/fair, poor, or very poor), perceived stress (very much, much/mild, or no), current cigarette smoker (yes/no), high-risk drinker (yes/no), and participating aerobic physical activity (yes/
no) were dichotomized. Current cigarette smoker was defined as adults who reportedly smoked at least 100 cigarettes in their lifetime and are currently smoking every day or occasionally.
High-risk drinker was defined as adults who had seven glasses (five for women) or more of alcohol per occasion for two or more times a week. Aerobic physical activity was measured using the Global Physical Activity Questionnaire, which considered the following criteria: participating in at least 150 minutes a week of moderate-intensity, 75 minutes a week of vigorous-intensity, or an equal combination of moderate- and vigorous-intensity aer- obic physical activity. Body mass index (BMI) was calculated as the body weight divided by the height squared, and categorized into underweight (< 18.5 kg/m2), normal (18.5–24.9 kg/m2), and obese (≥ 25.0 kg/m2).
PHQ-9
The PHQ-9 is a multipurpose instrument for screening, diag- nosing, monitoring, and measuring the severity of depression (12,13). The Korean version of PHQ-9 was administered in this survey that verified the validity and reliability of the largest study population of the community (14), and was translated from the original PHQ-9 with an authorized permission. The PHQ-9 con- tains nine symptom items that measure the frequency of depres- sive symptoms over the past 2 weeks. The response options for each item are “not at all,” “on several days,” “on more than half of the days,” and “nearly every day,” which are scored 0–3. The sum of the scores can range from 0–27, with the higher scores indicating more severe depression.
The PHQ-9 has two algorithms: one algorithm for depressive disorder diagnoses and another for grading the depressive symp- tom severity. The former algorithm based on the Diagnostic and Statistical Manual of Mental Disorder, Fourth Edition (DSM-IV) categorizes depressed respondents as either having a MDD or other types of depression. The latter algorithm categorizes re- spondents based on the severity of their depressive symptoms (none, 0; minimal, 1–4; mild, 5–9; moderate, 10–14; moderately severe, 15–19; or severe, 20–27) (12). Depression was classified as either major depression or other depression (using the PHQ- 9 diagnostic algorithm) or PHQ-9 scores of ≥ 10.
Prior to the introduction of the PHQ-9 to the health question- naire, a pilot survey was conducted on 537 participants from August 7, 2013 to September 13, 2013 (data not shown). The pur- pose is to gather the preliminary data to prove the efficiency of the PHQ-9 as part of the health questionnaire of KNHANES.
The experts from the mental health or senior advisory commit- tee discussed several relevant issues. First, a face-to-face inter- view method was used to administer the PHQ-9. The PHQ-9 was developed as a self-administered module; however, an in- terviewer (with minimal support) to clearly explain the purpose of the questionnaires administered the pilot survey. Second, in the United States, the Behavioral Risk Factor Surveillance Sys-
tem (BRFSS) used the PHQ-8, which omitted the ninth item re- garding suicidal or self-injurious thoughts because administra- tors might not have been able to offer appropriate follow-up in- terventions. Moreover, some studies in the Western countries reported that the ninth question had a minor effect on the scor- ing of the PHQ-9 because suicidal thoughts are relatively rare in the general population, and the PHQ-8 almost has the same cutoff point for depression as the PHQ-9 (15,16). However, ow- ing to the high prevalence of suicide in Korea, suicidal thought measurement in the general population was deemed both nec- essary and significant. In Korea, reports on the minor effects of the ninth question of the PHQ-9 on the scoring system did not exist. Therefore, the PHQ-9 was selected, instead of the PHQ-8, to investigate depression in this pilot study.
In 2014, a primary survey for depression was conducted as part of the KNHANES. The matters discussed in the pilot survey were reflected. Although the ninth PHQ-9 question was includ- ed in this surveillance system, it was not possible to provide in- tervention exclusively to all respondents who answered the ninth question with “several days” or more. Therefore, a leaflet was distributed providing information on how to cope with depres- sion and how to contact a consultant or professional mental health institution.
Statistical analysis
All statistical analyses were performed using the SAS PROC SUR- VEY procedure (SAS version 9.4; SAS Institute Inc., Cary, NC, USA). To represent the Korean population, the sampling wei- ghts assigned to participants were applied to all analyses and were generated by considering the complex sample design, non- response rate of the target population, and post-stratification.
Data were presented as weighted percentage, unweighted fre- quency, and 95% confidence interval (CI) for categorical vari- ables. The Rao-Scott χ2 test was used to evaluate the differences of baseline characteristics based on gender for categorical vari- ables. A single logistic regression analysis was used to identify the association between gender, age, educational level, living arrangement, household income, presence of chronic disease, lifetime diagnosis of depression, perceived health status, per- ceived stress, smoking, high-risk drinking, and BMI, respective- ly with depression. A multiple logistic regression analysis was used to determine the associated factors of depression after ad- justing for gender, age, educational level, living arrangement, and household income. A probability value of P < 0.05 was con- sidered statistically significant.
Ethics statement
The present study protocol was reviewed and approved by the Institutional Review Board of Korea Centers for Disease Control and Prevention (No. 2013-12EXP-03-5C). Informed consent was submitted by all subjects when they were enrolled.
RESULTS
Participants’ characteristics
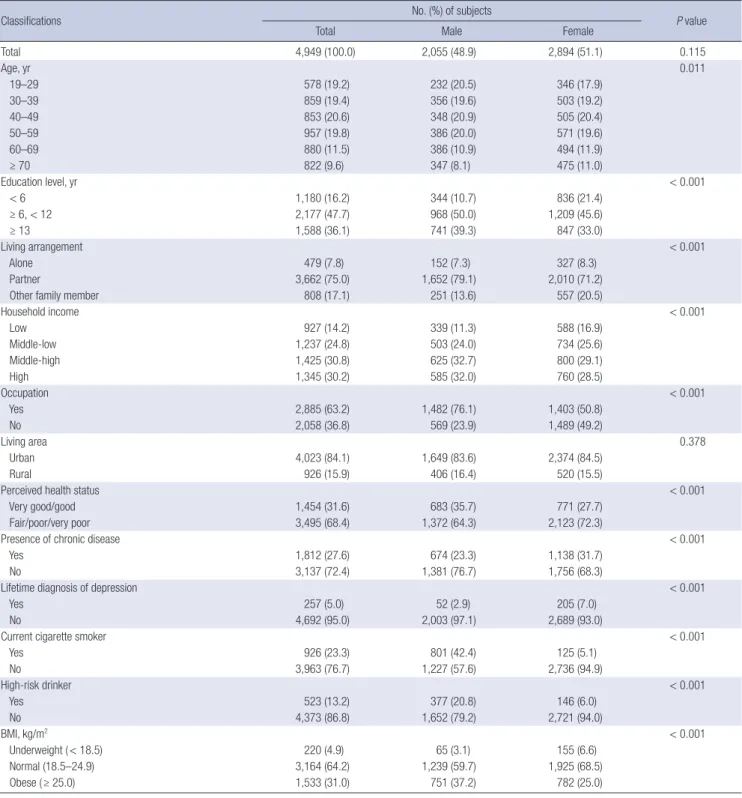
Of the 5,976 participants aged ≥ 19 years, 1,027 did not com- plete the PHQ-9 were excluded; thus, only 4,949 subjects were finally included in the analyses. The socio-demographic char- acteristics of the participants are presented in Table 1. The mean age was 42.6 years (range, 19–95 years). The participants were 51.1% women and 43.9% men. Majority of the participants lived with a spouse (75.0%) and in urban areas (84.1%).
Prevalence of depression
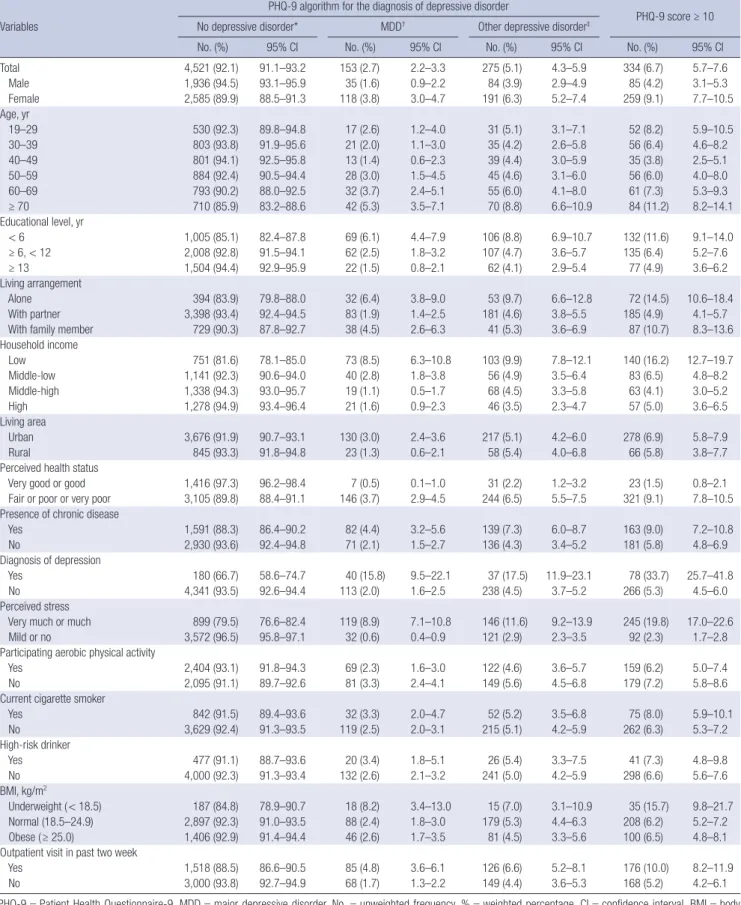
The prevalence of depression was 6.7% (95% CI, 5.7%–7.6%) (Table 2). Approximately 4.2% (95% CI, 3.1%–5.3%) of men and 9.1% (95% CI, 7.7%–10.5%) of women had depression. Based on age, adults aged ≥ 70 years had the highest prevalence of 11.2%, followed by 8.2% in adults aged 19–29 years. The results revealed that depression was more prevalent in participants who lived alone (14.5%), compared to those who lived with their spou- ses (4.9%) or other family members (10.7%). The lowest house- hold income group had the highest prevalence of depression (16.2%), while the middle-low, middle-high, and highest groups had the prevalence of 6.5%, 4.1%, and 5.0%, respectively.
A higher prevalence of depression was observed in respon- dents with a history of one or more diagnoses for chronic dis- ease than in those without (9.0% vs. 5.8%).
The prevalence of major and other depressive disorders us- ing the PHQ-9 algorithm were 2.7% (95% CI, 2.2%–3.3%) and 5.1% (95% CI, 4.3%–5.9%), respectively.
The rate of seeking doctors for depression
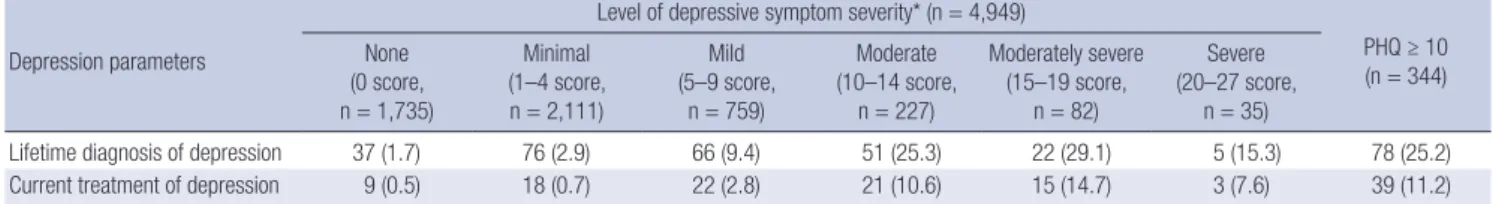
Among the participants with a PHQ score of ≥ 10, 25.2% had already been diagnosed and 11.2% were currently being treated for depression (Table 3). The rates of adults who are currently receiving treatment for depression were 10.6%, 14.7%, and 7.6%
for the moderate (PHQ score, 10–14), moderately severe (PHQ score, 15–19), and severe groups (PHQ score, ≥ 20), respectively.
Factors associated with depression
The univariate and multivariate logistic regression analyses re- vealed several factors associated with depression (Table 4). So- cio-demographic factors, such as women (odds ratio [OR], 2.28), old age (aged 40–59; OR, 0.65), group educated ≤ 6 years (OR, 2.52), living alone or with other family members apart from spou- ses (OR, 2.65), and low or middle-low household income (OR, 2.33), were associated with an increased risk for depression. In the multivariate regression model adjusted for socio-demogra- phic factors, smoking, high-risk drinking, and presence of chro- nic diseases were not associated with depression. However, in the same model, lifetime diagnosis of depression (adjusted odds ratio [aOR], 5.71), perceived health status (aOR, 3.83), perceived
stress (aOR, 9.77), and underweight (aOR, 1.99) were significant- ly associated with depression.
DISCUSSION
This is the first study to determine the point prevalence of de- pression and associated factors using the PHQ-9 in the general
population of Korea. The point prevalence of depression of Ko- rean adults was 6.7%. The prevalence rate of depression was rel- atively high in women, group who lived alone, lowest quartile of household income, and the poorly educated group. The sig- nificantly associated factors with depression after adjusting the socio-demographic variables were lifetime diagnosis of depres- sion, underweight, perceived stress, and perceived health status.
Table 1. Sociodemographic characteristics and health status of the study population
Classifications No. (%) of subjects
P value
Total Male Female
Total 4,949 (100.0) 2,055 (48.9) 2,894 (51.1) 0.115
Age, yr 0.011
19–29 578 (19.2) 232 (20.5) 346 (17.9)
30–39 859 (19.4) 356 (19.6) 503 (19.2)
40–49 853 (20.6) 348 (20.9) 505 (20.4)
50–59 957 (19.8) 386 (20.0) 571 (19.6)
60–69 880 (11.5) 386 (10.9) 494 (11.9)
≥ 70 822 (9.6) 347 (8.1) 475 (11.0)
Education level, yr < 0.001
< 6 1,180 (16.2) 344 (10.7) 836 (21.4)
≥ 6, < 12 2,177 (47.7) 968 (50.0) 1,209 (45.6)
≥ 13 1,588 (36.1) 741 (39.3) 847 (33.0)
Living arrangement < 0.001
Alone 479 (7.8) 152 (7.3) 327 (8.3)
Partner 3,662 (75.0) 1,652 (79.1) 2,010 (71.2)
Other family member 808 (17.1) 251 (13.6) 557 (20.5)
Household income < 0.001
Low 927 (14.2) 339 (11.3) 588 (16.9)
Middle-low 1,237 (24.8) 503 (24.0) 734 (25.6)
Middle-high 1,425 (30.8) 625 (32.7) 800 (29.1)
High 1,345 (30.2) 585 (32.0) 760 (28.5)
Occupation < 0.001
Yes 2,885 (63.2) 1,482 (76.1) 1,403 (50.8)
No 2,058 (36.8) 569 (23.9) 1,489 (49.2)
Living area 0.378
Urban 4,023 (84.1) 1,649 (83.6) 2,374 (84.5)
Rural 926 (15.9) 406 (16.4) 520 (15.5)
Perceived health status < 0.001
Very good/good 1,454 (31.6) 683 (35.7) 771 (27.7)
Fair/poor/very poor 3,495 (68.4) 1,372 (64.3) 2,123 (72.3)
Presence of chronic disease < 0.001
Yes 1,812 (27.6) 674 (23.3) 1,138 (31.7)
No 3,137 (72.4) 1,381 (76.7) 1,756 (68.3)
Lifetime diagnosis of depression < 0.001
Yes 257 (5.0) 52 (2.9) 205 (7.0)
No 4,692 (95.0) 2,003 (97.1) 2,689 (93.0)
Current cigarette smoker < 0.001
Yes 926 (23.3) 801 (42.4) 125 (5.1)
No 3,963 (76.7) 1,227 (57.6) 2,736 (94.9)
High-risk drinker < 0.001
Yes 523 (13.2) 377 (20.8) 146 (6.0)
No 4,373 (86.8) 1,652 (79.2) 2,721 (94.0)
BMI, kg/m2 < 0.001
Underweight ( < 18.5) 220 (4.9) 65 (3.1) 155 (6.6)
Normal (18.5–24.9) 3,164 (64.2) 1,239 (59.7) 1,925 (68.5)
Obese ( ≥ 25.0) 1,533 (31.0) 751 (37.2) 782 (25.0)
Values are presented as unweighted frequency (weighted percentage).
BMI = body mass index.
Table 2. Prevalence of depression Variables
PHQ-9 algorithm for the diagnosis of depressive disorder
PHQ-9 score ≥ 10 No depressive disorder* MDD† Other depressive disorder‡
No. (%) 95% CI No. (%) 95% CI No. (%) 95% CI No. (%) 95% CI
Total 4,521 (92.1) 91.1–93.2 153 (2.7) 2.2–3.3 275 (5.1) 4.3–5.9 334 (6.7) 5.7–7.6
Male 1,936 (94.5) 93.1–95.9 35 (1.6) 0.9–2.2 84 (3.9) 2.9–4.9 85 (4.2) 3.1–5.3
Female 2,585 (89.9) 88.5–91.3 118 (3.8) 3.0–4.7 191 (6.3) 5.2–7.4 259 (9.1) 7.7–10.5
Age, yr
19–29 530 (92.3) 89.8–94.8 17 (2.6) 1.2–4.0 31 (5.1) 3.1–7.1 52 (8.2) 5.9–10.5
30–39 803 (93.8) 91.9–95.6 21 (2.0) 1.1–3.0 35 (4.2) 2.6–5.8 56 (6.4) 4.6–8.2
40–49 801 (94.1) 92.5–95.8 13 (1.4) 0.6–2.3 39 (4.4) 3.0–5.9 35 (3.8) 2.5–5.1
50–59 884 (92.4) 90.5–94.4 28 (3.0) 1.5–4.5 45 (4.6) 3.1–6.0 56 (6.0) 4.0–8.0
60–69 793 (90.2) 88.0–92.5 32 (3.7) 2.4–5.1 55 (6.0) 4.1–8.0 61 (7.3) 5.3–9.3
≥ 70 710 (85.9) 83.2–88.6 42 (5.3) 3.5–7.1 70 (8.8) 6.6–10.9 84 (11.2) 8.2–14.1
Educational level, yr
< 6 1,005 (85.1) 82.4–87.8 69 (6.1) 4.4–7.9 106 (8.8) 6.9–10.7 132 (11.6) 9.1–14.0
≥ 6, < 12 2,008 (92.8) 91.5–94.1 62 (2.5) 1.8–3.2 107 (4.7) 3.6–5.7 135 (6.4) 5.2–7.6
≥ 13 1,504 (94.4) 92.9–95.9 22 (1.5) 0.8–2.1 62 (4.1) 2.9–5.4 77 (4.9) 3.6–6.2
Living arrangement
Alone 394 (83.9) 79.8–88.0 32 (6.4) 3.8–9.0 53 (9.7) 6.6–12.8 72 (14.5) 10.6–18.4
With partner 3,398 (93.4) 92.4–94.5 83 (1.9) 1.4–2.5 181 (4.6) 3.8–5.5 185 (4.9) 4.1–5.7
With family member 729 (90.3) 87.8–92.7 38 (4.5) 2.6–6.3 41 (5.3) 3.6–6.9 87 (10.7) 8.3–13.6
Household income
Low 751 (81.6) 78.1–85.0 73 (8.5) 6.3–10.8 103 (9.9) 7.8–12.1 140 (16.2) 12.7–19.7
Middle-low 1,141 (92.3) 90.6–94.0 40 (2.8) 1.8–3.8 56 (4.9) 3.5–6.4 83 (6.5) 4.8–8.2
Middle-high 1,338 (94.3) 93.0–95.7 19 (1.1) 0.5–1.7 68 (4.5) 3.3–5.8 63 (4.1) 3.0–5.2
High 1,278 (94.9) 93.4–96.4 21 (1.6) 0.9–2.3 46 (3.5) 2.3–4.7 57 (5.0) 3.6–6.5
Living area
Urban 3,676 (91.9) 90.7–93.1 130 (3.0) 2.4–3.6 217 (5.1) 4.2–6.0 278 (6.9) 5.8–7.9
Rural 845 (93.3) 91.8–94.8 23 (1.3) 0.6–2.1 58 (5.4) 4.0–6.8 66 (5.8) 3.8–7.7
Perceived health status
Very good or good 1,416 (97.3) 96.2–98.4 7 (0.5) 0.1–1.0 31 (2.2) 1.2–3.2 23 (1.5) 0.8–2.1
Fair or poor or very poor 3,105 (89.8) 88.4–91.1 146 (3.7) 2.9–4.5 244 (6.5) 5.5–7.5 321 (9.1) 7.8–10.5 Presence of chronic disease
Yes 1,591 (88.3) 86.4–90.2 82 (4.4) 3.2–5.6 139 (7.3) 6.0–8.7 163 (9.0) 7.2–10.8
No 2,930 (93.6) 92.4–94.8 71 (2.1) 1.5–2.7 136 (4.3) 3.4–5.2 181 (5.8) 4.8–6.9
Diagnosis of depression
Yes 180 (66.7) 58.6–74.7 40 (15.8) 9.5–22.1 37 (17.5) 11.9–23.1 78 (33.7) 25.7–41.8
No 4,341 (93.5) 92.6–94.4 113 (2.0) 1.6–2.5 238 (4.5) 3.7–5.2 266 (5.3) 4.5–6.0
Perceived stress
Very much or much 899 (79.5) 76.6–82.4 119 (8.9) 7.1–10.8 146 (11.6) 9.2–13.9 245 (19.8) 17.0–22.6
Mild or no 3,572 (96.5) 95.8–97.1 32 (0.6) 0.4–0.9 121 (2.9) 2.3–3.5 92 (2.3) 1.7–2.8
Participating aerobic physical activity
Yes 2,404 (93.1) 91.8–94.3 69 (2.3) 1.6–3.0 122 (4.6) 3.6–5.7 159 (6.2) 5.0–7.4
No 2,095 (91.1) 89.7–92.6 81 (3.3) 2.4–4.1 149 (5.6) 4.5–6.8 179 (7.2) 5.8–8.6
Current cigarette smoker
Yes 842 (91.5) 89.4–93.6 32 (3.3) 2.0–4.7 52 (5.2) 3.5–6.8 75 (8.0) 5.9–10.1
No 3,629 (92.4) 91.3–93.5 119 (2.5) 2.0–3.1 215 (5.1) 4.2–5.9 262 (6.3) 5.3–7.2
High-risk drinker
Yes 477 (91.1) 88.7–93.6 20 (3.4) 1.8–5.1 26 (5.4) 3.3–7.5 41 (7.3) 4.8–9.8
No 4,000 (92.3) 91.3–93.4 132 (2.6) 2.1–3.2 241 (5.0) 4.2–5.9 298 (6.6) 5.6–7.6
BMI, kg/m2
Underweight ( < 18.5) 187 (84.8) 78.9–90.7 18 (8.2) 3.4–13.0 15 (7.0) 3.1–10.9 35 (15.7) 9.8–21.7
Normal (18.5–24.9) 2,897 (92.3) 91.0–93.5 88 (2.4) 1.8–3.0 179 (5.3) 4.4–6.3 208 (6.2) 5.2–7.2
Obese ( ≥ 25.0) 1,406 (92.9) 91.4–94.4 46 (2.6) 1.7–3.5 81 (4.5) 3.3–5.6 100 (6.5) 4.8–8.1
Outpatient visit in past two week
Yes 1,518 (88.5) 86.6–90.5 85 (4.8) 3.6–6.1 126 (6.6) 5.2–8.1 176 (10.0) 8.2–11.9
No 3,000 (93.8) 92.7–94.9 68 (1.7) 1.3–2.2 149 (4.4) 3.6–5.3 168 (5.2) 4.2–6.1
PHQ-9 = Patient Health Questionnaire-9, MDD = major depressive disorder, No. = unweighted frequency, % = weighted percentage, CI = confidence interval, BMI = body mass index.
*No depressive disorder was defined as not major and other of depressive disorder. †MDD: if question 1 or question 2 and five or more of question 1–9 are at least “more than half the days” (count question 9 if present at all). ‡Other depressive disorder: if question 1 or question 2 and two, three, four of question 1–9 are at least “more than half the days” (count question 9 if present at all).
Table 3. Lifetime diagnosis and current treatment of depression based on the level of depressive symptom severity
Depression parameters
Level of depressive symptom severity* (n = 4,949)
PHQ ≥ 10 (n = 344) None
(0 score, n = 1,735)
Minimal (1–4 score, n = 2,111)
Mild (5–9 score,
n = 759)
Moderate (10–14 score,
n = 227)
Moderately severe (15–19 score,
n = 82)
Severe (20–27 score,
n = 35)
Lifetime diagnosis of depression 37 (1.7) 76 (2.9) 66 (9.4) 51 (25.3) 22 (29.1) 5 (15.3) 78 (25.2)
Current treatment of depression 9 (0.5) 18 (0.7) 22 (2.8) 21 (10.6) 15 (14.7) 3 (7.6) 39 (11.2)
Values are presented as unweighted frequency (weighted percentage).
PHQ = Patient Health Questionnaire.
*Depressive symptom severity was categorized by Kroenke et al. (12).
Table 4. Factors associated with depression Classifications
Single logistic
regression Multiple logistic regression
OR 95% CI aOR* 95% CI
Gender
Male 1.00 - - -
Female 2.28 1.70–3.05† - -
Age, yr - -
19–39 1.00 - - -
40–59 0.65 0.47–0.91‡ - -
≥ 60 1.26 0.95–1.68 - -
Education level, yr - -
< 6 2.52 1.77–3.59† - -
≥ 6, < 12 1.32 0.95–1.83 - -
≥ 13 1.00 -
Living arrangement - -
Partner 1.00 - - -
Alone or other family member 2.65 2.02–3.48† - -
Household income - -
Low or middle-low 2.33 1.76–3.09† - -
Middle-high or high 1.00 - - -
Presence of chronic disease
Yes 1.60 1.21–2.11† 1.22 0.78–1.90
No 1.00 - 1.00 -
Lifetime diagnosis of depression
Yes 9.15 6.31–13.26† 5.71 3.64–8.97†
No 1.00 - 1.00 -
Perceived health status
Fair or poor or very poor 6.69 4.08–10.98† 3.83 2.28–6.45†
Very good or good 1.00 - 1.00 -
Perceived stress
Very much or much 10.63 8.02–14.09† 9.77 7.26–13.15†
Mild or no 1.00 - 1.00
Current cigarette smoker
Yes 1.30 0.97–1.76 1.45 0.92–2.27
No 1.00 - 1.00 -
High-risk drinker
Yes 1.12 0.75–1.66 1.32 0.81–2.13
No 1.00 - 1.00 -
BMI, kg/m2
Underweight ( < 18.5) 2.84 1.80–4.49† 1.99 1.08–3.66‡
Normal (18.5–24.9) 1.00 - 1.00 -
Obese ( ≥ 25.0) 1.06 0.78–1.43 0.97 0.69–1.37
OR = odds ratio, CI = confidence interval, aOR = adjusted odds ratio, BMI = body mass index.
*Adjusted for gender, age (categorical), educational level, living arrangement, and house- hold income; †P < 0.001; ‡P < 0.05.
This study showed that the point prevalence investigated us- ing the PHQ-9 was similar to the results from the United States or Germany. The US National Health and Nutrition Examination Survey (measured using the PHQ-9) that collected data from 2005 to 2008 reported a 6.8% prevalence of depression among the US adults (17). The 2006 and 2008 BRFSS (measured using the PHQ-8) findings showed 8.7% and 8.2% prevalence of de- pression, respectively (18). In Germany, the national represen- tative household surveys conducted in 2003 and 2008 (n = 5,018) reported a 5.6% prevalence rate of moderate-to-high depressive symptom severity (German version of PHQ-9 score, ≥ 10) (19).
In this survey, the prevalence of mild depressive symptom (PHQ- 9 score, 5–9) was 18.1%. Maske et al. (20) reported a study based on the data of two nationwide surveys, which are cross-section- al data of the mental health module of the German Health In- terview and Examination Survey for Adults (data collection:
2009–2012). This study collected the data from 4,483 communi- ty-dwelling German residents, aged 18–79 years, using the di- agnostic algorithm of the PHQ-9, and reported that the preva- lence of current major depressive symptom was 2.7%, which is similar to the results of our study (2.7%). In Asian countries, the PHQ-9 was also used to determine the prevalence of depressive symptoms in the general population. To standardize the PHQ- 9, Wang et al. (21) administered it to 1,115 community-dwelling residents aged > 16 years in Shanghai. This study proposed the cutoff score of depression with an optimal sensitivity and speci- ficity of seven. The prevalence of depression was 16.3% and 7.0%
with the cutoff score of 7 and 10, respectively. Based on the data from 6,028 participants who were recruited from the households in Hong Kong, Yu et al. (22) presented a 1.7% prevalence of MDD that was diagnosed using the PHQ-9 algorithm. They reported that the prevalence of mild depressive (PHQ score, 5–9) and moderate-to-severe depressive symptoms (PHQ score, ≥ 10) were 13.7% and 4.3%, respectively. In 2012, an epidemiological study conducted by the Department of Statistics in Malaysia re- vealed a depression prevalence of 10.3% in a community in Se- langor, Malaysia (23). Although this study did not represent all parts of Malaysia, it was performed on the general population to investigate the prevalence of depression and 593 participants were diagnosed with depression using the Malaysian version of PHQ-9 cutoff point of ≥ 10.
With regard to the socio-demographic and health-related factors, risk factors associated with depression were middle age, women, low household income, and low educational level. Our results were similar to those of previous studies on Korean co- horts that reported that young or old age, low educational level, divorce or separation, being unmarried, chronic disease, and smoking were risk factors for depression (9,11). However, in our study, only the middle-aged group demonstrated significantly reduced risk of depression, whereas the previous studies report- ed increased risk of depression in their younger or old aged co- horts. Also, after adjustment for socio-demographic, presence of chronic disease did not significantly increase the risk of de- pression in our study. In general, chronic diseases are consis- tently found in epidemiological studies that are associated with depression (24). This result may be due to the inclusion of dis- eases that are not morbid enough to be categorized as chronic diseases.
Perceived health status and stress more likely increase the risk of depression. Self-rated health was known to significantly elevate the prevalence of depression in previous Korean studies (25), and is strongly correlated with studies of elderly adults in other countries (26,27). Perceived stress was strongly associated with depression in this study that was consistent with the results of previous studies (28). However, the limitation of this study was that perceived stress was not measured using a validated scale such as the Perceived Stress Scale.
BMI is known to have a U-shaped correlation with the risk of depression (29). Assessment of the correlation between BMI and depression in Korean studies have been consistently report- ed that higher risk of depression in underweight individuals than their normal body weight counterparts (25,30). Similarly, this study showed that the risk of depression increased in un- derweight individuals, but not in individuals who were obese.
We assessed depression with PHQ-9 to find which of the algo- rithm scoring method and summed item scoring method would be more efficient to screen depression. Our results showed that the prevalence of major depression (2.7%), diagnosed using the algorithm scoring method, was lower than that of the summed item scoring method (6.7%). A recent meta-analysis reported that the summed-item scoring method of the PHQ-9 has a bet- ter diagnostic performance than the algorithm scoring method (31). In particular, the algorithm scoring method showed low sen- sitivity, and the cutoff point of ≥ 10 of the summed item scoring method could be more affordable in demonstrating the preva- lence. This is in line with our results. Therefore, the summed item scoring method may be more affordable to use the PHQ-9 as a surveillance tool for depression in general population of Korea.
Our results revealed that individuals who had a PHQ-9 score of ≥ 10 needed low medical support for depression. Only 11.2%
of the individuals (PHQ score, ≥ 10) answered that they were receiving treatment for depression. Similar to western countries
(32), depression in Korea was also underdiagnosed and under- treated. Regarding the 2011 epidemiological survey of mental disorders among Korean adults, only 20.7% of mood disorder patients have visited a psychiatrist more than once. Ohayon and Hong (25) reported that only 7.4% of patients with MDD take their prescribed antidepressants. The Korean government and healthcare providers conducted campaigns and implement- ed policies in a nationwide effort to improve the treatment of depression, a strategy that was shown to be successful in other countries (33,34). KNHANES with the PHQ-9 was expected to attribute the surveillance program to the policy outcome and prevalence of depression.
The most frequently responded item in the PHQ-9 was “fa- tigue.” The second most frequently responded question was item number three (“Trouble falling or staying asleep, or sleep- ing too much?”). Approximately 7.2% of the respondents rated more than one point to the ninth item of the PHQ-9 (data not shown) that was somewhat higher when compared to other studies in general population. This result may be a reflection of the high suicidal rate in Korea. The response to the ninth item of the PHQ-9 can be an indication of the increased risk of sui- cidal attempt in the outpatient setting (35). Further study is deem- ed necessary with regard to the importance of the response to the ninth item in the general population.
Our study had several limitations. First, the cutoff point of PHQ-9 for depression was not validated in the general popula- tion of Korea via the gold standard of diagnosis (14). However, it was widely used in the primary care setting of the psychiatric field (36). Several studies have proven its validity as a screening tool in the general population (19,37). A PHQ-9 score of ≥ 10 was proven to have sensitivity (88%) and specificity (88%) of depressive symptoms among the general populations in vari- ous ethnic groups (12). A recent meta-analysis, including 36 studies (21,292 patients), reported that the pooled sensitivity for the 10 cutoff point was 0.78 and the pooled specificity was 0.87 in various settings (38). Although the 10 cutoff point is well-es- tablished in several ethnic groups (22,39,40), further validation studies in the general population of Korea are deemed neces- sary. Second, as KNHANES did not include institutionalized in- dividuals, hence individuals with severe depression could have been excluded from this survey.
These nationally representative data provide useful epidemi- ological information on depression in Korea, including overall prevalence, prevalence according to socio-demographic fac- tors, factors associated with depression, and treatment rate of depression. The results of this study may serve as a basis for de- veloping an effective nationwide program to manage depres- sion. PHQ-9 will be used in Korea as an instrument of nation- wide surveillance for depression every 2 years. In the future, we expect a meaningful follow-up study with accumulated data of PHQ-9.
DISCLOSURE
The authors have no potential conflicts of interest to disclose.
AUTHOR CONTRIBUTION
Conceptualization: Han CS, Yoon SY, Shin CM. Data curation:
Shin CM, Jeon SW. Formal analysis: Shin CM, Park SY. Investi- gation: Shin CM, Ko YH, Kim YJ. Writing - original draft: Shin CM, Kim YJ. Writing - review & drafting: Kim YK, Kim SH.
ORCID
Cheolmin Shin https://orcid.org/0000-0002-8232-2921 Yoonjung Kim https://orcid.org/0000-0002-8418-0074 Suyeon Park https://orcid.org/0000-0001-8134-8436 Seoyoung Yoon https://orcid.org/0000-0003-1845-7722 Young-Hoon Ko https://orcid.org/0000-0002-5352-2158 Yong-Ku Kim https://orcid.org/0000-0001-5694-7840 Seung-Hyun Kim https://orcid.org/0000-0002-2189-4600 Sang Won Jeon https://orcid.org/0000-0002-7828-3296 Changsu Han https://orcid.org/0000-0002-4021-8907
REFERENCES
1. Ferrari AJ, Charlson FJ, Norman RE, Patten SB, Freedman G, Murray CJ, Vos T, Whiteford HA. Burden of depressive disorders by country, sex, age, and year: findings from the global burden of disease study 2010. PLoS Med 2013; 10: e1001547.
2. Maynard CK. Differentiate depression from dementia. Nurse Pract 2003;
28: 18-9.
3. Hirschfeld RM, Keller MB, Panico S, Arons BS, Barlow D, Davidoff F, Endi- cott J, Froom J, Goldstein M, Gorman JM, et al. The National Depressive and Manic-Depressive Association consensus statement on the under- treatment of depression. JAMA 1997; 277: 333-40.
4. Alonso J, Angermeyer MC, Bernert S, Bruffaerts R, Brugha TS, Bryson H, de Girolamo G, Graaf R, Demyttenaere K, Gasquet I, et al. Prevalence of mental disorders in Europe: results from the European Study of the Epi- demiology of Mental Disorders (ESEMeD) project. Acta Psychiatr Scand Suppl 2004: 21-7.
5. Kessler RC, Berglund P, Demler O, Jin R, Koretz D, Merikangas KR, Rush AJ, Walters EE, Wang PS; National Comorbidity Survey Replication. The epidemiology of major depressive disorder: results from the National Co- morbidity Survey Replication (NCS-R). JAMA 2003; 289: 3095-105.
6. Henderson S, Andrews G, Hall W. Australia’s mental health: an overview of the general population survey. Aust N Z J Psychiatry 2000; 34: 197-205.
7. Liao SC, Chen WJ, Lee MB, Lung FW, Lai TJ, Liu CY, Lin CY, Yang MJ, Chen CC. Low prevalence of major depressive disorder in Taiwanese adults:
possible explanations and implications. Psychol Med 2012; 42: 1227-37.
8. Chiu E. Epidemiology of depression in the Asia Pacific region. Australas Psychiatry 2004; 12 Suppl: S4-10.
9. Cho MJ, Nam JJ, Suh GH. Prevalence of symptoms of depression in a na- tionwide sample of Korean adults. Psychiatry Res 1998; 81: 341-52.
10. Cho MJ, Lee JY. Epidemiology of depressive disorders in Korea. Psychia- try Investig 2005; 2: 22-7.
11. Cho MJ, Seong SJ, Park JE, Chung IW, Lee YM, Bae A, Ahn JH, Lee DW, Bae JN, Cho SJ, et al. Prevalence and correlates of DSM-IV mental disor- ders in South Korean adults: the Korean epidemiologic catchment area study 2011. Psychiatry Investig 2015; 12: 164-70.
12. Kroenke K, Spitzer RL, Williams JB. The PHQ-9: validity of a brief depres- sion severity measure. J Gen Intern Med 2001; 16: 606-13.
13. Löwe B, Unützer J, Callahan CM, Perkins AJ, Kroenke K. Monitoring de- pression treatment outcomes with the patient health questionnaire-9. Med Care 2004; 42: 1194-201.
14. Han C, Jo SA, Kwak JH, Pae CU, Steffens D, Jo I, Park MH. Validation of the Patient Health Questionnaire-9 Korean version in the elderly population:
the Ansan Geriatric study. Compr Psychiatry 2008; 49: 218-23.
15. Kroenke K, Spitzer RL. The PHQ-9: a new depression diagnostic and se- verity measure. Psychiatr Ann 2002; 32: 509-15.
16. Rief W, Nanke A, Klaiberg A, Braehler E. Base rates for panic and depres- sion according to the Brief Patient Health Questionnaire: a population- based study. J Affect Disord 2004; 82: 271-6.
17. Reeves WC, Strine TW, Pratt LA, Thompson W, Ahluwalia I, Dhingra SS, McKnight-Eily LR, Harrison L, D’Angelo DV, Williams L, et al. Mental ill- ness surveillance among adults in the United States. MMWR Suppl 2011;
60: 1-29.
18. Strine TW, Kroenke K, Dhingra S, Balluz LS, Gonzalez O, Berry JT, Mok- dad AH. The associations between depression, health-related quality of life, social support, life satisfaction, and disability in community-dwelling US adults. J Nerv Ment Dis 2009; 197: 61-4.
19. Kocalevent RD, Hinz A, Brähler E. Standardization of the depression screen- er patient health questionnaire (PHQ-9) in the general population. Gen Hosp Psychiatry 2013; 35: 551-5.
20. Maske UE, Busch MA, Jacobi F, Beesdo-Baum K, Seiffert I, Wittchen HU, Riedel-Heller S, Hapke U. Current major depressive syndrome measured with the Patient Health Questionnaire-9 (PHQ-9) and the Composite In- ternational Diagnostic Interview (CIDI): results from a cross-sectional population-based study of adults in Germany. BMC Psychiatry 2015; 15:
77.
21. Wang W, Bian Q, Zhao Y, Li X, Wang W, Du J, Zhang G, Zhou Q, Zhao M.
Reliability and validity of the Chinese version of the Patient Health Ques- tionnaire (PHQ-9) in the general population. Gen Hosp Psychiatry 2014;
36: 539-44.
22. Yu X, Tam WW, Wong PT, Lam TH, Stewart SM. The Patient Health Ques- tionnaire-9 for measuring depressive symptoms among the general pop- ulation in Hong Kong. Compr Psychiatry 2012; 53: 95-102.
23. Kader Maideen SF, Sidik SM, Rampal L, Mukhtar F. Prevalence, associat- ed factors and predictors of depression among adults in the community of Selangor, Malaysia. PLoS One 2014; 9: e95395.
24. Moussavi S, Chatterji S, Verdes E, Tandon A, Patel V, Ustun B. Depression, chronic diseases, and decrements in health: results from the World Health Surveys. Lancet 2007; 370: 851-8.
25. Ohayon MM, Hong SC. Prevalence of major depressive disorder in the general population of South Korea. J Psychiatr Res 2006; 40: 30-6.
26. Yen IH, Kaplan GA. Poverty area residence and changes in depression and perceived health status: evidence from the Alameda County Study.
Int J Epidemiol 1999; 28: 90-4.
27. Beekman AT, Deeg DJ, van Tilburg T, Smit JH, Hooijer C, van Tilburg W.
Major and minor depression in later life: a study of prevalence and risk factors. J Affect Disord 1995; 36: 65-75.
28. Bergdahl J, Bergdahl M. Perceived stress in adults: prevalence and associ- ation of depression, anxiety and medication in a Swedish population. Stress Health 2002; 18: 235-41.
29. de Wit LM, van Straten A, van Herten M, Penninx BW, Cuijpers P. Depres- sion and body mass index, a u-shaped association. BMC Public Health 2009; 9: 14.
30. Kim JY, Chang HM, Cho JJ, Yoo SH, Kim SY. Relationship between obesity and depression in the Korean working population. J Korean Med Sci 2010;
25: 1560-7.
31. Manea L, Gilbody S, McMillan D. A diagnostic meta-analysis of the Patient Health Questionnaire-9 (PHQ-9) algorithm scoring method as a screen for depression. Gen Hosp Psychiatry 2015; 37: 67-75.
32. Simon GE, Fleck M, Lucas R, Bushnell DM; LIDO Group. Prevalence and predictors of depression treatment in an international primary care study.
Am J Psychiatry 2004; 161: 1626-34.
33. Angermeyer MC, Matschinger H. Public attitudes to people with depres- sion: have there been any changes over the last decade? J Affect Disord 2004; 83: 177-82.
34. Makowski AC, Mnich EE, Ludwig J, Daubmann A, Bock T, Lambert M, Härter M, Dirmaier J, Tlach L, Liebherz S, et al. Changes in beliefs and at- titudes toward people with depression and schizophrenia - results of a
public campaign in Germany. Psychiatry Res 2016; 237: 271-8.
35. Simon GE, Rutter CM, Peterson D, Oliver M, Whiteside U, Operskalski B, Ludman EJ. Does response on the PHQ-9 Depression Questionnaire pre- dict subsequent suicide attempt or suicide death? Psychiatr Serv 2013;
64: 1195-202.
36. Pinto-Meza A, Serrano-Blanco A, Peñarrubia MT, Blanco E, Haro JM. As- sessing depression in primary care with the PHQ-9: can it be carried out over the telephone? J Gen Intern Med 2005; 20: 738-42.
37. Martin A, Rief W, Klaiberg A, Braehler E. Validity of the Brief Patient Health Questionnaire Mood Scale (PHQ-9) in the general population. Gen Hosp Psychiatry 2006; 28: 71-7.
38. Moriarty AS, Gilbody S, McMillan D, Manea L. Screening and case find- ing for major depressive disorder using the Patient Health Questionnaire (PHQ-9): a meta-analysis. Gen Hosp Psychiatry 2015; 37: 567-76.
39. Huang FY, Chung H, Kroenke K, Delucchi KL, Spitzer RL. Using the Pa- tient Health Questionnaire-9 to measure depression among racially and ethnically diverse primary care patients. J Gen Intern Med 2006; 21: 547- 52.
40. Diez-Quevedo C, Rangil T, Sanchez-Planell L, Kroenke K, Spitzer RL. Vali- dation and utility of the patient health questionnaire in diagnosing men- tal disorders in 1003 general hospital Spanish inpatients. Psychosom Med 2001; 63: 679-86.