Factors Associated with Organized and Opportunistic Cancer Screening in Korea: Results of KNHANES 2007–2011
Asian Pac J Cancer Prev, 15 (7), 3279-3286
Introduction
Cancer is the most common cause of death in Korea (Statistics Korea, 2011). In 2009, 69,780 people died of cancer, accounting for 28.3% of all deaths in Korea. That year, the incidence was 398.9 per 100,000 men and 376.9 per 100,000 women; it had increased rapidly from 1999 to 2009, growing annually by 3.3% (Jung et al., 2012).
Because of the high incidence of cancer, the Korean National Cancer Center (KNCC) has been constantly expanding its organized cancer screening program (Park et al., 2012). The KNCC’s National Cancer Screening Program (NCSP) has been in operation since 1999 (Park et al., 2012). In the beginning, the NCSP for gastric (Lee et al., 2011), breast (Kang et al., 2013), and cervical (Jun et al., 2009) cancer was available only to Medical Aid
1Department of Public Health, Graduate School, 6College of Nursing, 2Institute of Health Services Research, 3Department of Preventive Medicine, College of Medicine, Yonsei University, 4Department of Physical Education, Seoul National University, 5College of Nursing, Keimyung University, Korea *For correspondence: [email protected]
Abstract
Background: Cancer is one of the leading causes of death in Korea. To reduce cancer incidence, the Korean National Cancer Center (KNCC) has been expanding its organized cancer screening program. In addition, there are opportunistic screening programs that can be chosen by individuals or their healthcare providers. The purpose of this study was to investigate factors associated with participation in organized and opportunistic cancer screening programs, with a particular focus on socioeconomic factors. Materials and Methods: We used data from the Korea National Health and Nutrition Examination Survey (KNHANES), a cross-sectional nationwide study conducted by the Korean Ministry of Health and Welfare from 2007 to 2011. The study included information from 9,708 men and 12,739 women aged 19 years or over. Multinomial logistic regression analysis was conducted, adjusting for age, year of data collection, residential region, current smoking status, current alcohol consumption status, exercise, marriage status, job status, perceived health status, stress level, BMI, limitation of activities, cancer history, health insurance type, and private insurance status, to investigate the association between education level, economic status, and cancer screening participation. Results: In terms of education level, disparities in attendance were observed only for the opportunistic screening program. In contrast, there was no association between education level and participation in organized screening. In terms of economic status, disparities in opportunistic screening participation were observed at all income levels, but disparities in organized screening participation were observed only at the highest income level. Conclusions: Our findings reveal that socioeconomic factors, including educational level and economic status, were not significantly associated with participation in organized cancer screening, except at the highest level of income.
Keywords: Socioeconomic position - education levels - cancer screening - organized - opportunistic
RESEARCH ARTICLE
Factors Associated with Organized and Opportunistic Cancer Screening: Results of the Korea National Health and Nutrition Examination Survey (KNHANES) 2007-2011
Minsun Kang
1, Ki-Bong Yoo
1,2, Eun-Cheol Park
2,3, Kisung Kwon
4, Gaeun Kim
5, Doo Ree Kim
6, Jeoung A Kwon
1,2*
enrollees, a low-income population. Liver (Lee et al., 2010) and colorectal (Shim et al., 2010) cancer screening were added in 2003 and 2004, respectively. Since 2006, the NCSP has provided screening free of charge for both Medical Aid enrollees and National Health Insurance (NHI) beneficiaries with incomes in the lower half of the distribution (Park et al., 2012). NHI beneficiaries with a higher income can receive screening by paying 10%
of the cost; the remaining 90% of screening costs are subsidized (Park et al., 2012). Opportunistic screening is also available to individuals and their health-care providers (Miles et al., 2004).
Organized screening could play a significant role in reducing the incidence and mortality of cancer by providing a broad range of coverage (Miles et al., 2004).
However, the availability of organized screening does
not always guarantee that inequalities in attendance will be minimal (Spadea et al., 2010). Also, several studies have reported that differences in characteristics such as age, civil status, and socioeconomic position (SEP) are associated with whether an individual receives screening (Ronco et al., 1997) and coverage (Ronco et al., 1991;
Borras et al., 1999). Here, SEP includes social and economic status, factors which reflect an individual’s place in society. SEP incorporates, for example, education level, income, and wealth (Shaw, 2007). To date, few studies have investigated factors associated with attendance for the two different types of cancer screening in Korea (Park et al., 2012; Suh et al., 2013). To target programs efficiently, it is necessary to understand the factors related to screening attendance. Understanding the factors associated with inequalities in attendance according to screening type is also important. The aim of this study was to describe the factors associated with organized and opportunistic cancer screening program attendance.
Materials and Methods
Subjects
This study used Korea National Health and Nutrition Examination Survey (KNHANES) data, which is cross- sectional nationwide data collected from 2007 to 2011.
KNHANES is conducted by the Korean Ministry of Health and Welfare. Sampling in this survey was conducted using a stratified, multistage, clustered probability sampling method (Korea Centers for Disease Control and Prevention, 2012)
The survey has three components: a health interview, a nutrition survey, and a health examination. To obtain the data, household interviews and physical examinations were conducted. An informed consent form was acquired from all participants. The KNHANES website provides survey data to the public. Therefore, ethical approval was not required to analyze KNHANES data.
The total sample size for data collected from 2007 to 2011 was 42,347. Of these individuals, 8,518 were 19 years of age or younger and not included in the analysis.
Also, missing data were not analyzed. In the end, 9,708 men and 12,739 women 19 years of age or older were included in the study.
Dependent variable
History of cancer was assessed by asking, “In the last 2 years, have you had a cancer screening?” The responses were: (1) no; (2) yes, opportunistic cancer screening; and (3) yes, organized cancer screening.
Independent variables of primary interest
Educational level was assessed by asking, “What is your educational level?” Response options were: (1) elementary school, (2) middle school, (3) high school, or (4) college or higher. Economic status was evaluated by household monthly income quartile, and the response options were: (1) Q1, (2) Q2, (3) Q3, and (4) Q4. Q1 is the lowest quartile, and Q4 is the highest.
Covariates
The sociodemographic factors considered were age, residential region, marriage status, health insurance type, private insurance status, and job status. Age data were obtained from KNHANES and assigned to four categories: 19-39, 40-59, 60-79, and 80 years of age or older. Residential region had two categories: metropolis (Seoul, Busan, Daegu, Incheon, Kwangju, Daejeon, and Woolsan) or town/country (Kyungki, Kangwon, Chungbuk, Chungnam, Jonbuk, Jonnam, Kyungbuk, Kyungnam, and Jeju). Marriage status also had two categories: married or not married. Health insurance categories included local national health insurance, corporate national health insurance, and Medical Aid (Kwon, 2009). Private insurance status was a dichotomous Table 1. Characteristics of Subjects (Men)
Variables Gastric Liver Colon
cancer cancer cancer (n=7,272) (n=7,016) (n=5,148)
Age (years) 30-39
40-49 2,100 (28.9) 2,009 (28.6)
50-59 1,907 (26.2) 1,831 (26.1) 1,898 (36.9) 60-69 1,782 (24.5) 1,721 (24.5) 1,775 (34.5)
≥70 1,483 (20.4) 1,455 (20.7) 1,475 (28.7) Year 2007 94 (1.3) 73 (1.0) 44 (0.9) 2008 1,668 (22.9) 1,558 (22.2) 1,148 (22.3) 2009 1,953 (26.9) 1,828 (26.1) 1,363 (26.5) 2010 1,793 (24.7) 1,793 (25.6) 1,272 (24.7) 2011 1,764 (24.3) 1,764 (25.1) 1,321 (25.7) Region* Metropolis 4,493 (61.8) 4,338 (61.8) 3,053 (59.3) Town or Country 2,779 (38.2) 2,678 (38.2) 2,095 (40.7) Marriage status Single 153 (2.1) 151 (2.2) 47 (0.9) Married 7,119 (97.9) 6,865 (97.9) 5,101 (99.1) Current smoking Nonsmoking 4,524 (62.2) 4,375 (62.4) 3,437 (66.8) Smoking 2,748 (37.8) 2,641 (37.6) 1,711 (33.2) Current alcohol Nondrinking 1,506 (20.7) 1,455 (20.7) 1,283 (24.9) consumption Drinking 5,766 (79.3) 5,561 (79.3) 3,865 (75.1) Exercise No 717 (9.9) 701 (10.0) 536 (10.4) Yes 6,555 (90.1) 6,315 (90.0) 4,612 (89.6) Educational level Elementary school 1,969 (27.1) 1,904 (27.1) 1,860 (36.1) Middle school 1,233 (17.0) 1,194 (17.0) 1,044 (20.3) High school 2,232 (30.7) 2,149 (30.6) 1,361 (26.4) College or higher 1,838 (25.3) 1,769 (25.2) 883 (17.2) Economic status Q1 1,537 (21.1) 1,477 (21.1) 972 (18.9) Q2 1,790 (24.6) 1,790 (25.5) 1,315 (25.5) Q3 1,843 (25.3) 1,716 (24.5) 1,377 (26.8) Q4 2,102 (28.9) 2,033 (29.0) 1,484 (28.8) Job status Unemployed 2,063 (28.4) 1,996 (28.5) 1,907 (37)
Employee 2,445 (33.6) 2,374 (33.8) 1,268 (24.6) Employer 2,764 (38.0) 2,646 (37.7) 1,973 (38.3) Perceived health Very good 440 (6.1) 418 (6.0) 325 (6.3) status Good 2,527 (34.8) 2,423 (34.5) 1,708 (33.2) Moderate 2,753 (37.9) 2,675 (38.1) 1,824 (35.4) Bad 1,295 (17.8) 1,250 (17.8) 1,045 (20.3) Very bad 257 (3.5) 250 (3.6) 246 (4.8) Stress level Mild 5,708 (78.5) 5,502 (78.4) 4,202 (81.6) Severe 1,564 (21.5) 1,514 (21.6) 946 (18.4) Body mass index ≤18.4 234 (3.2) 228 (3.3) 196 (3.8) (kg/m2) 18.5-24.9 4,497 (61.8) 4,351 (62.0) 3,303 (64.2)
≥25 2,541 (34.9) 2,437 (34.7) 1,649 (32.0) Limitation in Yes 1,188 (16.3) 1,151 (16.4) 1,066 (20.7) activities No 6,084 (83.7) 5,865 (83.6) 4,082 (79.3) Cancer history No 7,099 (97.6) 6,850 (97.6) 4,982 (96.8) Yes 173 (2.4) 166 (2.4) 166 (3.2) Health insurance NHI (self) 2,795 (38.4) 2,675 (38.1) 1,898 (36.9) type NHI (employee) 4,255 (58.5) 4,124 (58.8) 3,084 (59.9) Medicaid aid 222 (3.1) 217 (3.1) 166 (3.2) Private insurance No 2,803 (38.6) 2,718 (38.7) 2,519 (48.9) Yes 4,469 (61.5) 4,298 (61.3) 2,629 (51.1) Cancer screening No screening 5,034 (69.2) 4,778 (68.1) 3,488 (67.8) Opportunistic 828 (11.4) 828 (11.8) 592 (11.5) Organized 1,410 (19.4) 1,410 (20.1) 1,068 (20.8)
*n (%), Region: Metropolis (Seoul, Busan, Deagu, Inchoen, Kwangju, Daejeon, Woolsan), Town or country (Kyungki, Kangwon, Chungbuk, Chungnam, Jonbuk, Jonnam, Kyungbuk, Kyungnam, Jeju)
Factors Associated with Organized and Opportunistic Cancer Screening in Korea: Results of KNHANES 2007–2011 yes or no variable. Job status categories were unemployed,
employee, or employer.
This study also included data on health behavior such as smoking, drinking, and exercise. Current smoking status encompassed two categories: nonsmoking and smoking.
Current alcohol consumption status also encompassed two categories: nondrinking and drinking. Exercise was divided into two categories: no and yes. The year of data collection (2007-2011) was also considered.
In addition, we considered health status variables, including perceived health status, stress level, BMI, limitation of activities, and cancer history. Perceived health status was divided into 5 categories: very good, good, moderate, bad, and very bad. Stress level had two categories: mild or severe. BMI was categorized into less than 18.5 kg/m2, 18.5-24.9 kg/m2, and 25.0 kg/m2 or more. Limitation of activities and cancer history were
dichotomous yes/no variables.
Statistical analysis
Multinomial logistic regression analysis was conducted to investigate the associations between education level, economic status, and cancer screening. Our models adjusted for age, year of data collection, residential region, current smoking status, current alcohol consumption status, exercise, marriage status, job status, perceived health status, stress level, BMI, limitation of activities, cancer history, health insurance type, and private insurance status.
Odds ratios and 95% confidence intervals (CIs) were calculated, and statistical significance was set at p<0.05.
Statistical analyses were performed using SAS, version 9.2 (SAS Institute Inc., Cary, NC, US).
Table 2. Characteristics of Subjects (Women)
Variables Gastric cancer Liver cancer Colon cancer Breast cancer Cervical cancer (n=9,681) (n=9,498) (n=6,900) (n=9,676) (n=12,576)
Age (years) 30-39 2,900 (23.1)
40-49 2,746 (28.4) 2,703 (28.5) 2,745 (28.4) 2,745 (21.8)
50-59 2,591 (26.8) 2,550 (26.9) 2,585 (37.5) 2,590 (26.8) 2,590 (20.6) 60-69 2,273 (23.5) 2,212 (23.3) 2,259 (32.7) 2,272 (23.5) 2,272 (18.1) 70£ 2,071 (21.4) 2,033 (21.4) 2,056 (29.8) 2,069 (21.4) 2,069 (16.5)
Year 2007 76 (0.8) 69 (0.7) 36 (0.5) 76 (0.8) 104 (0.8)
2008 2,371 (24.5) 2,286 (24.1) 1,664 (24.1) 2,366 (24.5) 3,133 (24.9) 2009 2,672 (27.6) 2,581 (27.2) 1,846 (26.8) 2,672 (27.6) 3,467 (27.6) 2010 2,230 (23.0) 2,230 (23.5) 1,619 (23.5) 2,230 (23.1) 2,928 (23.3) 2011 2,332 (24.1) 2,332 (24.6) 1,735 (25.1) 2,332 (24.1) 2,944 (23.4) Region* Metropolis 5,964 (61.6) 5,850 (61.6) 4,036 (58.5) 5,961 (61.6) 8,053 (64.0) Town or country 3,717 (38.4) 3,648 (38.4) 2,864 (41.5) 3,715 (38.4) 4,523 (36.0) Marriage status Single 89 (0.9) 87 (0.9) 41 (0.6) 89 (0.9) 337 (2.7) Married 9,592 (99.1) 9,411 (99.1) 6,859 (99.4) 9,587 (99.1) 12,239 (97.3) Current smoking Nonsmoking 9,226 (95.3) 9,055 (95.3) 6,591 (95.5) 9,221 (95.3) 11,914 (94.7) Smoking 455 (4.7) 443 (4.7) 309 (4.5) 455 (4.7) 662 (5.3) Current alcohol consumption Nondrinking 4,451 (46.0) 4,368 (46) 3,724 (54.0) 4,449 (46.0) 5,122 (40.7) Drinking 5,230 (54.0) 5,130 (54) 3,176 (46.0) 5,227 (54.0) 7,454 (59.3)
Exercise No 1,294 (13.4) 1,277 (13.4) 1,006 (14.6) 1,294 (13.4) 1,542 (12.3)
Yes 8,387 (86.6) 8,221 (86.6) 5,894 (85.4) 8,382 (86.6) 11,034 (87.7) Educational level Elementary school 4,707 (48.6) 4,606 (48.5) 4,471 (64.8) 4,703 (48.6) 4,730 (37.6) Middle school 1,372 (14.2) 1,347 (14.2) 988 (14.3) 1,372 (14.2) 1,439 (11.4) High school 2,487 (25.7) 2,444 (25.7) 1,091 (15.8) 2,486 (25.7) 3,818 (30.4) College or higher 1,115 (11.5) 1,101 (11.6) 350 (5.1) 1,115 (11.5) 2,589 (20.6) Economic status Q1 2,675 (27.6) 2,614 (27.5) 1,931 (28) 2,338 (24.2) 2,764 (22.0) Q2 2,334 (24.1) 2,366 (24.9) 1,661 (24.1) 2,189 (22.6) 3,356 (26.7) Q3 2,162 (22.3) 2,041 (21.5) 1,632 (23.7) 2,639 (27.3) 3,307 (26.3) Q4 2,510 (25.9) 2,477 (26.1) 1,676 (24.3) 2,510 (25.9) 3,149 (25.0) Job status Unemployed 6,105 (63.1) 5,997 (63.1) 4,796 (69.5) 6,101 (63.1) 7,769 (61.8) Employee 2,193 (22.7) 2,166 (22.8) 1,193 (17.3) 2,193 (22.7) 3,155 (25.1) Employer 1,383 (14.3) 1,335 (14.1) 911 (13.2) 1,382 (14.3) 1,652 (13.1) Perceived health status Very good 331 (3.4) 328 (3.5) 218 (3.2) 331 (3.4) 445 (3.5) Good 2,764 (28.6) 2,712 (28.6) 1,781 (25.8) 2,763 (28.6) 3,793 (30.2) Moderate 3,494 (36.1) 3,432 (36.1) 2,336 (33.9) 3,493 (36.1) 4,842 (38.5) Bad 2,438 (25.2) 2,383 (25.1) 1,962 (28.4) 2,435 (25.2) 2,811 (22.4) Very bad 654 (6.8) 643 (6.8) 603 (8.7) 654 (6.8) 685 (5.5) Stress level Mild 6,980 (72.1) 6,855 (72.2) 4,962 (71.9) 6,977 (72.1) 8,958 (71.2) Severe 2,701 (27.9) 2,643 (27.8) 1,938 (28.1) 2,699 (27.9) 3,618 (28.8) Body mass index (kg/m2) ≤18.4 265 (2.7) 260 (2.7) 184 (2.7) 265 (2.7) 497 (4.0) 18.5-24.9 6,031 (62.3) 5,916 (62.3) 4,089 (59.3) 6,028 (62.3) 8,133 (64.7) 25≤ 3,385 (35.0) 3,322 (35.0) 2,627 (38.1) 3,383 (35.0) 3,946 (31.4) Limitation in activities Yes 2,277 (23.5) 2,221 (23.4) 2,017 (29.2) 2,276 (23.5) 2,440 (19.4) No 7,404 (76.5) 7,277 (76.6) 4,883 (70.8) 7,400 (76.5) 10,136 (80.6) Cancer history No 9,375 (96.8) 9,196 (96.8) 6,654 (96.4) 9,371 (96.9) 12,257 (97.5) Yes 306 (3.2) 302 (3.2) 246 (3.6) 305 (3.2) 319 (2.5) Health insurance type NHI (self) 3,614 (37.3) 3,550 (37.4) 2,408 (34.9) 3,613 (37.3) 4,549 (36.2) NHI (employee) 5,587 (57.7) 5,479 (57.7) 4,093 (59.3) 5,584 (57.7) 7,508 (59.7) Medicaid aid 480 (5.0) 469 (4.9) 399 (5.8) 479 (5.0) 519 (4.1) Private insurance No 3,681 (38.0) 3,614 (38.1) 3,352 (48.6) 3,679 (38.0) 3,974 (31.6) Yes 6,000 (62.0) 5,884 (62.0) 3,548 (51.4) 5,997 (62.0) 8,602 (68.4) Cancer screening No screening 6,979 (72.1) 6,796 (71.6) 4,934 (71.5) 6,975 (72.1) 9,358 (74.4) Opportunistic 1,030 (10.6) 1,030 (10.8) 688 (10.0) 1,029 (10.6) 1,460 (11.6) Organized 1,672 (17.3) 1,672 (17.6) 1,278 (18.5) 1,672 (17.3) 1,758 (14.0)
*n (%), Region : Metropolis (Seoul, Busan, Deagu, Inchoen, Kwangju, Daejeon, Woolsan), Town or country (Kyungki, Kangwon, Chungbuk, Chungnam, Jonbuk, Jonnam, Kyungbuk, Kyungnam, Jeju)
Results
A total of 6,259 men and 6,231 women had not had cancer screening, while 1,256 men and 3,196 women had opportunistic cancer screening, and 2,193 men and 3,312 women had organized cancer screening. Table 1 shows the characteristics of the sample.
Multinomial logistic regression analyses
The results of the multinomial logistic regression analysis of education, economic status, and cancer screening are presented in Table 2. The results were adjusted for age, year of data collection, residential region, current smoking status, current alcohol consumption status, exercise, marriage status, job status, perceived health status, stress level, BMI, limitation of activities, cancer history, health insurance type, and private insurance status.
In terms of age, the odds ratios for organized screening
in men and women were very similar. Relative to men aged 19-39 years, the odds ratios for opportunistic screening were 2.91 (95%CI: 2.38-3.55; p<0.001) for 40-59 year olds, 4.57 (95%CI: 3.46-6.05; p<0.001) for 60-79 year olds, and 2.49 (95%CI: 1.34-4.62; p<0.001) for men 80 years or older. However, the odds ratios for opportunistic screening in women showed a negative association with age.
The odds ratios associated with the year of collection variable were significant only for organized screening after 2010, as compared to 2007. With respect to the residential region variable, the odds ratio for opportunistic screening in men was 0.81 (95%CI: 0.68-0.95; p=0.01) for town/
country residence compared to metropolis residence.
Among the health behavior variables, the odd ratios for current smoking status and exercise showed a negative association with screening. However, the odds ratio for organized screening attendance in men was 1.26 (95%CI: 1.04-1.54; p=0.02) for drinkers as compared to Table 3. Multinomial Logistic Regression Analysis (Men)
Variables Gastric cancer Liver cancer Colon cancer
Opportunistic Organized Opportunistic Organized Opportunistic Organized
Age (years) 40-49 1.00 1.00 1.00 1.00
50-59 1.56 * 1.66 * 1.55 * 1.66 * 1.00 1.00
60-69 1.68 * 2.36 * 1.66 * 2.37 * 0.98 1.35 *
70£ 1.62 * 1.60 * 1.57 * 1.59 * 0.86 0.89
Year 2007 1.00 1.00 1.00 1.00 1.00 1.00
2008 1.31 1.77 1.05 1.41 0.9 0.88
2009 0.88 1.65 0.7 1.31 0.63 0.82
2010 2.09 * 13.36 * 1.53 9.64 * 1.63 6.83 *
2011 0.56 3.73 * 0.41 * 2.69 * 0.44 1.9
Region* Metropolis 1.00 1.00 1.00 1.00 1.00 1.00
Town or country 0.84 1.13 0.84 1.13 0.85 1.03
Marriage status Single 1.00 1.00 1.00 1.00 1.00 1.00
Married 2.54 1.14 2.63 1.14 - 1.04
Current smoking Nonsmoking 1.00 1.00 1.00 1.00 1.00 1.00
Smoking 0.69 * 0.76 * 0.70 * 0.77 * 0.73 * 0.65 *
Current alcohol Nondrinking 1.00 1.00 1.00 1.00 1.00 1.00
consumption Drinking 1.24 1.36 * 1.22 1.35 * 1.23 1.16
Exercise No 1.00 1.00 1.00 1.00 1.00 1.00
Yes 1.21 1.11 1.24 1.12 1.27 1.16
Educational level Elementary school 1.00 1.00 1.00 1.00 1.00 1.00
Middle school 1.35 1.11 1.35 1.11 1.35 1.09
High school 1.42 * 1.05 1.42 * 1.04 1.43 * 1.06
College or higher 1.47 * 1.26 1.47 * 1.24 1.60 * 1.2
Economic status Q1 1.00 1.00 1.00 1.00 1.00 1.00
Q2 1.48 * 1.16 1.48 * 1.12 1.16 1
Q3 1.52 * 1.13 1.48 * 1.17 1.39 1.37 *
Q4 2.37 * 1.18 2.36 * 1.19 1.84 * 1.18
Job status Unemployed 1.00 1.00 1.00 1.00 1.00 1.00
Employee 0.98 1.04 0.95 1.02 0.91 0.95
Employer 1.2 1.08 1.19 1.08 1.16 1.00
Perceived health Very good 1.00 1.00 1.00 1.00 1.00 1.00
status Good 0.82 0.98 0.79 0.97 0.82 0.95
Moderate 0.94 0.97 0.92 0.96 0.87 0.84
Bad 1.32 1.2 1.3 1.18 1.25 1.1
Very bad 1.26 0.58 1.22 0.58 0.77 0.53 *
Stress level Mild 1.00 1.00 1.00 1.00 1.00 1.00
Severe 0.91 0.99 0.9 0.99 0.84 1.09
Body mass index ≤ 18.4 1.00 1.00 1.00 1.00 1.00 1.00
(kg/m2) 18.5 - 24.9 1.25 1.08 1.27 1.09 1.61 1.21
25 ≤ 1.15 1.25 1.19 1.27 1.66 1.44
Limitation in Yes 1.00 1.00 1.00 1.00 1.00 1.00
activities No 0.76 1.05 0.75 1.04 0.84 1.07
Cancer history No 1.00 1.00 1.00 1.00 1.00 1.00
Yes 2.13 * 0.67 2.17 * 0.69 2.42 * 0.75
Health insurance NHI(self) 1.00 1.00 1.00 1.00 1.00 1.00
type NHI(employee) 1.18 1.28 * 1.18 1.28 * 1.07 1.24 *
Medicaid aid 0.54 1.2 0.53 1.22 0.37 1.12
Private insurance No 1.00 1.00 1.00 1.00 1.00 1.00
Yes 1.61 * 1.41 * 1.64 * 1.42 * 1.33 1.34 *
*p<0.05
Factors Associated with Organized and Opportunistic Cancer Screening in Korea: Results of KNHANES 2007–2011 nondrinkers, and the odds ratio for opportunistic screening
attendance in women was 1.15 (95%CI: 1.02-1.30;
p=0.02) for drinkers compared to nondrinkers. Among the health behavior variables, only the current alcohol consumption variable showed a positive association with screening.
The odds ratios for opportunistic screening in both men and women revealed a positive association with education level. The odds ratio for organized screening in men was 0.77 (95%CI: 0.62-0.95; p=0.02) for those with a high school education compared to those with an elementary school education.
In terms of economic status, the odds ratios for opportunistic screening were significant for men in Q2- Q4 as compared to those in Q1. However, the odds ratios for organized screening were 1.28 (95%CI: 1.01-1.61;
p=0.04) for men and 1.21 (95%CI: 1.01-1.46; p=0.04) for women in Q4 as compared to Q1. The odds ratio for opportunistic screening in women was 1.39 (95%CI: 1.14- 1.69; p<0.001) for Q4, as compared to Q1.
Compared to the unemployed, the employee odds
ratios for organized screening were 1.24 (95%CI: 1.01- 1.53; p=0.04) in men and 1.31 (95%CI: 1.15-1.50;
p<0. 001) in women. For opportunistic screening, no significant associations were seen in men employees, but a negative association with attendance was seen in women employees, as compared to the unemployed.
People who perceived themselves to be unhealthy were more likely to attend cancer screenings. The odds ratio for organized screening was 0.76 (95%CI: 0.66-0.87; p<0.
001) for women with severe as opposed to mild stress.
In terms of organized screening attendance, women with limited activity had an odds ratio of 1.18 (95%CI, 1.01- 1.38; p=0.04) compared to those with no limitation of activity.
In both men and women, the odds ratios for opportunistic screening were elevated in those with a history of cancer.
The odds ratios for men with corporate national health insurance were significantly elevated for both types of screening program compared to those with local national health insurance. In women, the odds ratio for opportunistic screening was 0.59 (95%CI: 0.39-0.90;
Table 4. Multinomial Logistic Regression Analysis (Women)
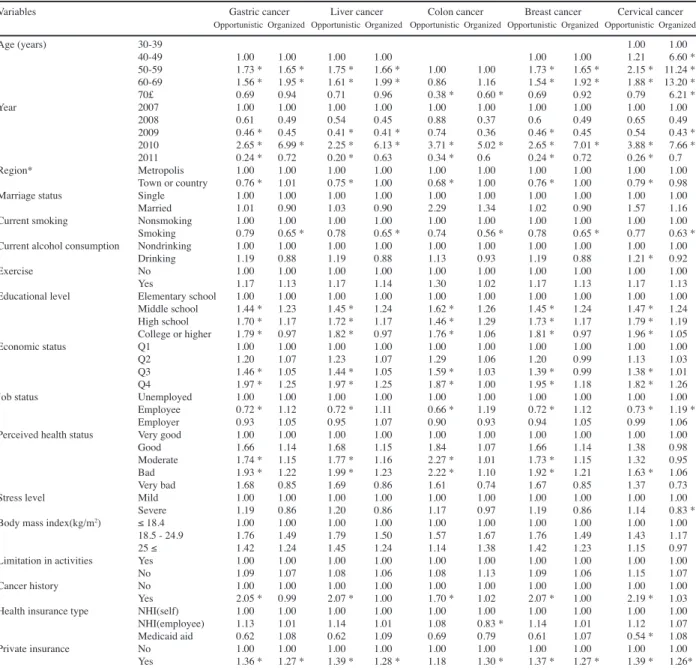
Variables Gastric cancer Liver cancer Colon cancer Breast cancer Cervical cancer
Opportunistic Organized Opportunistic Organized Opportunistic Organized Opportunistic Organized Opportunistic Organized
Age (years) 30-39 1.00 1.00
40-49 1.00 1.00 1.00 1.00 1.00 1.00 1.21 6.60 *
50-59 1.73 * 1.65 * 1.75 * 1.66 * 1.00 1.00 1.73 * 1.65 * 2.15 * 11.24 * 60-69 1.56 * 1.95 * 1.61 * 1.99 * 0.86 1.16 1.54 * 1.92 * 1.88 * 13.20 *
70£ 0.69 0.94 0.71 0.96 0.38 * 0.60 * 0.69 0.92 0.79 6.21 *
Year 2007 1.00 1.00 1.00 1.00 1.00 1.00 1.00 1.00 1.00 1.00
2008 0.61 0.49 0.54 0.45 0.88 0.37 0.6 0.49 0.65 0.49
2009 0.46 * 0.45 0.41 * 0.41 * 0.74 0.36 0.46 * 0.45 0.54 0.43 * 2010 2.65 * 6.99 * 2.25 * 6.13 * 3.71 * 5.02 * 2.65 * 7.01 * 3.88 * 7.66 * 2011 0.24 * 0.72 0.20 * 0.63 0.34 * 0.6 0.24 * 0.72 0.26 * 0.7 Region* Metropolis 1.00 1.00 1.00 1.00 1.00 1.00 1.00 1.00 1.00 1.00
Town or country 0.76 * 1.01 0.75 * 1.00 0.68 * 1.00 0.76 * 1.00 0.79 * 0.98 Marriage status Single 1.00 1.00 1.00 1.00 1.00 1.00 1.00 1.00 1.00 1.00
Married 1.01 0.90 1.03 0.90 2.29 1.34 1.02 0.90 1.57 1.16 Current smoking Nonsmoking 1.00 1.00 1.00 1.00 1.00 1.00 1.00 1.00 1.00 1.00 Smoking 0.79 0.65 * 0.78 0.65 * 0.74 0.56 * 0.78 0.65 * 0.77 0.63 * Current alcohol consumption Nondrinking 1.00 1.00 1.00 1.00 1.00 1.00 1.00 1.00 1.00 1.00
Drinking 1.19 0.88 1.19 0.88 1.13 0.93 1.19 0.88 1.21 * 0.92
Exercise No 1.00 1.00 1.00 1.00 1.00 1.00 1.00 1.00 1.00 1.00
Yes 1.17 1.13 1.17 1.14 1.30 1.02 1.17 1.13 1.17 1.13
Educational level Elementary school 1.00 1.00 1.00 1.00 1.00 1.00 1.00 1.00 1.00 1.00 Middle school 1.44 * 1.23 1.45 * 1.24 1.62 * 1.26 1.45 * 1.24 1.47 * 1.24 High school 1.70 * 1.17 1.72 * 1.17 1.46 * 1.29 1.73 * 1.17 1.79 * 1.19 College or higher 1.79 * 0.97 1.82 * 0.97 1.76 * 1.06 1.81 * 0.97 1.96 * 1.05 Economic status Q1 1.00 1.00 1.00 1.00 1.00 1.00 1.00 1.00 1.00 1.00
Q2 1.20 1.07 1.23 1.07 1.29 1.06 1.20 0.99 1.13 1.03
Q3 1.46 * 1.05 1.44 * 1.05 1.59 * 1.03 1.39 * 0.99 1.38 * 1.01 Q4 1.97 * 1.25 1.97 * 1.25 1.87 * 1.00 1.95 * 1.18 1.82 * 1.26 Job status Unemployed 1.00 1.00 1.00 1.00 1.00 1.00 1.00 1.00 1.00 1.00
Employee 0.72 * 1.12 0.72 * 1.11 0.66 * 1.19 0.72 * 1.12 0.73 * 1.19 *
Employer 0.93 1.05 0.95 1.07 0.90 0.93 0.94 1.05 0.99 1.06
Perceived health status Very good 1.00 1.00 1.00 1.00 1.00 1.00 1.00 1.00 1.00 1.00
Good 1.66 1.14 1.68 1.15 1.84 1.07 1.66 1.14 1.38 0.98
Moderate 1.74 * 1.15 1.77 * 1.16 2.27 * 1.01 1.73 * 1.15 1.32 0.95 Bad 1.93 * 1.22 1.99 * 1.23 2.22 * 1.10 1.92 * 1.21 1.63 * 1.06 Very bad 1.68 0.85 1.69 0.86 1.61 0.74 1.67 0.85 1.37 0.73 Stress level Mild 1.00 1.00 1.00 1.00 1.00 1.00 1.00 1.00 1.00 1.00
Severe 1.19 0.86 1.20 0.86 1.17 0.97 1.19 0.86 1.14 0.83 * Body mass index(kg/m2) ≤ 18.4 1.00 1.00 1.00 1.00 1.00 1.00 1.00 1.00 1.00 1.00
18.5 - 24.9 1.76 1.49 1.79 1.50 1.57 1.67 1.76 1.49 1.43 1.17
25 ≤ 1.42 1.24 1.45 1.24 1.14 1.38 1.42 1.23 1.15 0.97
Limitation in activities Yes 1.00 1.00 1.00 1.00 1.00 1.00 1.00 1.00 1.00 1.00
No 1.09 1.07 1.08 1.06 1.08 1.13 1.09 1.06 1.15 1.07
Cancer history No 1.00 1.00 1.00 1.00 1.00 1.00 1.00 1.00 1.00 1.00 Yes 2.05 * 0.99 2.07 * 1.00 1.70 * 1.02 2.07 * 1.00 2.19 * 1.03 Health insurance type NHI(self) 1.00 1.00 1.00 1.00 1.00 1.00 1.00 1.00 1.00 1.00
NHI(employee) 1.13 1.01 1.14 1.01 1.08 0.83 * 1.14 1.01 1.12 1.07 Medicaid aid 0.62 1.08 0.62 1.09 0.69 0.79 0.61 1.07 0.54 * 1.08 Private insurance No 1.00 1.00 1.00 1.00 1.00 1.00 1.00 1.00 1.00 1.00 Yes 1.36 * 1.27 * 1.39 * 1.28 * 1.18 1.30 * 1.37 * 1.27 * 1.39 * 1.26*
*p<0.05
Table 5. Multinomial Logistic Regression Analysis by Age (Men)
Variables 40-49 50-59 60≤
Opportunistic Organized Opportunistic Organized Opportunistic Organized Gastric cancer Educational level Elementary school 1.00 1.00 1.00 1.00 1.00 1.00
Middle school 1.24 1.10 1.49 0.94 1.23 1.23
High school 1.45 0.93 1.57 1.01 1.26 1.15
College or higher 1.40 1.18 1.51 1.12 1.80 * 1.26
Economic status Q1 1.00 1.00 1.00 1.00 1.00 1.00
Q2 5.31 * 1.44 1.12 1.05 1.43 1.18
Q3 4.97 * 1.13 1.38 1.39 1.39 1.15
Q4 8.74 * 1.48 1.91 1.18 1.86 * 0.91
Liver cancer Educational level Elementary school 1.00 1.00 1.00 1.00 1.00 1.00
Middle school 1.29 1.11 1.46 0.92 1.25 1.25
High school 1.53 0.93 1.59 1.00 1.26 1.14
College or higher 1.47 1.16 1.54 1.12 1.78 * 1.25
Economic status Q1 1.00 1.00 1.00 1.00 1.00 1.00
Q2 5.62 * 1.37 1.10 0.97 1.41 1.16
Q3 4.67 * 1.13 1.36 1.48 1.45 1.19
Q4 8.67 * 1.48 1.90 1.20 1.90 * 0.93
Colon cancer Educational level Elementary school 1.00 1.00 1.00 1.00
Middle school 1.50 0.94 1.20 1.21
High school 1.64 1.00 1.27 1.12
College or higher 1.63 1.15 1.78 * 1.17
Economic status Q1 1.00 1.00 1.00 1.00
Q2 0.57 0.49 1.43 1.25
Q3 0.76 1.00 1.64 * 1.44 *
Q4 1.00 0.81 2.00 * 1.27
* p<0.05, Adjusting for age, year of data collection, residential region, marriage status, current smoking status, current alcohol consumption status, exercise, job status, perceived health status, stress level, BMI, limitation of activities, cancer history, health insurance type, and private insurance status
0 25.0 50.0 75.0 100.0
Newly diagnosed without treatment Newly diagnosed with treatment Persistence or recurrence Remission None Chemotherapy Radiotherapy Concurrent chemoradiation
10.3
0 12.8
30.0 25.0
10.1 20.3 6.3
51.7 51.1 75.0
31.3 30.0 54.2
56.3 46.8
25.0 27.6 30.0 33.1
23.7 31.3 31.3 38.0
Table 6. Multinomial Logistic Regression Analysis by Age (Women)
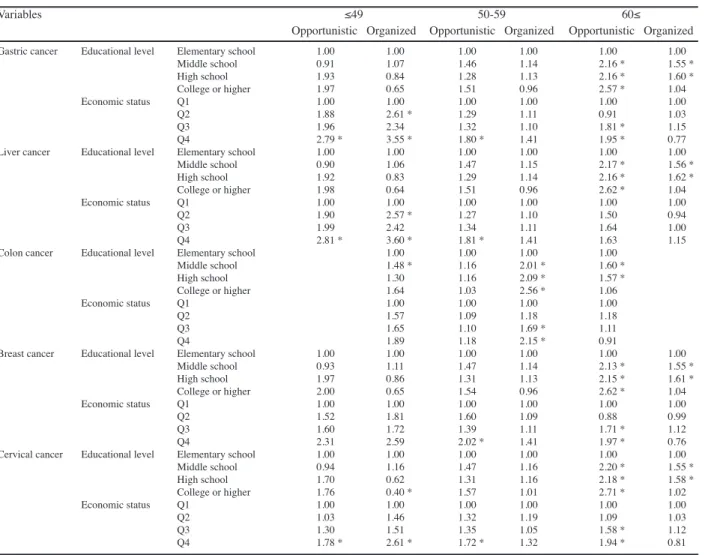
Variables ≤49 50-59 60≤
Opportunistic Organized Opportunistic Organized Opportunistic Organized Gastric cancer Educational level Elementary school 1.00 1.00 1.00 1.00 1.00 1.00
Middle school 0.91 1.07 1.46 1.14 2.16 * 1.55 *
High school 1.93 0.84 1.28 1.13 2.16 * 1.60 *
College or higher 1.97 0.65 1.51 0.96 2.57 * 1.04
Economic status Q1 1.00 1.00 1.00 1.00 1.00 1.00
Q2 1.88 2.61 * 1.29 1.11 0.91 1.03
Q3 1.96 2.34 1.32 1.10 1.81 * 1.15
Q4 2.79 * 3.55 * 1.80 * 1.41 1.95 * 0.77
Liver cancer Educational level Elementary school 1.00 1.00 1.00 1.00 1.00 1.00
Middle school 0.90 1.06 1.47 1.15 2.17 * 1.56 *
High school 1.92 0.83 1.29 1.14 2.16 * 1.62 *
College or higher 1.98 0.64 1.51 0.96 2.62 * 1.04
Economic status Q1 1.00 1.00 1.00 1.00 1.00 1.00
Q2 1.90 2.57 * 1.27 1.10 1.50 0.94
Q3 1.99 2.42 1.34 1.11 1.64 1.00
Q4 2.81 * 3.60 * 1.81 * 1.41 1.63 1.15
Colon cancer Educational level Elementary school 1.00 1.00 1.00 1.00
Middle school 1.48 * 1.16 2.01 * 1.60 *
High school 1.30 1.16 2.09 * 1.57 *
College or higher 1.64 1.03 2.56 * 1.06
Economic status Q1 1.00 1.00 1.00 1.00
Q2 1.57 1.09 1.18 1.18
Q3 1.65 1.10 1.69 * 1.11
Q4 1.89 1.18 2.15 * 0.91
Breast cancer Educational level Elementary school 1.00 1.00 1.00 1.00 1.00 1.00
Middle school 0.93 1.11 1.47 1.14 2.13 * 1.55 *
High school 1.97 0.86 1.31 1.13 2.15 * 1.61 *
College or higher 2.00 0.65 1.54 0.96 2.62 * 1.04
Economic status Q1 1.00 1.00 1.00 1.00 1.00 1.00
Q2 1.52 1.81 1.60 1.09 0.88 0.99
Q3 1.60 1.72 1.39 1.11 1.71 * 1.12
Q4 2.31 2.59 2.02 * 1.41 1.97 * 0.76
Cervical cancer Educational level Elementary school 1.00 1.00 1.00 1.00 1.00 1.00
Middle school 0.94 1.16 1.47 1.16 2.20 * 1.55 *
High school 1.70 0.62 1.31 1.16 2.18 * 1.58 *
College or higher 1.76 0.40 * 1.57 1.01 2.71 * 1.02
Economic status Q1 1.00 1.00 1.00 1.00 1.00 1.00
Q2 1.03 1.46 1.32 1.19 1.09 1.03
Q3 1.30 1.51 1.35 1.05 1.58 * 1.12
Q4 1.78 * 2.61 * 1.72 * 1.32 1.94 * 0.81
* p<0.05, Adjusting for age, year of data collection, residential region, marriage status, current smoking status, current alcohol consumption status, exercise, job status, perceived health status, stress level, BMI, limitation of activities, cancer history, health insurance type, and private insurance status
p=0.01) for Medical Aid beneficiaries as compared to those with local national health insurance, and the odds ratio for organized screening was 1.16 (95%CI: 1.02- 1.31; p=0.02) for corporate national health insurance
as compared to local national health insurance. Having private insurance was positively associated with both screening types in both men and women.
Factors Associated with Organized and Opportunistic Cancer Screening in Korea: Results of KNHANES 2007–2011
0 25.0 50.0 75.0 100.0
Newly diagnosed without treatment Newly diagnosed with treatment Persistence or recurrence Remission None Chemotherapy Radiotherapy Concurrent chemoradiation
10.3
0 12.8
30.0 25.0
10.1 20.3 6.3
51.7 51.1 75.0
31.3 30.0 54.2
56.3 46.8
25.0 27.6 30.0 33.1
23.7 31.3 31.3 38.0
0 25.0 50.0 75.0 100.0
Newly diagnosed without treatment Newly diagnosed with treatment Persistence or recurrence Remission None Chemotherapy Radiotherapy Concurrent chemoradiation
10.3
0 12.8
30.0 25.0
10.1 20.3 6.3
51.7 51.1 75.0
31.3 30.0 54.2
56.3 46.8
25.0 27.6 30.0 33.1
23.7 31.3 31.3 38.0
Discussion
The most cost-effective way of reducing cancer mortality is to provide screening as part of an organized program. Both organized and opportunistic cancer screening are widely available in Korea. Although studies have consistently indicated that SEP is associated with cancer screening rates (Link et al., 1998; Nelson et al., 2003; Swan et al., 2003), it is unclear whether organized and opportunistic screening respond to the needs of different socioeconomic groups or not. To expand organized screening, it is essential to know who uses organized vs opportunistic screening. This study focused on identifying factors associated with participation in both types of cancer screening.
Overall, the participation rate for organized cancer screening increased significantly over time, while the rate for opportunistic screening remained relatively constant or decreased somewhat. These trends were consistent with those reported previously (Lee et al., 2010; Lim et al., 2010), and this finding indicates that organized cancer screening programs have played an important role in expanding screening in Korea. Significant trends toward increased organized cancer screening rates were observed, especially for men.
Age, marital status, smoking behavior, and private insurance status were significantly associated with participation in both opportunistic and organized screening. The participation rate in cancer screening increased until age 60-79 years, then decreased, except in the case of opportunistic screening for women. Single people and current smokers were less likely to participate in cancer screening, consistent with previous studies (Choi et al., 2010a; 2010b; Hansen et al., 2011). People with private medical insurance in addition to National Health Insurance or Medical Aid were slightly more likely to participate in both organized and opportunistic screening.
Previous studies of cancer screening have shown that cancer survivors have higher rates of cancer screening compared to the general population (Cullati et al., 2009;
Cho et al., 2010). Significant trends toward increased rates of opportunistic screening were observed among participants with previous cancer history, but no such trends were seen for organized screening in this study. In contrast to the findings of a previous study (Yang et al., 2013), a significant association between residential region and participation in organized screening was not observed.
The participation rate for opportunistic screening among men residents of metropolitan areas was slightly higher than those from town/country areas.
In this study, it was important to know whether participation rate differed according to SEP. Several previous studies have observed differences among socioeconomic groups (Hahm et al., 2011; Park et al., 2011) with low SEP being inversely associated with participation in organized screening (Lee et al., 2010).
This study extended previous findings on the association between cancer screening participation rates and SEP by investigating two type of screening. Fortunately, education level and economic status were not significantly associated with organized cancer screening participation in this study,
with the exception of increased participation in organized screening in the highest income quartile. Our results indicate that SEP is only associated with participation in opportunistic screening. The odds of opportunistic cancer screening participation among women with a college degree or higher and men with a high income were more than twice as high than those for lower socioeconomic groups. Since one advantage of organized screening programs is decreased social inequality in the utilization of preventive health services, SEP disparities may not be equally important in organized and opportunistic screening settings.
This study has several limitations. It is possible that information regarding cancer screening was systematically biased because all data were gathered from self-reported health surveys that are potentially subject to problems, including recall bias. Another limitation is that information regarding some health-seeking behaviors relevant to cancer prevention was not available in this study, because the dataset did not contain them. Previous research has indicated that an individual’s knowledge of, perception of, and attitude toward cancer risk and prevention affects awareness of cancer screening (Demark-Wahnefried et al., 1995; Chamot et al., 2007; Gwede et al., 2010).
However, our analysis did not include these variables, and this could cause inaccurate outcome classification and biased estimation. Despite these limitations, the results of this study were obtained from a large, representative sample with a stratified, multistage, clustered probability design, thus minimizing the possibility of selection bias.
Also, while many studies have investigated the association between health-seeking behaviors and cancer screening in general, this study examined organized and opportunistic screening separately.
In conclusion, we found that differences in age, marital status, smoking behavior, previous cancer history, private insurance status, residential region, educational level, and economic status partially predict participation in organized and opportunistic cancer screening programs.
Our findings underscore the fact that socioeconomic factors, including educational level and economic status, were not significantly associated with participation in organized cancer screening, except for at the highest level of income. Therefore, our results suggest that strategies to promote participation and reduce inequality in attendance should differ according to the type of screening offered.
References
Borras JM, Guillen M, Sanchez V, et al (1999). Educational level, voluntary private health insurance and opportunistic cancer screening among women in Catalonia (Spain). Eur J Cancer Prev, 8, 427-34.
Chamot E, Charvet AI, Perneger TV (2007). Who gets screened, and where: a comparison of organised and opportunistic mammography screening in Geneva, Switzerland. Eur J Cancer, 43, 576-84.
Cho J, Guallar E, Hsu YJ, et al (2010). A comparison of cancer screening practices in cancer survivors and in the general population: the Korean national health and nutrition examination survey (KNHANES) 2001-2007. Cancer Causes Control, 21, 2203-12.