Submitted 15 February 2019 Accepted 29 August 2019 Published 1 October 2019 Corresponding author Kyo Chul Koo, [email protected] Academic editor
Ferdinand Frauscher Additional Information and Declarations can be found on page 11
DOI 10.7717/peerj.7795
Copyright 2019 Park et al. Distributed under
Creative Commons CC-BY 4.0
OPEN ACCESS
The association of depression with
lower urinary tract symptoms: data
from the National Health and Nutrition
Examination Survey, 2005–2008
Jee Soo Park, Won Sik Ham, Chang Hee Hong, Byung Ha Chung and Kyo Chul Koo
Department of Urology, Yonsei University College of Medicine, Seoul, Republic of Korea
ABSTRACT
Background. To identify the factors associated with lower urinary tract symptoms (LUTS), we investigated associations between psychological factors, including de-pression and sleep disorders, and LUTS using the National Health and Nutrition Examination Survey (NHANES) database.
Materials and Methods. The NHANES database was examined for the period of 2005 to 2008. Men older than 40 years, who had completed questionnaires surveying their kidney/urologic, prostate, mental health, and sleep conditions were included in this study. LUTS was defined as the presence of two or more of the following symptoms: incomplete emptying, urinary hesitancy, urinary frequency, and nocturia. Multivariable models using logistic regression were used to compare groups of men with or without LUTS.
Results. Of 1,820 participants, 110 (6.1%) men reported depression, and 235 (12.9%) presented with LUTS. Men with LUTS were older and had a significantly higher prevalence of depression and unemployment. Sleep disorder was not associated with LUTS. Multivariable logistic regression models demonstrated that men reporting moderate depression had the highest age-adjusted odds (odds ratio = 5.89, 95% CI [3.44–10.11]; p< 0.001) of reporting clinical LUTS.
Conclusions. A significant association was observed between LUTS and depression, and between LUTS and employment status. Although the pathophysiology of these relationships is unclear, physicians should consider multi-disciplinary evaluation and treatment approaches for LUTS.
SubjectsPsychiatry and Psychology, Urology
Keywords Lower urinary tract symptoms, Depression, NHANES
INTRODUCTION
Lower urinary tract symptoms (LUTS) are common in aging men, with approximately 80.0% of men experiencing at least one urinary symptom by the age of 80 (Wei, Calhoun & Jacobsen, 2005). Treatment of LUTS is a substantial financial burden on the United States healthcare system (Hu et al., 2004). Moreover, LUTS has been found to have a significant negative impact on quality of life in several studies (Coyne et al., 2009;Robertson et al., 2007). Although LUTS is highly prevalent, poses an economic burden, and adversely
How to cite this articlePark JS, Ham WS, Hong CH, Chung BH, Koo KC. 2019. The association of depression with lower urinary tract symptoms: data from the National Health and Nutrition Examination Survey, 2005–2008. PeerJ 7:e7795http://doi.org/10.7717/peerj.7795
affects quality of life, few treatment modalities for it exist, and although pharmacologic interventions are considered first-line therapy,Cindolo et al. (2015) reported that only 29.0% of patients use these drugs for 1 year, indicating that adherence to these medications is poor.
Most medications for LUTS focus on solving bladder outlet obstruction resulting from hypertrophy of the prostate. However, there are multifactorial causes of LUTS development, and the often reported ineffectiveness of pharmacologic therapies implies that the cause of LUTS is not always prostate-centric (Kakizaki & Koyanagi, 2000). Indeed, a variety of factors have been reported to be associated with the development and progression of LUTS, including age-dependent structural and functional changes in the bladder and urethra, neurological and hormonal changes, diabetes and obesity, psychological and behavioral changes, and alterations in sleep patterns (Kakizaki & Koyanagi, 2000;Helf et al., 2011;Helf et al., 2012;Tam, Helfand & Erickson, 2017).
Several studies have reported on associations between psychological factors and LUTS. Most studies have focused on depression, which has been widely reported to be associated with LUTS (Coyne et al., 2009;Hakkinen et al., 2008;Laumann et al., 2008;Steers, Litman & Rosen, 2008;Fitzgerald et al., 2007). A few have reported an association between sleep disorders and the development of nocturia. A recent study reported a relationship between sleep disorders and LUTS (Fantus et al., 2018).
To our knowledge, this is the first study to thoroughly investigate factors associated with LUTS from the National Health and Nutrition Examination Survey (NHANES), 2007–2008, which is a large, cross-sectional dataset that is representative of the United States population. We investigated demographic differences and psychological factors, such as depression and sleep disorders, in patients with LUTS in order to identify dominant factors associated with LUTS.
MATERIALS & METHODS
Data source
The NHANES is a cross-sectional observational study that collects health-related information using a complex, stratified, multistage, probability cluster design representative of the general non-institutionalized United States population. The Institutional Review Board of the National Center for Health Statistics approved the protocol, and all participants provided written informed consent to the National Center for Health Statistics. This study included datasets for 2005–2006 and 2007–2008, as only these datasets contained information related to both urinary symptoms and psychological factors including depression and sleep disorders.
Study population
We included men aged 40 years or older who completed questionnaires surveying the following: kidney/urologic conditions, prostate conditions, mental health conditions, and sleep conditions. We excluded all men with prostate disease, including prostate cancer (15,839 patients), men with stroke who had comorbidities associated with neurogenic
bladder (127 patients), and those with missing data (2,019 patients), leaving 1,820 eligible participants.
LUTS
Several questions were used to assess LUTS including the following: (1) After urinating, does your bladder feel empty? (responses: yes/no, incomplete emptying); (2) Do you usually have trouble starting to urinate? (yes/no, hesitancy); (3) How often do you have urinary leakage? (defined as not able to hold urine until reaching a toilet at least once a month, urinary frequency); (4) How many times per night do you usually get up to urinate? (defined as waking at least twice per night to urinate, nocturia). Daytime LUTS was defined as the presence of more than one of the symptoms surveyed in questions 1–3. Clinical LUTS was defined as the presence of any two or more of the surveyed symptoms (questions 1–4).
Depression
Depression was measured using the Nine-item Patient Health Questionnaire (PHQ-9) depression scale, a nine-item screener that asks questions about the frequency of symptoms of depression scored from 0 to 27, and that is widely used in both clinical and research settings (Kroenke & Spitzer, 2002). A PHQ-9 score of 10 or greater was used as a cutoff for identifying major depression (sensitivity 88.0% and specificity 88.0%) (Kroenke & Spitzer, 2002). Depression scores were categorized into four groups: minimal (<5), mild (5–9), moderate to moderately severe (10–14), and moderately severe to severe (≥15). The validity and reliability of PHQ and its nine-item depression module in depressive diagnosis and grade of severity have been widely documented (Kroenke, Spitzer & Williams, 2001; Kroenke et al., 2010;Spitzer, Kroenke & Williams, 1999;Spitzer et al., 2000).
Other measurements
All participants were asked about age, race/ethnicity (non-Hispanic white, non-Hispanic black, Mexican American, or those who selected multiple races or other racial/ethnic groups), educational attainment (less than a high school diploma, high school graduate, or education beyond high school), household income (poverty income ratio [PIR], PIR <1, 1 ≤PIR<3, or PIR ≥3), married or living with a partner (yes or no), employment (yes or no), health insurance status (yes or no), smoking status (current, former, or never), and binge drinker (defined as having ever consumed ≥5 drinks of any kind of alcoholic beverage almost every day; yes or no). A prior self-reported history of coronary artery disease (CAD), congestive heart failure (CHF), chronic obstructive pulmonary disease (COPD), including emphysema and/or chronic bronchitis, and malignancies were included.
Hypertension was defined as the use of antihypertensive medication or a reported blood pressure of 140/90 mmHg or higher. Blood pressure was measured using a mercury sphygmomanometer. Diabetes was defined as a self-reported previous diagnosis of the disease by a healthcare provider or a hemoglobin A1clevel of 6.5% or greater (the diagnostic
criterion for diabetes according to theAmerican Diabetes Association 2010).
Height and weight were measured in a medical examination center, and body mass index (BMI) was calculated as weight in kilograms divided by height in meters squared.
Participants were divided into three BMI groups: normal weight or underweight (BMI <25 kg/m2), overweight (BMI = 25 to <30 kg/m2), and obese (BMI ≥30 kg/m2).
A subject was considered to have a sleep disorder if they answered ‘‘yes’’ to the question ‘‘Have you been diagnosed as having a sleep disorder?’’
Statistical analysis
Data are reported as means ± standard deviations (SDs) for continuous variables and for categorical variables, data are reported as percentages. Since the size of the study population was large enough to represent the US population and the values were not skewed in clinical perspective, t-tests were used to compare continuous variables, and chi-square test was used to compare categorical variables in univariable analysis. Multivariable logistic regression models were used for multivariable analysis, including all risk factors that were significant in univariable analysis. Multicollinearity was measured using variance inflation factor (VIF) for 12 independent variables used in multivariable logistic regression models and VIFs were less than 2, showing that there was no problem with multicollinearity (DeMaris, 2004).
A model of multivariable logistic regression analysis was used to evaluate the association between the severity of depression and LUTS (clinical LUTS, daytime LUTS, and individual symptoms of incomplete bladder emptying, urinary hesitancy, urinary frequency, and nocturia) after adjusting for potential confounding factors. We evaluated the odds ratios (ORs) and 95% confidence intervals (CIs) of reporting clinical LUTS and individual symptoms after adjusting for potential confounders in two models: first, we added age and then we adjusted models for educational attainment, household income, employment, binge drinking, smoking status, hypertension, diabetes, CAD, CHF, COPD, and cancer. As LUTS is not common disease entity, we used ORs to estimate relative risks.
SPSS software, version 23.0 (SPSS Inc., Chicago, IL, USA) was used to conduct all statistical analyses, and all statistical tests were two-tailed. P-values <0.05 were considered statistically significant.
RESULTS
Baseline characteristics
Baseline characteristics of the study population are shown inTable 1. The mean ±SD age of the participants was 56.9 ± 11.8 years. Their mean ±SD BMI was 28.9 ± 6.1 kg/m2, and 77.0% were included in the overweight or obese group. Overall, 30.0% of the participants had an educational level of less than a high school diploma, and 58.8% were currently working. Moreover, 25.1% were current smokers, and 27.4% were binge drinkers. The prevalences of hypertension and diabetes were 49.5% and 14.2%, respectively. In the 2005–2008 sample, 6.1% of participants had depression (PHQ-9 score ≥10). Among participants, 25.2% had daytime LUTS and 12.9% had clinical LUTS.
Factors associated with daytime LUTS
Men with daytime LUTS were significantly older and had higher prevalences of cigarette smoking, hypertension, CAD, CHF, COPD, and depression, whereas their household
Table 1 Characteristics of the study population. Study population (n = 1,820) Age (years) 56.9 ± 11.8 Race/ethnicity (%) Non-Hispanic white 968 (53.2%) Non-Hispanic black 352 (19.3%) Mexican American 316 (17.4%) Other 184 (10.1%) Height (cm) 174.4 ± 7.6 Weight (kg) 88.2 ± 20.2 BMI (kg/m2) 28.9 ± 6.1 BMIa(%)
Normal weight or underweight 419 (23.0%)
Overweight 773 (42.5%)
Obese 628 (34.5%)
SBP (mmHg) 129.6 ± 18.8
DBP (mmHg) 73.9 ± 13.2
Education <High school (%) 546 (30.0%)
Household income, PIR (%)
PIR<1 289 (15.9%)
1 ≤PIR<3 713 (39.2%)
PIR ≥3 818 (44.9%)
Currently working (%) 1071 (58.8%)
Married or living with partner (%) 1325 (72.8%)
Insured (%) 1465 (80.5%) Binge drinkerb(%) 498 (27.4%) Cigarette smoking (%) Current 456 (25.1%) Past 664 (36.5%) Never 700 (38.5%) Hypertensionc(%) 900 (49.5%) Diabetesd(%) 259 (14.2%) CAD (%) 133 (7.3%) CHF (%) 82 (4.5%) COPD (%) 144 (7.9%) Cancer (%) 129 (7.1%) Sleep disorder (%) 158 (8.7%) Depression (%) Mild (PHQ-9 Score of 5-9) 212 (11.6%) Moderate (PHQ-9 Score of 10-14) 72 (4.0%)
Moderately Severe to Severe (PHQ-9 Score of ≥ 15) 38 (2.1%)
(continued on next page)
Table 1(continued)
Study population (n = 1,820)
Daytime LUTS (%) 459 (25.2%)
Clinical LUTS (%) 235 (12.9%)
Notes.
Data are presented as mean ± SD for continuous variables and percentages for categorical variables.
SD standard deviation, BMI body mass index, CAD coronary artery disease, CHF congestive heart failure, COPD chronic obstructive pulmonary disease, DBP diastolic blood pressure, SBP systolic blood pressure, PHQ-9 9-item patient health questionnaire, PIR poverty to income ratio, LUTS lower urinary tract symptoms.
aBMI was divided into three groups: normal weight or underweight (BMI< 25 kg/m2), overweight (BMI = 25 to< 30 kg/m2), and obese (BMI ≥30 kg/m2). bDefined as having ever consumed five drinks or more of any kind of alcoholic beverage almost every day.
cDefined as use of antihypertensive medication or a reported blood pressure ≥140/90 mmHg. dDefined as self-reported diabetes diagnosed by a health professional (all adults) or a hemoglobin A
1clevel ≥6.5%.
income and employment level were significantly lower than those of men without LUTS (Table 2).
Factors associated with clinical LUTS
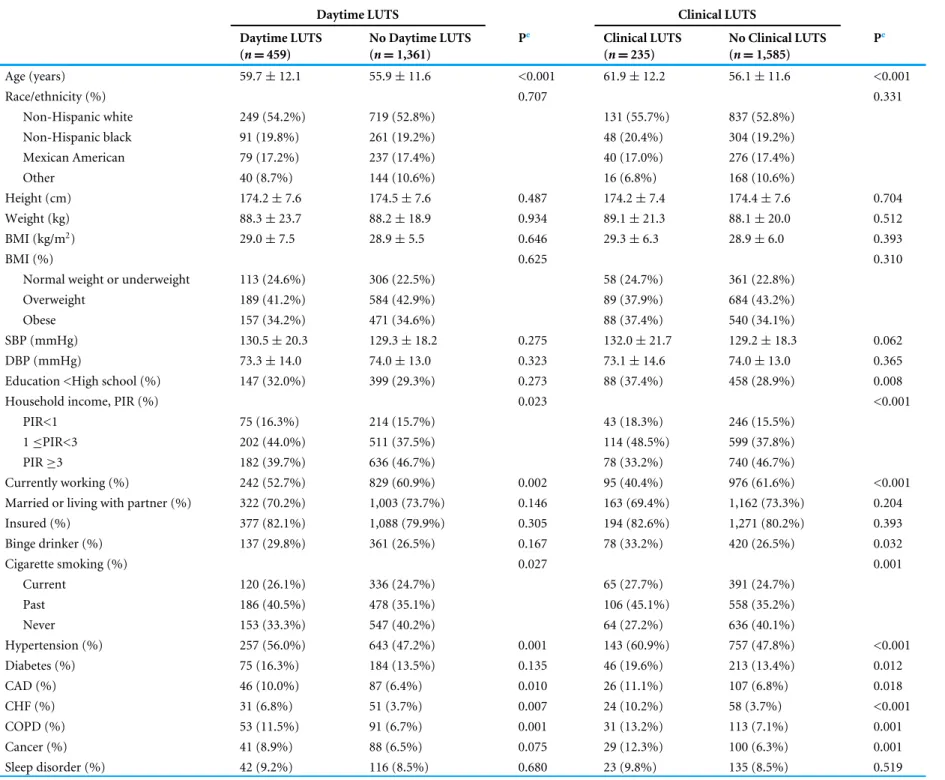
The characteristics of men with and without clinical LUTS were also compared (Table 2). Age, household income, employment status, cigarette smoking, hypertension, CAD, CHF, COPD, depression, educational attainment, binge drinking, diabetes, and cancer were significantly associated with clinical LUTS in univariable analysis.
Association between PHQ-9 score and clinical LUTS
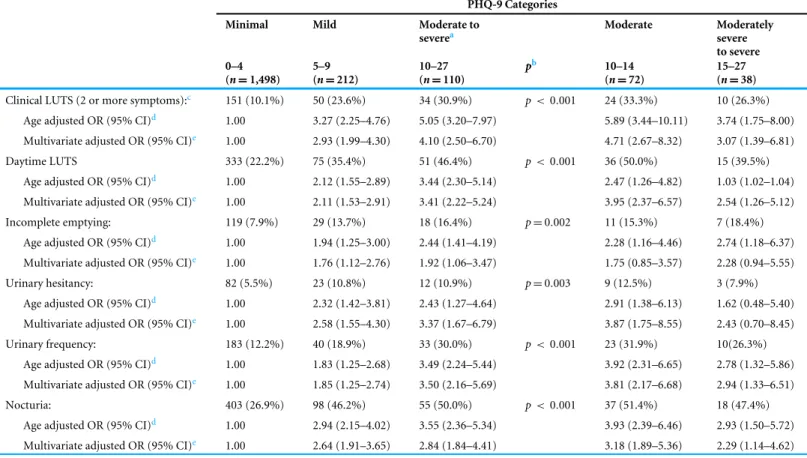
Logistic regression analyses were performed to examine the association between LUTS and depression (Table 3). With clinical LUTS (two or more symptoms) as the outcome, participants reporting moderate to severe depression had the highest ORs of those reporting LUTS. In the age-adjusted model, moderate to severe depression was significantly associated with clinical LUTS (OR = 5.05, 95% CI [3.20–7.97]). Similar results were observed (OR = 4.10, 95% CI [2.50–6.70]) in the multivariable adjusted model, which was adjusted for factors that were significantly different between men with and without clinical LUTS. When examining individual LUTS (incomplete emptying, urinary hesitancy, urinary frequency, and nocturia), depression was associated with increased risk of each LUTS. Participants with major depression (PHQ-9 score ≥10) were further divided into two groups: (1) moderate depression and (2) moderately severe to severe depression. The logistic regression model showed that the moderate depression group showed higher odds (OR = 5.89, 95% CI [3.44–10.11]) with clinical LUTS, and individual LUTSs, except incomplete emptying, than the moderately severe to severe depression group (OR = 3.74, 95% CI [1.75–8.00]).
DISCUSSION
In our study, daytime LUTS and clinical LUTS were significantly associated with age, employment status, and depression. We also found that men with greater depression scores were more likely to have LUTS, with the exception of those in the most severe depression group. We modeled LUTS evaluated its association with severity of depression. While treatment of LUTS in men has been mainly prostate-centric, our study suggests that multiple factors might be involved in the development of LUTS and that this
Table 2 Characteristics of the study population according to daytime and clinical LUTS.
Daytime LUTS Clinical LUTS
Daytime LUTS No Daytime LUTS Pe Clinical LUTS No Clinical LUTS Pe
(n = 459) (n = 1,361) (n = 235) (n = 1,585) Age (years) 59.7 ± 12.1 55.9 ± 11.6 <0.001 61.9 ± 12.2 56.1 ± 11.6 <0.001 Race/ethnicity (%) 0.707 0.331 Non-Hispanic white 249 (54.2%) 719 (52.8%) 131 (55.7%) 837 (52.8%) Non-Hispanic black 91 (19.8%) 261 (19.2%) 48 (20.4%) 304 (19.2%) Mexican American 79 (17.2%) 237 (17.4%) 40 (17.0%) 276 (17.4%) Other 40 (8.7%) 144 (10.6%) 16 (6.8%) 168 (10.6%) Height (cm) 174.2 ± 7.6 174.5 ± 7.6 0.487 174.2 ± 7.4 174.4 ± 7.6 0.704 Weight (kg) 88.3 ± 23.7 88.2 ± 18.9 0.934 89.1 ± 21.3 88.1 ± 20.0 0.512 BMI (kg/m2) 29.0 ± 7.5 28.9 ± 5.5 0.646 29.3 ± 6.3 28.9 ± 6.0 0.393 BMI (%) 0.625 0.310
Normal weight or underweight 113 (24.6%) 306 (22.5%) 58 (24.7%) 361 (22.8%)
Overweight 189 (41.2%) 584 (42.9%) 89 (37.9%) 684 (43.2%)
Obese 157 (34.2%) 471 (34.6%) 88 (37.4%) 540 (34.1%)
SBP (mmHg) 130.5 ± 20.3 129.3 ± 18.2 0.275 132.0 ± 21.7 129.2 ± 18.3 0.062
DBP (mmHg) 73.3 ± 14.0 74.0 ± 13.0 0.323 73.1 ± 14.6 74.0 ± 13.0 0.365
Education <High school (%) 147 (32.0%) 399 (29.3%) 0.273 88 (37.4%) 458 (28.9%) 0.008
Household income, PIR (%) 0.023 <0.001
PIR<1 75 (16.3%) 214 (15.7%) 43 (18.3%) 246 (15.5%)
1 ≤PIR<3 202 (44.0%) 511 (37.5%) 114 (48.5%) 599 (37.8%)
PIR ≥3 182 (39.7%) 636 (46.7%) 78 (33.2%) 740 (46.7%)
Currently working (%) 242 (52.7%) 829 (60.9%) 0.002 95 (40.4%) 976 (61.6%) <0.001 Married or living with partner (%) 322 (70.2%) 1,003 (73.7%) 0.146 163 (69.4%) 1,162 (73.3%) 0.204
Insured (%) 377 (82.1%) 1,088 (79.9%) 0.305 194 (82.6%) 1,271 (80.2%) 0.393 Binge drinker (%) 137 (29.8%) 361 (26.5%) 0.167 78 (33.2%) 420 (26.5%) 0.032 Cigarette smoking (%) 0.027 0.001 Current 120 (26.1%) 336 (24.7%) 65 (27.7%) 391 (24.7%) Past 186 (40.5%) 478 (35.1%) 106 (45.1%) 558 (35.2%) Never 153 (33.3%) 547 (40.2%) 64 (27.2%) 636 (40.1%) Hypertension (%) 257 (56.0%) 643 (47.2%) 0.001 143 (60.9%) 757 (47.8%) <0.001 Diabetes (%) 75 (16.3%) 184 (13.5%) 0.135 46 (19.6%) 213 (13.4%) 0.012 CAD (%) 46 (10.0%) 87 (6.4%) 0.010 26 (11.1%) 107 (6.8%) 0.018 CHF (%) 31 (6.8%) 51 (3.7%) 0.007 24 (10.2%) 58 (3.7%) <0.001 COPD (%) 53 (11.5%) 91 (6.7%) 0.001 31 (13.2%) 113 (7.1%) 0.001 Cancer (%) 41 (8.9%) 88 (6.5%) 0.075 29 (12.3%) 100 (6.3%) 0.001 Sleep disorder (%) 42 (9.2%) 116 (8.5%) 0.680 23 (9.8%) 135 (8.5%) 0.519
(continued on next page)
P ark e t al. (2019), P eerJ , DOI 10.7717/peerj.7795 7/14
Table 2(continued)
Daytime LUTS Clinical LUTS
Daytime LUTS No Daytime LUTS Pe Clinical LUTS No Clinical LUTS Pe
(n = 459) (n = 1,361) (n = 235) (n = 1,585)
Depression (%) <0.001 <0.001
Mild (PHQ-9 Score of 5–9) 75 (16.3%) 137 (10.1%) 50 (21.3%) 162 (10.2%)
Moderate (PHQ-9 Score of 10–14) 36 (7.8%) 36 (2.6%) 24 (10.2%) 48 (3.0%) Moderately Severe to Severe (PHQ-9 Score of ≥ 15) 15 (3.3%) 23 (1.7%) 10 (4.3%) 28 (1.8%)
Notes.
Data are presented as mean ± SD for continuous variables and percentages for categorical variables.
BMI body mass index, CAD coronary artery disease, CHF congestive heart failure, CI confidence interval, COPD chronic obstructive pulmonary disease, DBP diastolic blood pressure, OR odds ratio, SBP systolic blood pressure, PHQ-9 9-item patient health questionnaire, PIR poverty to income ratio, LUTS lower urinary tract symptoms.
aBMI was divided into three groups: normal weight or underweight (BMI<25 kg/m2), overweight (BMI = 25 to<30 kg/m2), and obese (BMI ≤30 kg/m2). bDefined as having ever consumed five drinks or more of any kind of alcoholic beverage almost every day.
cDefined as use of antihypertensive medication or a reported blood pressure ≥140/90 mmHg. dDefined as self-reported diabetes diagnosed by a health professional (all adults) or a hemoglobin A
1clevel ≥6.5%. eP-value calculated using the t -test (continuous data) or chi-square test (categorical data).
P ark e t al. (2019), P eerJ , DOI 10.7717/peerj.7795 8/14
Table 3 Association between the PHQ-9 score and LUTS.
PHQ-9 Categories
Minimal Mild Moderate to
severea Moderate Moderately severe to severe 0–4 5–9 10–27 pb 10–14 15–27 (n = 1,498) (n = 212) (n = 110) (n = 72) (n = 38)
Clinical LUTS (2 or more symptoms):c 151 (10.1%) 50 (23.6%) 34 (30.9%) p< 0.001 24 (33.3%) 10 (26.3%)
Age adjusted OR (95% CI)d 1.00 3.27 (2.25–4.76) 5.05 (3.20–7.97) 5.89 (3.44–10.11) 3.74 (1.75–8.00)
Multivariate adjusted OR (95% CI)e 1.00 2.93 (1.99–4.30) 4.10 (2.50–6.70) 4.71 (2.67–8.32) 3.07 (1.39–6.81)
Daytime LUTS 333 (22.2%) 75 (35.4%) 51 (46.4%) p< 0.001 36 (50.0%) 15 (39.5%)
Age adjusted OR (95% CI)d 1.00 2.12 (1.55–2.89) 3.44 (2.30–5.14) 2.47 (1.26–4.82) 1.03 (1.02–1.04)
Multivariate adjusted OR (95% CI)e 1.00 2.11 (1.53–2.91) 3.41 (2.22–5.24) 3.95 (2.37–6.57) 2.54 (1.26–5.12)
Incomplete emptying: 119 (7.9%) 29 (13.7%) 18 (16.4%) p =0.002 11 (15.3%) 7 (18.4%)
Age adjusted OR (95% CI)d 1.00 1.94 (1.25–3.00) 2.44 (1.41–4.19) 2.28 (1.16–4.46) 2.74 (1.18–6.37)
Multivariate adjusted OR (95% CI)e 1.00 1.76 (1.12–2.76) 1.92 (1.06–3.47) 1.75 (0.85–3.57) 2.28 (0.94–5.55)
Urinary hesitancy: 82 (5.5%) 23 (10.8%) 12 (10.9%) p =0.003 9 (12.5%) 3 (7.9%)
Age adjusted OR (95% CI)d 1.00 2.32 (1.42–3.81) 2.43 (1.27–4.64) 2.91 (1.38–6.13) 1.62 (0.48–5.40)
Multivariate adjusted OR (95% CI)e 1.00 2.58 (1.55–4.30) 3.37 (1.67–6.79) 3.87 (1.75–8.55) 2.43 (0.70–8.45)
Urinary frequency: 183 (12.2%) 40 (18.9%) 33 (30.0%) p< 0.001 23 (31.9%) 10(26.3%)
Age adjusted OR (95% CI)d 1.00 1.83 (1.25–2.68) 3.49 (2.24–5.44) 3.92 (2.31–6.65) 2.78 (1.32–5.86)
Multivariate adjusted OR (95% CI)e 1.00 1.85 (1.25–2.74) 3.50 (2.16–5.69) 3.81 (2.17–6.68) 2.94 (1.33–6.51)
Nocturia: 403 (26.9%) 98 (46.2%) 55 (50.0%) p< 0.001 37 (51.4%) 18 (47.4%)
Age adjusted OR (95% CI)d 1.00 2.94 (2.15–4.02) 3.55 (2.36–5.34) 3.93 (2.39–6.46) 2.93 (1.50–5.72)
Multivariate adjusted OR (95% CI)e 1.00 2.64 (1.91–3.65) 2.84 (1.84–4.41) 3.18 (1.89–5.36) 2.29 (1.14–4.62)
Notes.
CI confidence interval, OR odds ratio, LUTS lower urinary tract symptoms, PHQ-9 9-item Patient Health Questionnaire.
aModerate to severe group for which a PHQ-9 score ≥10 was defined as the major depression group.
bDifferences of prevalence of LUTS between minimal, mild, and moderate to severe group was analyzed using the chi-square test.
bReported as at least 2 of 4 LUTS (incomplete bladder emptying, trouble starting to urinate, urinary frequency, and nocturia defined as 2 or more voids per night). This analysis
included only those men with no clinical LUTS or 2 or more LUTS reported.
cAdjusted for age in years.
dAdjusted for age in years, educational attainment, household income, employment, binge drinking, smoking status, hypertension, diabetes, coronary artery disease, congestive
heart failure, chronic obstructive pulmonary disease, and cancer.
urologic manifestation could be considered a socioeconomic and systemic disease with psychological etiologies. We are planning future studies to determine whether reducing levels of depression by medication would help symptoms of LUTS. This future study would highlight the role of psychological treatment in LUTS if depression exists.
An association between depression and LUTS has been reported in several cross-sectional studies (Coyne et al., 2009;Fitzgerald et al., 2007; Asplund et al., 2004; Wong et al., 2010). Furthermore, a prospective study byHakkinen et al. (2008)reported that depressive symptoms increase the incidence of nocturia. This relationship can be explained psychologically. LUTS reduces quality of life (Coyne et al., 2009;Robertson et al., 2007) and can result in embarrassment, social anxiety, and demoralization (Breyer et al., 2014). Indeed, men with LUTS report decreased self-esteem since they perceive it as a weakness and part of the aging process (Wong et al., 2010). Nocturia may cause daytime drowsiness and decrease concentration and activity levels, all of which could lead to an increased risk for the development and progression of depression.
Several molecular pathogeneses of an association between depression and LUTS have been proposed. Steers et al. postulated that a defect in serotonin synthesis is associated with the development of depression and abnormal voiding dysfunction. Increased adrenergic tone and the hypothalamic-pituitary axis have been proposed as a mediator of depression in LUTS (Laumann et al., 2008; Steers, Litman & Rosen, 2008). Furthermore, Klausner & Steers (2004) suggested that stress-induced depression activates the corticotropin-releasing factor pathway, which functions as a mediator of emotional influences on bladder function. Moreover, inflammation represents a common mechanism in the pathogenesis of major depression and LUTS (Miller, Maletic & Raison, 2009;Johnson et al., 2010). Patients with depression frequently exhibit increased levels of C-reactive protein, tumor necrosis factor-alpha, and interleukin-6 (Miller, Maletic & Raison, 2009). Our results showed that depressed patients (PHQ-9 score ≥ 10) had higher levels of C-reactive protein (0.62 ± 1.23 mg/dL) than those without (0.40 ± 0.77 mg/dL); however, the difference was not statistically significant.
Contrary to a previous study that reported that men with greater depression scores were more likely to have LUTS (Breyer et al., 2014), our results showed that patients with the greatest depression scores were less likely to have LUTS than those with moderate depression.Breyer et al. (2014)defined the depression group as those with a PHQ-9 score ≥10. In our study, we further divided the depression group into a moderate group and a moderately severe to severe group. The moderate depression group showed higher odds with clinical LUTS (OR = 5.89, 95% CI [3.44–10.11]) and individual symptoms of LUTS, except incomplete emptying, compared to the moderately severe to severe depression group (OR = 3.74, 95% CI [1.75–8.00]). This implies that clinical LUTS may not be proportionally associated with the severity of depression. Although its pathogenesis is unclear, the aforementioned molecular pathogenesis might not be feasibly true since if molecular pathways are involved in mediating depression and LUTS, both severity levels of depression and LUTS should be proportionally elevated. This finding implies the existence of unaccounted pathogeneses that mediates LUTS.
Our results showed that there was no significant association between sleep disorders and daytime or clinical LUTS. However, a recent study reported that men with sleep disorders are significantly more likely to report both nocturia and daytime LUTS (Fantus et al., 2018). Sleep disorders increase the risk of daytime urinary symptoms including voiding and storage symptoms (Helf et al., 2011), whereas the improvement of LUTS has been associated with an improvement in sleep disorders (Helf et al., 2012). Although the proportion of men with sleep disorders was higher in the group with daytime and clinical LUTS, the sleep disorder itself might not be a factor associated with LUTS, rather a secondary feature of LUTS.
A cross-sectional study in six European countries reported that men with overactive bladder symptoms were more likely than women to report that overactive bladder symptoms had an impact on their daily work life (Irwin et al., 2006). Over 21.0% of the study population reported being worried about an interruption of meetings owing to urinary frequency, and 3.0% of the population changed or quit their jobs due to bladder control problems. This study reported a negative association of LUTS on employment
issues, which is similar to our results. To our knowledge, our study is the first to report a negative association for LUTS on employment in a United States population.
This study has several limitations. First, due to the limitations of its cross-sectional design, a causal relationship could not be established. Second, measurement of the severity of LUTS was limited due to the lack of data of the International Prostate Symptom Score (IPSS). A comparison between the IPSS and PHQ-9 score may have provided more detailed information regarding the association between LUTS and depression. Third, medical conditions were assessed based on self-reporting. Therefore, some of the information for the comorbid conditions might not be accurate. Fourth, treatments for the depression and sleep disorders were not documented. Fifth, due to the retrospective analysis, the adequacy of the sample size could not be checked. Sixth, we did not consider sampling weights since our purpose was to study relations in a large community sample, rather than estimate national prevalence rates. Therefore, we did not use sampling weights in our calculations (Farmer et al., 1988). Seventh, we considered that the size of the study population was large enough to represent the US population and the values were not skewed in clinical perspective; therefore, we used geometric means and SDs and t-tests in univariable analysis. Finally, voiding diaries were not included in the NHANES datasets, which deferred the differential diagnosis of nocturnal polyuria and other causes of nocturia.
CONCLUSIONS
Our study revealed significant associations for depression and employment statuswith clinical and daytime LUTS. The cause of LUTS is multifactorial, and psychological factors seem to be significantly associated therewith. Therefore, patients presenting with LUTS should be screened for multi-factorial etiologies using a psychological evaluation for a successful multidisciplinary treatment approach.
ADDITIONAL INFORMATION AND DECLARATIONS
Funding
The authors received no funding for this work.
Competing Interests
The authors declare there are no competing interests.
Author Contributions
• Jee Soo Park conceived and designed the experiments, performed the experiments, analyzed the data, contributed reagents/materials/analysis tools, prepared figures and/or tables, authored or reviewed drafts of the paper, approved the final draft.
• Won Sik Ham analyzed the data.
• Chang Hee Hong performed the experiments.
• Byung Ha Chung authored or reviewed drafts of the paper, approved the final draft. • Kyo Chul Koo conceived and designed the experiments, analyzed the data, authored or
reviewed drafts of the paper, approved the final draft.
Human Ethics
The following information was supplied relating to ethical approvals (i.e., approving body and any reference numbers):
The Institutional Review Board of the National Center for Health Statistics approved the original protocol. The NHANES data has been already approved by the NCS ethical board.
Specific IRB is not required for this specific study.
Data Availability
The following information was supplied regarding data availability:
NHANES datasets for 2005–2006 and 2007–2008 are available at the Centers for Disease Control and Prevention:https://wwwn.cdc.gov/nchs/nhanes/continuousnhanes/default.
aspx?BeginYear=2005.
https://wwwn.cdc.gov/nchs/nhanes/continuousnhanes/default.aspx?BeginYear=2007.
REFERENCES
American Diabetes Association. 2010. Diagnosis and classification of diabetes mellitus (published correction appears in Diabetes Care 2010; 33(4):e57). Diabetes Care 33(4):S62–S69DOI 10.2337/dc09-2368.
Asplund R, Henriksson S, Johansson S, Isacsson G. 2004. Nocturia and depression. BJU
International93:1253–1256DOI 10.1111/j.1464-410X.2004.04835.x.
Breyer BN, Kenfield SA, Blaschko SD, Erickson BA. 2014. The association of lower urinary tract symptoms, depression and suicidal ideation: data from the 2005– 2006 and 2007–2008 National Health and Nutrition Examination Survey. Journal
d Urologie191:1333–1339DOI 10.1016/j.juro.2013.12.012.
Cindolo L, Pirozzi L, Fanizza C, Romero M, Tubaro A, Autorino R, De Nunzio C, Schips L. 2015. Drug adherence and clinical outcomes for patients under phar-macological therapy for lower urinary tract symptoms related to benign prostatic hyperplasia: population-based cohort study. European Urology 68:418–425
DOI 10.1016/j.eururo.2014.11.006.
Coyne KS, Wein AJ, Tubaro A, Sexton CC, Thompson CL, Kopp ZS, Aiyer LP. 2009. The burden of lower urinary tract symptoms: evaluating the effect of LUTS on health-related quality of life, anxiety and depression: EpiLUTS. BJU International 103(Suppl 3):4–11.
DeMaris A. 2004. Regression with social data: modeling continuous and limited response
variables. Hoboken: John Wiley & Sons, 417.
Fantus RJ, Packiam VT, Wang CH, Erickson BA, Helfand BT. 2018. The relationship between sleep disorders and lower urinary tract symptoms: results from the Na-tional Health and Nutrition Examination Survey (NHANES). Journal d Urologie 18:30178–2.
Farmer ME, Locke BZ, Mościcki EK, Dannenberg AL, Larson DB, Radloff LS. 1988. Physical activity and depressive symptoms: the NHANES I epidemi-ologic follow-up study. American Journal of Epidemiology 128:1340–1351
DOI 10.1093/oxfordjournals.aje.a115087.
Fitzgerald MP, Link CL, Litman HJ, Travison TG, McKinlay JB. 2007. Beyond the lower urinary tract: the association of urologic and sexual symptoms with common illnesses. European Urology 52:407–415DOI 10.1016/j.eururo.2007.03.014.
Hakkinen JT, Shiri R, Koskimaki , Tammela TL, Auvinen A, Hakama M. 2008. Depres-sive symptoms increase the incidence of nocturia: Tampere Aging Male Urologic Study (TAMUS). Journal d Urologie 179:1897–1901DOI 10.1016/j.juro.2008.01.037. Helf BT, Lee JY, Sharp V, Foster H, Naslund M, Williams OD, McVary KT, CAMUS
Study Group. 2012. Associations between improvements in lower urinary tract symptoms and sleep disturbance over time in the CAMUS trial. Journal d Urologie 188:2288–2293DOI 10.1016/j.juro.2012.07.104.
Helf BT, McVary KT, Meleth S, Sharp V, Foster H, Naslund M, Williams OD, CAMUS Study Group. 2011. The relationship between lower urinary tract symptom severity and sleep disturbance in the CAMUS trial. Journal d Urologie 185:2223–2228
DOI 10.1016/j.juro.2011.02.012.
Hu TW, Wagner TH, Bentkover JD, Leblanc K, Zhou SZ, Hunt T. 2004. Costs of urinary incontinence and overactive bladder in the United States: a comparative study.
Urology63:461–465 DOI 10.1016/j.urology.2003.10.037.
Irwin DE, Milsom I, Kopp Z, Abrams P, Cardozo L. 2006. Impact of overactive bladder symptoms on employment, social interactions and emotional well-being in six Euro-pean countries. BJU International 97:96–100DOI 10.1111/j.1464-410X.2005.05889.x. Johnson TV, Abbasi A, Ehrlich SS, Kleris RS, Chirumamilla SL, Schoenberg ED,
Owen-Smith A, Raison CL, Master VA. 2010. Major depression drives severity of American Urological Association Symptom Index. Urology 76:1317–1320.
Kakizaki H, Koyanagi T. 2000. Current view and status of the treatment of lower urinary tract symptoms and neurogenic lower urinary tract dysfunction. BJU International 85:25–30DOI 10.1046/j.1464-410X.2000.00060.x.
Klausner AP, Steers WD. 2004. Corticotropin releasing factor: a mediator of emo-tional influences on bladder function. Journal d Urologie 172(6 Pt 2):2570–2573
DOI 10.1097/01.ju.0000144142.26242.f3.
Kroenke K, Spitzer RL. 2002. The PHQ-9: a new depression diagnostic and severity measure. Psychiatric Annals 32(9):509–515DOI 10.3928/0048-5713-20020901-06. Kroenke K, Spitzer RL, Williams JB. 2001. The PHQ-9: validity of a brief
depres-sion severity measure. Journal of General Internal Medicine 16(9):606–613
DOI 10.1046/j.1525-1497.2001.016009606.x.
Kroenke K, Spitzer RL, Williams JB, Lo ¨we B. 2010. The patient health questionnaire somatic, anxiety, and depressive symptom scales: a systematic review. General
Hospital Psychiatry32(4):345–359DOI 10.1016/j.genhosppsych.2010.03.006. Laumann EO, Kang JH, Glasser DB, Rosen RC, Carson CC. 2008. Lower
uri-nary tract symptoms are associated with depressive symptoms in white, black
and Hispanic men in the United States. Journal d Urologie 180:233–240
DOI 10.1016/j.juro.2008.03.055.
Miller AH, Maletic V, Raison CL. 2009. Inflammation and its discontents: the role of cytokines in the pathophysiology of major depression. Biological Psychiatry 65:732–741DOI 10.1016/j.biopsych.2008.11.029.
Robertson C, Link CL, Onel E, Mazzetta C, Keech M, Hobbs R, Fourcade R, Kiemeney L, Lee C, Boyle P, McKinlay JB. 2007. The impact of lower urinary tract symptoms and comorbidities on quality of life: the BACH and UREPIK studies. BJU
Interna-tional99:347–354DOI 10.1111/j.1464-410X.2007.06609.x.
Spitzer RL, Kroenke K, Williams JB. 1999. Validation and utility of a self-report version of PRIME-MD: the PHQ primary care study. Primary care evaluation of mental disorders: patient health questionnaire. JAMA 282(18):1737–1744.
Spitzer RL, Williams JB, Kroenke K, Hornyak R, McMurray J. 2000. Validity and utility of the PRIME-MD patient health questionnaire in assessment of 3000 obstetricg-ynecologic patients: the PRIME-MD Patient Health Questionnaire Obstetrics-Gynecology Study. American Journal of Obstetrics and Obstetrics-Gynecology 183(3):759–769
DOI 10.1067/mob.2000.106580.
Steers WD, Litman HJ, Rosen RC. 2008. Overactive bladder, urge incontinence and emotional disorders. AUA Update Series 27:137–147.
Tam CA, Helfand BT, Erickson BA. 2017. The relationship between diabetes, diabetes severity, diabetes biomarkers and the presence of lower urinary tract symptoms: findings from the National Health and Nutrition Examination Survey (NHANES).
Urology105:141–148 DOI 10.1016/j.urology.2017.03.040.
Wei JT, Calhoun E, Jacobsen SJ. 2005. Urologic diseases in America project: benign prostatic hyperplasia. Journal d Urologie 173:1256–1261
DOI 10.1097/01.ju.0000155709.37840.fe.
Wong SY, Woo J, Leung JC, Leung PC. 2010. Depressive symptoms and lifestyle factors as risk factors of lower urinary tract symptoms in Southern Chinese men: a prospective study. Aging Male 13(2):113–119DOI 10.3109/13685530903440432.