Physical Activity and Blood Lead Concentration in Korea: Study Using the Korea National Health and Nutrition Examination Survey (2008-2013)
Physical activity normally has a positive influence on health, however it can be detrimental in the presence of air pollution. Lead, a heavy metal with established adverse health effects, is a major air pollutant. We evaluated the correlation between blood lead concentration and physical activity using data collected from the Korea National Health and Nutrition Examination Survey. Multivariate logistic regression analysis was performed after dividing participants according to whether they were in the top 25% in the
distribution of blood lead concentration (i.e., ≥ 2.76 µg/dL), with physical activity level as an independent variable and adjusting for factors such as age, sex, drinking, smoking, body mass index, region, and occupation. The high physical activity group had greater odds of having a blood lead concentration higher than 2.76 µg/dL (odds ratio 1.29, 95%
CI 1.11-1.51) compared to the low physical activity group. Furthermore, blood lead concentration is correlated with increasing physical activity.
Keywords: Lead; Physical Exertion; Air Pollution; Korea Jeongbae Rhie1 and Hye-Eun Lee2
1Department of Occupational and Environmental Medicine, Dankook University College of Medicine, Cheonan, Korea; 2Department of Occupational and Environmental Medicine, Seoul St. Mary’s Hospital, Seoul, Korea
Received: 27 October 2015 Accepted: 7 March 2016 Address for Correspondence:
Hye-Eun Lee, MD
Department of Occupational and Environmental Medicine, Seoul St. Mary’s Hospital, 222 Banpo-daero, Seocho-gu, Seoul 06951, Korea
E-mail: [email protected]
http://dx.doi.org/10.3346/jkms.2016.31.6.852 • J Korean Med Sci 2016; 31: 852-858
INTRODUCTION
Physical inactivity is the most common cause of health prob- lems worldwide (1). According to Lee et al. (2), 6%-10% of deaths by non-communicable disease are caused by physical inactivi- ty. Hallal et al. (3) suggested that 31.1% of people worldwide do not meet the minimum amount of recommended physical ac- tivity. As such, numerous approaches have been proposed to increase physical activity, including mass media campaigns, community-based informational approaches, behavioral and social approaches, and environmental and policy approaches (4).
However, physical activity may be detrimental to health with high air pollution conditions (5,6). Because exercise increases the ventilation rate, doing it in highly polluted environments can lead to greater inhalation of air pollutants (7). The conse- quent inflammatory reaction from the air pollutants becomes a major cause of adverse health effects (8). Accordingly, there is some controversy on the health effects of outdoor physical ac- tivity (9,10).
Lead is a major air pollutant (11). Lead is a bluish-grey heavy meal that naturally exists in Earth’s crust. It is one of the major non-ferrous metals and has been used for generations for a va- riety of purposes (12). However, lead was ranked second, after arsenic, in the substance priority list proposed by the Agency
for Toxic Substances and Disease Registry in 2013. This list ranks substances according a composite indicator of their frequency, toxicity, and potential for human exposure (13). In general, lead is present in the air, water, soil, and dust (12). The main target of lead toxicity is the nervous system (14). Additionally, lead expo- sure can increase blood pressure (15) and cause anemia (16), while exposure to high concentrations can cause severe dam- age to the brain and kidney (17,18) as well as miscarriage in pregnant women and sterility in men (19,20). The International Agency for Research on Cancer has classified lead as a probable carcinogen, with lead itself being classified as group 2B and lead compounds (inorganic) as group 2A (21).
In this study, we aimed to evaluate the correlation between physical activity and lead, which is a commonly used and easily exposed to air pollutant that adversely affects health. Specifi- cally, we looked at blood lead concentration; according to the WHO Regional Office for Europe Air Quality Guidelines, when the atmospheric lead concentration is 0.2 µg/m3, blood lead concentration can increase up to 12 µg/L (22). We used data from the Korea National Health and Nutrition Examination Survey (KNHANES), a nationally representative survey con- ducted by the Ministry of Health and Welfare to identify the health and nutritional status of Koreans. Blood lead tests have been conducted annually from 2008 to 2013.
Occupation & Environmental Medicine
MATERIALS AND METHODS Study participants
This study utilized data from the KNHANES between 2008 and 2013. The KNHANES was conducted every 3 years between 1998 and 2005, but it has been conducted annually since 2007 to ensure that the national statistics are as current as possible.
Participants are selected via a stratified sampling method using population and housing census data. The KNHANES compris- es a health interview, a health examination, and a nutrition survey. Furthermore, in the health examination, a survey on exposure to heavy metals has been conducted annually since 2008.
Among 13,514 persons surveyed with blood lead concentra- tion data, we utilized the data of 11,840, after excluding 1,674 persons without physical activity data.
Variables
Blood lead analyses were performed by the Neodin Medical In- stitute, a laboratory certified by the Korean Ministry of Health and Welfare. Blood lead was measured using graphite furnace atomic absorption spectrometry with a Zeeman background correction (AAnalystTM 600; Perkin Elmer, Turku, Finland).
Commercial reference materials were used for internal quality assurance and control (Lyphochek1 Whole Blood Metals Con- trol; Bio-Rad, Hercules, CA, USA). The coefficients of variation for blood lead were within 10%. External quality assurance and control was ensured by the fact that the Neodin Medical Insti- tute had passed both the German External Quality Assessment Scheme operated by Friedrich-Alexander University and the Quality Assurance Program operated by the Korea Occupation- al Safety and Health Agency. The institute was also certified by the Ministry of Labor as a designated laboratory for the analysis of specific chemicals, including heavy metals and certain or- ganic chemicals. The limits of detection for blood lead in 2008, 2009, 2010, 2011, 2012, and 2013 were 0.120 µg/dL, 0.142 µg/dL, 0.142 µg/dL, 0.148 µg/dL, 0.172 µg/dL, and 0.173 µg/dL, respec- tively. None of the participants exhibited values below these detection limits.
Physical activity was measured using the International Physi- cal Activity Questionnaire (IPAQ) (23). Specifically, the IPAQ was used to assess the number of days and average minutes of high-intensity activity, moderate activity, and walking performed longer than 10 minutes during the past 7 days. These raw sur- vey data were then transformed into metabolic equivalent of task minutes per week (MET-min/week), as per the IPAQ scor- ing protocol; participants were subsequently classified into 3 groups according to their degree of physical activity in the past 7 days, including low (0-599 MET-min/week), moderate (600- 2,999 MET-min/week), and high (≥ 3,000 MET-min/week) (24).
Furthermore, study subjects were classified by body mass in-
dex (BMI) using the criteria for Asians developed by the Western Pacific Region Office of the World Health Organization (WHO) in 2000. Specifically, subjects were classified as less than 18.5 kg/m2 (underweight), between 18.5 and 24.9 kg/m2 (normal weight), and more than 25 kg/m2 (obese).
The region was classified into 16 areas. According to Annual Report of Air Quality in Korea 2013, region was classified as mean of air lead concentration from 2007 to 2013 less than 0.04 µg/m3 (Gwangju, Chungcheongnam-do, Jeollanam-do), between 0.04 and 0.05 µg/m3 (Busan, Daejeon, Seoul, Gyeongsangbuk-do, Gyeongsangnam-do, Chungcheongbuk-do, Daegu, Gangwon- do), and more than 0.05 µg/m3 (Incheon, Gyeonggi-do, Ulsan, Jeollabuk-do). There is no information about the special self- governing province of Jeju. Jeju island is a famous tourist site for natural landscape in Korea, and it is possible to infer below 0.04 µg/m3 air lead concentration.
Drinking was classified into “no experience of drinking” and
“experience of drinking.” Smoking was divided into “never,” “less than 5 packs,” and “more than 5 packs” during a whole lifetime.
Finally, regarding occupation, subjects were divided into “man- agers and professionals,” “clerks,” “service and sales workers,”
“skilled agricultural, forestry, and fishery workers,” “craft and equipment workers/machine operation and assembly work- ers,” “elementary occupations,” and “unemployed (e.g., house- wives, students).”
Data analysis
The KNHANES is a highly complex, stratified, and multistage survey that can represent the Korean population. To ensure that our results were nationally representative, we utilized sampling weights for all analyses.
The blood lead concentration averages were calculated as the geometric means of the various categories mentioned be- fore, including age, sex, region, BMI, physical activity levels, drink- ing, smoking, and occupation. Simple linear regression analysis was then performed, with region, BMI, physical activity levels, and occupation as independent variables and log-transformed blood lead concentration as the dependent variable. Since the distribution of blood lead concentration was skewed, it was log- transformed before the analysis. Then, we performed a multi- variate regression analysis to determine the relation between physical activity levels and log-transformed blood lead concen- tration; in Model 1, we included age, sex, drinking, smoking, and BMI as covariates, while in Model 2, we included the Model 1 covariates along with region and occupation. Then, we con- ducted a logistic regression analysis, dividing participants by whether they had a blood lead concentration within the top 25%
of the distribution (i.e., ≥ 2.76 µg/dL), with physical activity as the independent variable. In the multivariate logistic regression analysis, we adjusted for age, sex, drinking, smoking, and BMI in Model 1, while in Model 2, we adjusted for region and occu-
pation along with the Model 1 covariates. All statistical analyses were performed using SAS ver. 9.2 (SAS Institute, Cary, NC, USA).
Ethics statement
This study was approved by the institutional review board of the Korea Centers for Disease Control and Prevention (Approval No. 2008-04EXP-01-C, 2009-01CON-03-2C, 2010-02CON-21-C, 2011-02CON-06-C, 2012-01EXP-01-2C, 2013-07CON-03-4C).
RESULTS
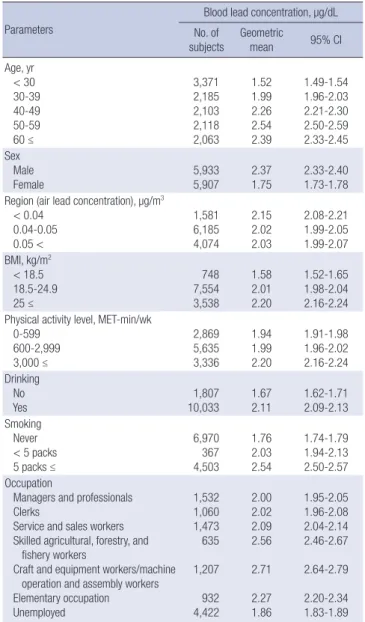
The study subjects included 5,933 men (50.1%) and 5,907 women (49.9%) with a mean age of 42.1 (SE 0.20). The geometric mean of blood lead concentration of the total sample was 2.04 µg/dL (95% CI 2.02-2.06). Blood lead concentration according to age was lowest in the below 30 years group, and highest in the 50-
59 years group. Men had a blood lead concentration of 2.37 µg/
dL, which was higher than that of women. Participants from low (< 0.04 µg/m3) air lead concentration areas had a concen- tration of 2.15 µg/dL, which was higher than that of participants from high (> 0.05 µg/m3) air lead concentration areas. Partici- pants with BMIs higher than 25 kg/m2 exhibited a blood lead concentration of 2.20 µg/dL, which was greater than the con- centrations of the other 2 groups. Participants with drinking ex- perience had a concentration of 2.11 µg/dL, which was higher than that of participants without drinking experience. Further- more, participants who had smoked more than 5 packs in their lifetime had a mean blood lead concentration of 2.54 µg/dL, which was higher than that of participants with no smoking ex- perience and who had smoked less than 5 packs. In terms of occupation, the blood lead concentration was the lowest for unemployed, at 1.86 µg/dL, while it was highest for craft and equipment workers/machine operation and assembly workers, at 2.71 µg/dL. Finally, regarding physical activity, blood lead concentration was lowest among participants with low physical activity (0-599 MET-min/week), at 1.94 µg/dL, and highest among participants with high physical activity (≥ 3,000 MET-min/week), at 2.20 µg/dL (Table 1).
Simple linear regression analysis was performed to investi- gate relationships of log-transformed blood lead concentration with region, BMI, occupation, and physical activity. Regarding region, using low (< 0.04 µg/m3) air lead concentration areas as the reference, being from high (> 0.05 µg/m3) air lead concen- tration area was significantly negative related to blood lead con- centration (β = -0.055, P = 0.004). For BMI, with a score of less Table 1. Distribution of blood lead concentrations
Parameters
Blood lead concentration, µg/dL No. of
subjects Geometric
mean 95% CI
Age, yr < 30 30-39 40-49 50-59 60 ≤
3,371 2,185 2,103 2,118 2,063
1.52 1.99 2.26 2.54 2.39
1.49-1.54 1.96-2.03 2.21-2.30 2.50-2.59 2.33-2.45 Sex
Male
Female 5,933
5,907 2.37
1.75 2.33-2.40 1.73-1.78 Region (air lead concentration), µg/m3
< 0.04 0.04-0.05 0.05 <
1,581 6,185 4,074
2.15 2.02 2.03
2.08-2.21 1.99-2.05 1.99-2.07 BMI, kg/m2
< 18.5 18.5-24.9 25 ≤
748 7,554 3,538
1.58 2.01 2.20
1.52-1.65 1.98-2.04 2.16-2.24 Physical activity level, MET-min/wk
0-599 600-2,999 3,000 ≤
2,869 5,635 3,336
1.94 1.99 2.20
1.91-1.98 1.96-2.02 2.16-2.24 Drinking
No
Yes 1,807
10,033 1.67
2.11 1.62-1.71 2.09-2.13 Smoking
Never < 5 packs 5 packs ≤
6,970 367 4,503
1.76 2.03 2.54
1.74-1.79 1.94-2.13 2.50-2.57 Occupation
Managers and professionals Clerks
Service and sales workers Skilled agricultural, forestry, and fishery workers
Craft and equipment workers/machine operation and assembly workers Elementary occupation Unemployed
1,532 1,060 1,473 635 1,207 932 4,422
2.00 2.02 2.09 2.56 2.71 2.27 1.86
1.95-2.05 1.96-2.08 2.04-2.14 2.46-2.67 2.64-2.79 2.20-2.34 1.83-1.89 CI, confidence interval; BMI, body mass index; MET, metabolic equivalent of task.
Table 2. Regression coefficients of log-transformed blood lead concentrations by simple linear
Parameters β SE P
Region (air lead concentration), µg/m3 < 0.04
0.04-0.05 0.05 <
- -0.060 -0.055
- 0.018 0.019
- 0.001 0.004 BMI, kg/m2
< 18.5 18.5-24.9 25 ≤
- 0.240 0.331
- 0.022 0.023
-
< 0.001
< 0.001 Physical activity level, MET-min/wk
0-599 600-2,999 3,000 ≤
- 0.026 0.124
- 0.012 0.013
- 0.029
< 0.001 Occupation
Unemployed
Managers and professionals Clerks
Service and sales workers
Skilled agricultural, forestry, and fishery workers
Craft and equipment workers/machine operation and assembly workers Elementary occupation
- 0.071 0.080 0.116 0.319 0.376 0.197
- 0.015 0.017 0.015 0.023 0.016 0.018
-
< 0.001
< 0.001
< 0.001
< 0.001
< 0.001
< 0.001 SE, standard error; BMI, body mass index; MET, metabolic equivalent of task.
than 18.5 kg/m2 as the reference, both the 18.5 to 24.9 kg/m2 and more than 25 kg/m2 groups had significant positive relationships with blood lead concentration (β = 0.24 and 0.331, respectively, P < 0.001). For occupation, all occupations showed positive correlations (with “unemployed” as the reference, P < 0.001).
The relationships were particularly strong for “skilled agricul- tural, forestry, and fishery workers” and “craft and equipment workers/machine operation and assembly workers” (β = 0.319 and 0.376, respectively). Regarding physical activity levels, with 0-599 MET-min/week as the reference, significant positive rela- tionships were found for 600-2,999 MET-min/week (β = 0.026, P = 0.029) and ≥ 3,000 MET-min/week (β = 0.124, P < 0.001;
Table 2).
To confirm the relationship between log-transformed blood lead concentration and physical activity, we adjusted for age, sex, drinking, smoking, and BMI (Model 1). Notably, with 0-599 MET-min/week as the reference, only the relationship between blood lead concentration and ≥ 3,000 MET-min/week was sig- nificant and positive (β = 0.07, P < 0.001). Then, we adjusted for region and occupation (Model 2). Notably, the relationship be- tween blood lead concentration and physical activity of 600- 2,999 MET-min/week became significant and positive (β = 0.02, P = 0.051); the relationship for ≥ 3,000 MET-min/week remain- ed roughly the same (β = 0.056, P < 0.001; Table 3).
We furthermore performed logistic regression analysis to con- firm the relation between blood lead concentration and physi- cal activity levels. Participants were divided by whether they had a blood lead concentration of ≥ 2.76 µg/dL. Compared to par- ticipants with 0-599 MET-min/week, participants with ≥ 3,000 MET-min/week had significantly greater odds of having high blood lead concentration (crude odds ratio 1.62, 95% CI 1.42-
1.84). After adjusting for age, sex, drinking, smoking, and BMI (Model 1), the odds for this group decreased somewhat (adjust- ed OR 1.37, 95% CI 1.18-1.59), but remained significant. Finally, after adjusting further for region and occupation, the odds de- creased again (adjusted OR 1.29 95% CI 1.10-1.50), but remained significant (Table 4).
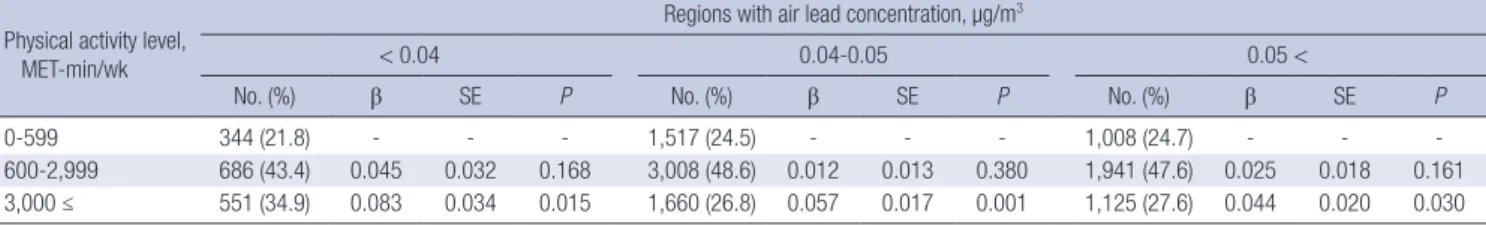
To confirm regional effect on the relationship between log- transformed blood lead concentration and physical activity, we adjusted for age, sex, drinking, smoking, BMI, and occupation after stratification by region. Notably, with 0-599 MET-min/week as the reference, only the relationship between blood lead con- centration and ≥ 3,000 MET-min/week was significant and pos- itive in all region (Table 5).
DISCUSSION
This study aimed to investigate the relationship between blood lead concentration and physical activity level. Our results indi- cated that participants with high physical activity had significant- ly greater odds of having high blood lead concentration (≥ 2.76 µg/dL) compared to those with low physical activity.
According to United Nations Environment Program (UNEP), approximately 120,000 tons of lead were released into the at- mosphere worldwide in the mid-1990s, of which 89,000 tons originated from the combustion of leaded gasoline. The pro- duction of non-ferrous metals and coal combustion are main sources as well (25). Generally, lead is discharged into the at- mosphere through high-temperature processes such as com- bustion of leaded gasoline or coal refinement. In a lead isotope analysis using sediment lead concentration in Korea, Lim et al.
(26) reported that the lead consumption rapidly increased from Table 3. Regression coefficients of log-transformed blood lead concentrations by
multiple linear Physical activity level, MET-min/wk
Model 1* Model 2†
β SE P β SE P
0-599 - - - - - -
600-2,999 0.015 0.010 0.129 0.020 0.010 0.051
3,000 ≤ 0.070 0.012 < 0.001 0.056 0.012 < 0.001 MET, metabolic equivalent of task; SE, standard error.
*Model 1 adjusted for age, sex, drinking, smoking, and BMI; †Model 2 adjusted for Model 1 variables plus region and occupation.
Table 4. Odds ratios of the logistic regression models relating physical activity levels to high blood lead concentration (≥ 2.76 µg/dL)
Physical activity level, MET-min/wk
Crude Model 1* Model 2†
OR 95% CI OR 95% CI OR 95% CI
0-599 1 1 1
600-2,999 1.09 0.96-1.23 1.04 0.90-1.19 1.05 0.91-1.21 3,000 ≤ 1.62 1.42-1.84 1.37 1.18-1.59 1.29 1.10-1.50 BMI, body mass index; MET, metabolic equivalent of task; CI, confidence interval.
*Model 1 adjusted for age, sex, drinking, smoking, and BMI; †Model 2 adjusted for Model 1 variables plus region and occupation.
Table 5. Regression coefficients of log-transformed blood lead concentrations by multiple linear regression* after stratification by region
Physical activity level, MET-min/wk
Regions with air lead concentration, µg/m3
< 0.04 0.04-0.05 0.05 <
No. (%) β SE P No. (%) β SE P No. (%) β SE P
0-599 344 (21.8) - - - 1,517 (24.5) - - - 1,008 (24.7) - - -
600-2,999 686 (43.4) 0.045 0.032 0.168 3,008 (48.6) 0.012 0.013 0.380 1,941 (47.6) 0.025 0.018 0.161
3,000 ≤ 551 (34.9) 0.083 0.034 0.015 1,660 (26.8) 0.057 0.017 0.001 1,125 (27.6) 0.044 0.020 0.030
MET, metabolic equivalent of task; SE, standard error.
*Adjusted for age, sex, drinking, smoking, BMI, and occupation.
1950 to 1980, after which it gradually decreased. Furthermore, the use of leaded gasoline was banned in January 1993. Despite this, a UNEP report from 2010 revealed that Korea is ranked third in terms of lead consumption, following the US and China.
Lead in the atmosphere accumulates in the body via breath- ing. Specifically, industrially emitted lead and lead in the soil are dispersed into the atmosphere through human activities, and breathing introduces the atmospheric lead into the body, thereby increasing the blood lead concentration. This was sup- ported by Richmond-Bryant et al. (27), who reported that at- mospheric lead concentration influences blood lead concen- tration in the general population, and Zahran et al. (28), who found the same specifically among young children. In general, when physical activity increases, so does respiratory rate and tidal volume. Thus, increased physical activity when there is a high concentration of lead in the atmosphere would increase the influx of lead into the body, thereby leading to an increase in blood lead concentration. This was what we found in our study: namely, blood lead concentration was higher among those with higher physical activity, even after adjusting for oth- er factors.
Past studies have noted that blood lead concentration is high- er among men than among women, and that it increases with age (29). Bjermo et al. (30) noted that blood lead increases with age cohort, while Ikeda el al. (31) showed that blood cadmium and lead concentrations showed increases with age. In general, with increasing age, there is a greater likelihood of exposure to leaded gasoline or various environmental sources of lead. Re- garding the sex differences, women tend to have lower smoking rates and are less likely to hold a job that primarily takes place outdoors, both of which contribute to blood lead concentration (32). Blood lead concentrations have also been associated with smoking (33). Apostoli et al. (34) noted that blood lead concen- trations increased with BMI.
Skilled agricultural, forestry, and fishery workers — namely, those whose job activities are mainly outdoors — showed high- er blood lead concentrations than did unemployed. Similarly, blood lead concentration was higher among craft and equip- ment workers/machine operation and assembly workers, whose jobs involve frequent exposure to lead. One might argue that because physical activities in our study included all physical activities (i.e., at home and in the workplace), there is a possi- bility that occupation was a confounding variable. However, we noted a significant relationship between physical activities and blood lead concentration even after adjusting for occupation.
Exercise generally has a favorable effect on health; specifical- ly, it can help prevent cardiovascular diseases and improve men- tal health (35,36). However, as our results indicate, exercise may increase the influx of pollutants into the body during certain conditions (9). Furthermore, the half-life of lead in the body is several years. Therefore, the best preventive action is to mini-
mize lead exposure. First, means of minimizing exposure is to consider seasonal variations in atmospheric lead concentra- tion. In the US, the atmospheric concentration of lead is noted to be high in the summer/autumn and low in winter (28). In Ja- pan, it is high from March to May (the “dust season” or kosa pe- riod), and low from July to August (summer) (37); this is also true in Korea (38). As such, Koreans might minimize outdoor activities in the spring, when the atmospheric lead concentra- tion is high, and maximize them in the summer, when the con- centration is low. Furthermore, caution should be taken when performing occupational physical activities when atmospheric lead concentration is high. Second, means of minimizing expo- sure is to consider regional variation. In Korea, such as Incheon, Gyeonggi-do, Ulsan, Jeollabuk-do area’s air lead concentration level was high. However, in our study there is no difference about the relation between physical activity and blood lead level by the region. It may be explained the percent of high physical ac- tivity person in the region. In high lead concentration area, only 27.6% was done high physical activity, however, in low lead con- centration area, 34.9% was done.
According to IPAQ, high physical activity (≥ 3,000 MET-min/
week) means vigorous-intensity activity on at least 3 days or 7 or more days of any combination of walking, moderate-intensi- ty or vigorous intensity activities. In our study, only high physi- cal activity was significantly correlated with increased blood lead concentration. We recommend to reduce physical activity where air pollution is severe.
There are several limitations of this study. First, the data we utilized did not include information on the location of the phys- ical activity; in other words, we failed to distinguish between in- door and outdoor physical activities. According to the National Survey on Recreational Activities in 2010, however, around 2/3 (68.5%) of sports activities take place out outdoors (39). Second, our study lacked information on differences between indoor and outdoor atmospheric lead concentration. Furthermore, in Korea, since the mean of regional air lead concentration differ- ences are not great, interpretation of the regional effect was lim- ited. Third, this was a cross-sectional study, meaning that we cannot infer any causal relationships. Nevertheless, because we used national data, our study has the benefit of being highly representative. Although lead is a common heavy metal, there have been a few studies on the association of blood lead con- centration and physical activity. Through this study, a signifi- cant correlation is demonstrated between physical activities and blood lead concentration.
ACKNOWLEDGMENT
This study was conducted using raw data from the KNHANES, which was performed by the Korea Ministry of Health and Wel- fare.
DISCLOSURE
The authors have no potential conflicts of interest to disclose.
AUTHOR CONTRIBUTION
Conception and design of the study: Rhie JB, Lee HE. Perform- ing the experiments: Rhie JB, Lee HE. Analysis of data: Rhie JB, Lee HE. Contributed reagents/materials/analysis tools: Rhie JB, Lee HE. Writing: Rhie JB, Lee HE. Final approval: all authors.
ORCID
Jeongbae Rhie http://orcid.org/0000-0002-2748-6835 Hye-Eun Lee http://orcid.org/0000-0003-4648-5042 REFERENCES
1. Kohl HW 3rd, Craig CL, Lambert EV, Inoue S, Alkandari JR, Leetongin G, Kahlmeier S; Lancet Physical Activity Series Working Group. The pande
mic of physical inactivity: global action for public health. Lancet 2012; 380:
294305.
2. Lee IM, Shiroma EJ, Lobelo F, Puska P, Blair SN, Katzmarzyk PT; Lancet Physical Activity Series Working Group. Effect of physical inactivity on major noncommunicable diseases worldwide: an analysis of burden of disease and life expectancy. Lancet 2012; 380: 21929.
3. Hallal PC, Andersen LB, Bull FC, Guthold R, Haskell W, Ekelund U; Lan
cet Physical Activity Series Working Group. Global physical activity lev
els: surveillance progress, pitfalls, and prospects. Lancet 2012; 380: 247
57.
4. Heath GW, Parra DC, Sarmiento OL, Andersen LB, Owen N, Goenka S, Montes F, Brownson RC; Lancet Physical Activity Series Working Group.
Evidencebased intervention in physical activity: lessons from around the world. Lancet 2012; 380: 27281.
5. Li F, Liu Y, Lü J, Liang L, Harmer P. Ambient air pollution in China poses a multifaceted health threat to outdoor physical activity. J Epidemiol Com- munity Health 2015; 69: 2014.
6. Bos I, De Boever P, Int Panis L, Meeusen R. Physical activity, air pollution and the brain. Sports Med 2014; 44: 150518.
7. Panis LI, De Geus B, Vandenbulcke G, Willems H, Degraeuwe B, Bleux N, Mishra V, Thomas I, Meeusen R. Exposure to particulate matter in traffic: a comparison of cyclists and car passengers. Atmos Environ 2010; 44: 2263
70.
8. Pope CA 3rd, Burnett RT, Thurston GD, Thun MJ, Calle EE, Krewski D, God
leski JJ. Cardiovascular mortality and longterm exposure to particulate air pollution: epidemiological evidence of general pathophysiological pathways of disease. Circulation 2004; 109: 717.
9. Giles LV, Koehle MS. The health effects of exercising in air pollution. Sports Med 2014; 44: 22349.
10. Thompson Coon J, Boddy K, Stein K, Whear R, Barton J, Depledge MH.
Does participating in physical activity in outdoor natural environments have a greater effect on physical and mental wellbeing than physical ac
tivity indoors? A systematic review. Environ Sci Technol 2011; 45: 1761
72.
11. Chaudhari PR, Gupta R, Gajghate DG, Wate SR. Heavy metal pollution of ambient air in Nagpur City. Environ Monit Assess 2012; 184: 248796.
12. Agency for Toxic Substances and Disease Registry (US). Toxicological Profile for Lead. Atlanta, GA: U.S. Department of Health and Human Ser
vices, Public Health Service, 2007. Available at http://www.atsdr.cdc.gov/
ToxProfiles/tp.asp?id=96&tid=22 [updated on 21 January 2015; accessed on 15 June 2015].
13. Agency for Toxic Substances and Disease Registry (US). Priority List of Hazardous Substances. Atlanta, GA: U.S. Department of Health and Hu
man Services, Public Health Service, 2014. Available at http://www.atsdr.
cdc.gov/SPL/ [accessed on 16 June 2015].
14. Mason LH, Harp JP, Han DY. Pb neurotoxicity: neuropsychological effects of lead toxicity. Biomed Res Int 2014: 840547.
15. Were FH, Moturi MC, Gottesfeld P, Wafula GA, Kamau GN, Shiundu PM.
Lead exposure and blood pressure among workers in diverse industrial plants in Kenya. J Occup Environ Hyg 2014; 11: 70615.
16. Flora G, Gupta D, Tiwari A. Toxicity of lead: a review with recent updates.
Interdiscip Toxicol 2012; 5: 4758.
17. Schwartz BS, Chen S, Caffo B, Stewart WF, Bolla KI, Yousem D, Davatzikos C. Relations of brain volumes with cognitive function in males 45 years and older with past lead exposure. Neuroimage 2007; 37: 63341.
18. Sabath E, RoblesOsorio ML. Renal health and the environment: heavy metal nephrotoxicity. Nefrologia 2012; 32: 27986.
19. Edwards M. Fetal death and reduced birth rates associated with exposure to leadcontaminated drinking water. Environ Sci Technol 2014; 48: 739
46.
20. Pant N, Kumar G, Upadhyay AD, Patel DK, Gupta YK, Chaturvedi PK. Re
productive toxicity of lead, cadmium, and phthalate exposure in men. En- viron Sci Pollut Res Int 2014; 21: 1106674.
21. International Agency for Research on Cancer (FR). Agents Classified by the IARC Monographs, Volumes 1112. Lyon: International Agency for Research on Cancer, 2015. Available at http://monographs.iarc.fr/ENG/
Classification/ClassificationsAlphaOrder.pdf [updated on 7 April 2015;
accessed on 16 June 2015].
22. World Health Organization (DK). Review of evidence on health aspects of air pollution REVIHAAP Project. Copenhagen: WHO Regional Office for Europe, 2013. Available at http://www.euro.who.int/__data/assets/
pdf_file/0004/193108/REVIHAAPFinaltechnicalreportfinalversion.
pdf [accessed on 5 October 2015].
23. Craig CL, Marshall AL, Sjöström M, Bauman AE, Booth ML, Ainsworth BE, Pratt M, Ekelund U, Yngve A, Sallis JF, et al. International physical ac
tivity questionnaire: 12country reliability and validity. Med Sci Sports Exerc 2003; 35: 138195.
24. International Physical Activity Questionnaire Research Committee. Guide
lines for data processing and analysis of the International Physical Activi
ty Questionnaire (IPAQ)—Short and Long Forms. 2005. Available at https:
//sites.google.com/site/theipaq/scoringprotocol [accessed on 6 May 2015].
25. United Nations Environment Programme (KE). Final review of scientific information on lead. Nairobi: United Nations Environment Programme, 2010. Available at http://www.unep.org/hazardoussubstances/Portals/
9/Lead_Cadmium/docs/Interim_reviews/UNEP_GC26_INF_11_Add_
1_Final_UNEP_Lead_review_and_apppendix_Dec_2010.pdf [accessed on 13 July 2015].
26. Lim DI, Jung SW, Choi MS, Kang SM, Jung HS, Choi JY. Historical record of metal accumulation and lead source in the southeastern coastal re
gion of Korea. Mar Pollut Bull 2013; 74: 4415.
27. RichmondBryant J, Meng Q, Davis JA, Cohen J, Svendsgaard D, Brown JS, Tuttle L, Hubbard H, Rice J, Kirrane E, et al. A multilevel model of blood lead as a function of air lead. Sci Total Environ 2013; 461462: 20713.
28. Zahran S, Laidlaw MA, McElmurry SP, Filippelli GM, Taylor M. Linking source and effect: resuspended soil lead, air lead, and children’s blood lead levels in Detroit, Michigan. Environ Sci Technol 2013; 47: 283945.
29. Kuno R, Roquetti MH, Becker K, Seiwert M, Gouveia N. Reference values for lead, cadmium and mercury in the blood of adults from the metropoli
tan area of Sao Paulo, Brazil. Int J Hyg Environ Health 2013; 216: 2439.
30. Bjermo H, Sand S, Nälsén C, Lundh T, Enghardt Barbieri H, Pearson M, Lindroos AK, Jönsson BA, Barregård L, Darnerud PO. Lead, mercury, and cadmium in blood and their relation to diet among Swedish adults. Food Chem Toxicol 2013; 57: 1619.
31. Ikeda M, Ohashi F, Fukui Y, Sakuragi S, Moriguchi J. Cadmium, chromi
um, lead, manganese and nickel concentrations in blood of women in nonpolluted areas in Japan, as determined by inductively coupled plas
masector fieldmass spectrometry. Int Arch Occup Environ Health 2011;
84: 13950.
32. Kim NS, Lee BK. National estimates of blood lead, cadmium, and mercu
ry levels in the Korean general adult population. Int Arch Occup Environ Health 2011; 84: 5363.
33. Bernhard D, Rossmann A, Wick G. Metals in cigarette smoke. IUBMB Life 2005; 57: 8059.
34. Apostoli P, Baj A, Bavazzano P, Ganzi A, Neri G, Ronchi A, Soleo L, Di LL, Spinelli P, Valente T, et al. Blood lead reference values: the results of an Italian polycentric study. Sci Total Environ 2002; 287: 111.
35. Rosenbaum S, Newby JM, Steel Z, Andrews G, Ward PB. Online physical activity interventions for mental disorders: a systematic review. Internet Interventions 2015; 2: 21420.
36. Lonsdale C, Rosenkranz RR, Peralta LR, Bennie A, Fahey P, Lubans DR. A systematic review and metaanalysis of interventions designed to increase moderatetovigorous physical activity in school physical education les
sons. Prev Med 2013; 56: 15261.
37. Var F, Narita Y, Tanaka S. The concentration, trend and seasonal variation of metals in the atmosphere in 16 Japanese cities shown by the results of National Air Surveillance Network (NASN) from 1974 to 1996. Atmos En- viron 2000; 34: 275570.
38. Lee BK, Hieu NT. Seasonal variation and sources of heavy metals in at
mospheric aerosols in a residential area of Ulsan, Korea. Aerosol Air Qual Res 2011; 11: 67988.
39. Ministry of Culture, Sports and Tourism (KR). National Leisure Time Ac
tivity Survey. Sports and tourism of Korea. Seoul: Ministry of Culture, Sports and Tourism, 2010. Available at https://www.bscf.or.kr:6017/program/
board/data/Board2/1313455541_0.pdf [accessed on 15 June 2015].