서 론
심혈관질환은 전세계 사망 원인의 가장 주요한 원인으로 알려져 있다.1) 2015년 통계청 사망원인통계에 따르면 국내에서도 심혈관질
환은 암에 이어 2번째로 높은 사망원인을 차지하는 질환이다.2) 심혈 관질환의 여러 위험인자 중 이상지질혈증은 심혈관질환을 유발하 는 동맥경화의 주요한 원인이 되고, 그렇기 때문에 이상지질혈증을 적절히 관리하는 것이 심혈관질환에 의한 사망을 줄이는데 중요하
Received August 16, 2017 Revised October 11, 2017 Accepted October 12, 2017
Corresponding author Jong-Soo Han
Tel: +82-31-787-7807, Fax: +82-31-787-4834 E-mail: [email protected]
ORCID: http://orcid.org/0000-0001-9248-9998
Copyright © 2018 The Korean Academy of Family Medicine
This is an open-access article distributed under the terms of the Creative Commons At- tribution Non-Commercial License (http://creativecommons.org/licenses/by-nc/4.0) which permits unrestricted noncommercial use, distribution, and reproduction in any medium, provided the original work is properly cited.
Original Article
https://doi.org/10.21215/kjfp.2018.8.6.808 eISSN 2233-9116
Korean J Fam Pract. 2018;8(6):808-819
Korean Journal of Family Practice
KJFP
한국 성인에서 이상지질혈증에 대한 조절과 생활요법과의 연관성:
제 4-6기 국민건강영양조사 자료(2007-2015년)
조수환
1, 한종수
1,2,*, 조인영
2, 권오덕
1, 박선영
1, 김호준
11
서울대학교병원 가정의학과,
2분당서울대학교병원 가정의학과 건강증진센터
The Association between Lifestyle Therapy and Dyslipidemia Control in Korean Adults: The Fourth to Sixth Korean National Health and Nutrition Examination Survey (2007-2015)
Su Hwan Cho
1, Jong-Soo Han
2,*, In Young Cho
2, Oh Deok Kwon
1, Sun Young Park
1, Ho Jun Kim
11Department of Family Medicine, Seoul National University Hospital, Seoul; 2Department of Family Medicine, Health Promotion Center, Seoul National University Bundang Hospital, Seongnam, Korea
Background: Dyslipidemia is a major risk factor for cardiovascular disease, and its prevalence is steadily rising. In addition to medication, lifestyle therapy is also important for the control of dyslipidemia.
Methods: We utilized data from the Fourth to Sixth Korean National Health and Nutrition Examination Survey and included a total of 4,384 patients with dyslipidemia. Further, we employed logistic regression analysis using a weighted method to determine whether the control of dyslipidemia was associated with lifestyle therapy as is suggested in clinical dyslipidemia guidelines. Lifestyle therapy includes both behavioral factors (smoking, alcohol consumption and exercise level) and nutritional factors (adequate intake and regulation of fiber, carbohydrates, fats, saturated fats, sodium, and cholesterol).
Results: The control of dyslipidemia in men was associated with excessive alcohol consumption (OR 1.38, [95% CI 1.03–1.86]) and adequate physical activity (1.42, [1.02–1.98]). There were no significant differences with regards to the nutritional factor variables in men and any of the variables in women. In our subgroup analyses, control of dyslipidemia in the high-risk group taking medication was associated with a higher smoking rate (1.91, [1.10–3.30]) and an adequate sodium intake (1.76, [1.07–2.91]). In the low-risk group taking medication, the control of dyslipidemia was associated with a lower smoking rate (0.36, [0.14–0.93]) and adequate physical activity (4.20, [1.22–14.47]).
Conclusion: Adequate physical activity may be a key factor in the control of dyslipidemia. For the better control of dyslipidemia, the importance of lifestyle therapy should be emphasized.
Keywords: Dyslipidemia; Life Style; Behavior; Smoking; Alcohol Drinking; Exercise; Guideline; Diet
조수환 외. 이상지질혈증에 대한 조절과 생활요법과의 연관성
Korean Journal of Family PracticeKJFP
다는 것이 이미 이전의 여러 연구들을 통해 밝혀져 있다.3)
동맥경화 발달 과정에서 가장 주된 역할을 하는 저밀도 지단백콜 레스테롤(low density lipoprotein cholesterol, LDL-C)을 60%까지 낮춰 주는 HMG-CoA inhibitors (statin)은 심혈관질환의 예방 및 재발 방 지를 위한 1차 약제이자 치료 방법이다.4,5) 그러나 약제 사용 이전에 첫 단계로서 권고되는 것은 생활요법인데, 위험도에 상관없이 진단 을 받은 모든 환자들에게 기본적으로 권고되는 중재 방법으로서, 일 차적인 이상지질혈증 치료법에 해당한다고 할 수 있다.6-9)
이러한 생활요법에는 금연, 과도한 음주 제한하기, 적절한 신체 활 동, 그리고 혈중 지질을 높이지 않기 위한 건강한 영양 섭취 등이 포 함된다. Villegas 등10)의 연구에서는 이러한 생활요법의 권고사항에 해당하는 정상 체중, 비흡연자, 소량의 음주, 규칙적인 신체 활동을 하는 사람들의 이상지질혈증 유병률이 유의하게 낮다는 것을 보여 주었고, Nurses’ Health cohort에서는 식이, 운동, 금연에 대한 생활습 관 관리 진료 지침을 잘 지킨 군의 허혈성 심질환 발생율이 더 낮았 다는 결과를 나타냈다.11) 또한, 지질강하제를 쓰지 않고도 생활요법 프로그램을 5년간 적극적으로 시행 및 유지할 경우, LDL-C을 37% 감 소시켜 동맥경화의 진행을 막고, 거기서 더 나아가 오히려 역으로 돌 릴 수도 있었다는 것을 보여주는 연구도 존재하였다.12)
이처럼 이상지질혈증에서 생활요법의 중요성은 오랜 시간 동안 강 조되어 왔으나, 아시아인을 대상으로 임상 진료지침에서 권고되는 생활요법과 실제 이상지질혈증 조절과의 연관성을 보는 연구는 거 의 수행된 적이 없었으며, 특히 국내에서는 전무하였다. 이에 본 연구 는 국민건강영양조사 자료를 이용하여, 식이, 음주, 흡연, 신체 활동 과 관련한 이상지질혈증 관리를 위한 생활요법과 실제 이상지질혈 증 조절과의 연관성을 파악하고자 하였다.
방 법
1. 연구 설계 및 연구 대상자
본 연구는 제 4–6기 국민건강영양조사(2007–2015년) 자료를 이용 한 단면연구이다. 국민건강영양조사 자료는 대한민국 국민을 목표 모집단으로 한 표본을 추출한 뒤 건강설문조사, 검진조사 및 영양조 사를 실시하여 얻어진 결과를 통해 수집된 정보로 구성되어 있다.
해당 기간에는 총 73,353명에 대한 조사가 진행되었고, 이 중 만 20세 이상의 성인 55,384명 중 이상지질혈증 진단 여부의 값이 없는 경우 (4,079명), 지질 관련 혈액 검사 수치가 없거나 계산식에 의해 구할 수 없는 경우(4,110명), 금식 시간이 9시간 미만인 경우(1,245명)를 제외 하였다. 또한, 결과 변수 및 일반적 특성 변수에 해당하는 값이 없는 경우(6,448명) 역시 제외하였고, 이후 이상지질혈증 유병 및 의사 진
단 여부를 조사한 설문에서 ‘예’로 대답한 대상자들(4,384명)을 이상 지질혈증 인지군으로 설정한 뒤 최종 대상자로 선정하였다.
이상지질혈증은 총 콜레스테롤(total cholesterol [TC], ≥240 mg/dL), 고밀도 지단백콜레스테롤(high density lipoprotein cholesterol [HDL- C], <40 mg/dL), 중성지방(triglyceride [TG], ≥200 mg/dL), LDL-C (위험 도에 따른 기준에 따라 ≥160 mg/dL, ≥130 mg/dL, ≥100 mg/dL), 이렇게 4개의 항목에 대하여 각각의 기준에 하나라도 부합할 경우 진단을 내리게 되는데, 본 연구에서는 심혈관질환 발생 기전에서 가장 핵심 적인 요소로 간주되는 LDL-C을 기준으로 이상지질혈증 조절군을 설정하였고, 위험인자에 따른 진단 기준 및 조절 목표는 한국지질동 맥경화학회의 2015년 이상지질혈증 치료지침6)에 의거하여 설정하 였다. 본 연구는 공개된 국민건강영양조사 자료를 사용하였기 때문 에 심의면제를 받았다(IRB no. X-1708-417-902).
2. 측정 변수
1) 일반적 특성 변수
일반적 특성 변수는 성별, 나이, 체질량지수(body mass index, BMI), 복부 비만, 주관적 건강상태, 교육 수준, 가계 소득, 거주지, 당 뇨 및 고혈압 유병 여부, 이상지질혈증 투약 여부, 고위험군의 비율, 지질 관련 측정값 등을 이용하였다. 체질량지수는 체중을 키로 나 눈 지수(kg/m2)인데, 한국 성인을 대상으로는 25 kg/m2을 기준으로 비만이 정의된다.13) 복부 비만은 2006년부터 대한비만학회에서 정의 해서 사용하고 있는 기준으로 허리 둘레가 남자의 경우 90 cm, 여자 의 경우 85 cm 이상일 경우로 정의하였다.14) 주관적 건강상태는 ‘매 우 좋음/좋음/보통/나쁨/매우 나쁨’의 5단계로 나누어져 있는 설문 측정 값을 ‘좋음/보통/나쁨’의 3단계로 분류하여 정의하였고, 당뇨병 과 고혈압의 유병 상태의 경우 의사진단 혹은 현재 유병에 관한 설 문에 ‘예’로 응답한 경우로 정의하였다. 이상지질혈증 투약 여부는 현 재 지질강하제를 먹고 있다고 응답한 대상자들을 기준으로 설정하 였으며, 고위험군의 비율은 한국지질동맥경화학회의 2015년 이상지 질혈증 치료지침6)에서 정의한 초고위험군과 고위험군을 합하여 고 위험군으로 정의한 뒤 해당 군에서의 비율로 나타냈다.
2) 생활요법 관련 변수
임상 진료지침에서 이상지질혈증 조절을 위해 제시하는 생활요법 관련 변수는 크게 두 가지로 분류해볼 수 있다. 하나는 흡연, 음주, 신체 활동처럼 습관이나 행동과 관련된 행동 변수들이고, 나머지 하 나는 섭취하는 식품의 영양소의 종류 및 함유량과 관련된 영양 변 수들이다. 본 연구에서는 National Institute for Health and Care Excel-
Original Article
Korean Journal of Family Practice
Su Hwan Cho, et al. The Association between Lifestyle Therapy and Dyslipidemia Control
Korean Journal of Family Practice
KJFP
lence (NICE) 2014, National lipid association (NLA) 2015, European So- ciety of Cardiology (ESC) and European Atherosclerosis Society (EAS) 2016, 한국지질동맥경화학회 2015년 이상지질혈증 진료지침들을 이 용하여 관련 변수들을 정의하고 이를 분석에 이용하였다.6-9)
3) 행동 변수
흡연이 심혈관질환을 유발하는 주요 원인이 된다는 사실은 오래 전부터 널리 알려져 있기 때문에, 모든 이상지질혈증 진료 지침은 금 연이 생활요법의 최우선 원칙임을 강조하고 있다.6-9) 흡연은 ‘현재 흡
연’을 기준으로 행동 변수의 하나로 지정하였다.
음주의 경우 2014 NICE 진료지침7)에서는 남자는 하루에 3–4 표 준잔을, 여자는 하루에 2–3 표준잔을 초과하여 마시는 경우를 과도 한 음주로 정의하고 있고, 음주량이 이처럼 되지 않도록 권고하고 있 다. 이에 따라 본 연구에서는 1회 음주 시 음주량에 대한 설문조사의 답을 하루에 3–4잔을 초과해서 마시는 경우로 한 사람들을 과도한 음주자로 정의하여 진행하였다.
적절한 신체활동은 2015년 NLA 진료지침8)에 의거하여 중등도 강 도 이상의 유산소 운동을 1주에 5일 이상, 하루에 30분 이상, 1주일에
Table 1. Characteristics of dyslipidemic patients depending on control of dyslipidemia Variable
Male (n=1,540)
P-value
Female (n=2,844)
P-value Uncontrolled
(n=584)
Controlled (n=956)
Uncontrolled (n=1,054)
Controlled (n=1,790)
Age (y) 53.6 (52.4–54.8) 53.8 (52.9–54.8) 0.785 61.3 (60.6–62.1) 59.7 (59.1–60.3) 0.001*
BMI (kg/m2) 0.531 0.555
<25 49.9 (45.0–54.8) 51.9 (48.0–55.7) 55.1 (51.6–58.6) 56.5 (53.7–59.2)
≥25 50.1 (45.2–55.0) 48.1 (44.3–52.0) 44.9 (41.4–48.4) 43.5 (40.8–46.3)
Abdominal obesity 40.2 (35.3–45.4) 39.0 (35.4–42.7) 0.686 45.9 (42.2–49.7) 39.4 (36.6–42.3) 0.007*
Self-perceived health status 0.041* 0.008*
Excellent/good 23.2 (19.3–27.7) 25.5 (22.3–29.0) 16.1 (13.6–18.9) 19.4 (17.2–21.8)
Fair 46.7 (41.8–51.7) 51.4 (47.5–55.2) 43.7 (40.0–47.4) 46.0 (43.3–48.8)
Poor/very poor 30.1 (25.8–34.7) 23.1 (20.1–26.4) 40.3 (36.8–43.8) 34.6 (32.0–37.4)
Education 0.384 0.004*
Elementary school or lower 14.0 (11.4–17.1) 15.2 (12.8–18.0) 51.0 (47.4–54.6) 44.6 (41.8–47.5)
Middle school 15.0 (11.9–18.8) 15.4 (12.8–18.4) 14.6 (12.3–17.2) 16.8 (14.8–19.0)
High school 33.4 (28.8–38.3) 34.5 (30.7–38.4) 25.3 (22.1–28.7) 26.2 (23.8–28.7)
Undergraduate or higher 37.6 (32.8–42.6) 34.9 (31.2–38.8) 9.1 (7.3–11.3) 12.4 (10.6–14.5)
Household income 0.757 0.004*
Low 13.0 (10.1–16.6) 15.1 (12.8–17.9) 30.3 (27.1–33.7) 25.5 (23.2–27.8)
Low middle 23.6 (19.9–27.8) 23.6 (20.4–27.0) 27.5 (24.3–30.8) 27.9 (25.5–30.5)
Upper middle 30.7 (26.3–35.5) 26.5 (23.2–29.9) 21.7 (18.8–24.9) 20.6 (18.4–23.0)
Upper 32.6 (28.2–37.4) 34.8 (31.1–38.8) 20.6 (17.7–23.9) 26.0 (23.5–28.7)
Residential area 0.817 0.613
Urban 80.5 (76.0–84.3) 81.1 (77.3–84.3) 81.6 (78.3–84.5) 82.4 (79.6–84.9)
Rural 19.5 (15.7–24.0) 18.9 (15.7–22.7) 18.4 (15.5–21.7) 17.6 (15.1–20.4)
Prevalence of DM 33.5 (29.1–38.1) 24.7 (21.5–28.1) 0.002* 34.2 (31.0–37.6) 19.5 (17.4–21.8) <0.001*
Prevalence of HTN 54.0 (48.8–59.2) 60.0 (56.2–63.8) 0.065 61.8 (58.3–65.2) 57.1 (54.4–59.8) 0.033*
Medication for DL 35.5 (31.1–40.2) 56.4 (52.5–60.3) <0.001* 40.3 (36.9–43.9) 67.1 (64.3–69.8) <0.001* Proportion of High risk group 43.6 (38.9–48.4) 24.2 (21.1–27.6) <0.001* 49.2 (45.6–52.8) 18.3 (16.3–20.5) <0.001* Lipid levels
TC (mg/dL) 222 (218–226) 174 (170–177) <0.001* 228 (225–231) 180 (178–182) <0.001*
TG (mg/dL) 185 (174–197) 202 (187–217) 0.049* 152 (147–157) 139 (134–144) 0.006*
HDL-C (mg/dL) 45 (44–45) 45 (44–46) 0.264 50 (49–51) 52 (51–52) 0.001*
LDL-C (mg/dL) 144 (141–147) 93 (91–95) <0.001* 148 (146–151) 101 (100–103) <0.001*
Data and P-values were obtained from t-test for continuous variables and chi-squared test for categorical variables. Data are presented as the means with 95% confi- dence intervals for age and lipid levels, and percentages with 95% confidence intervals for the remaining variables. All data were weighted to the Korean standard population.
BMI, body mass index; DM, diabetes mellitus; HTN, hypertension; DL, dyslipidemia; TC, total cholesterol; TG, triglyceride; HDL-C, high density lipoprotein cholesterol;
LDL-C, low density lipoprotein cholesterol; KSLA, Korean Society of Lipidology and Atherosclerosis; SBP, systolic blood pressure; DBP, diastolic blood pressure.
Abdominal obesity: waist circumference ≥90 cm in male, ≥85 cm in female, High risk group: very high risk group+high risk group by KSLA guideline 2015, Diagnosis of DM: fasting blood glucose ≥126 mg/dL, or use of insulin or oral hypoglycemic agents, Diagnosis of HTN: average SBP ≥140 mmHg or DBP ≥90 mmHg, or taking medi- cation for hypertension.
*Statistically significant P<0.05.
조수환 외. 이상지질혈증에 대한 조절과 생활요법과의 연관성
Korean Journal of Family PracticeKJFP
운동 시간 최소 200분 이상의 기준을 만족하는 경우로 정의하였다.
4) 영양 변수
영양 섭취는 24시간 회상 설문조사에서 응답한 섭취 영양소를 기 반으로 CAN-Pro software 3.0 (Korean Nutrition Society, Seoul, Korea) 를 이용하여 계산된 값을 이용하였다. 2016년 ESC/EAS 진료지침9)에 서 생활요법으로 권고되는 영양 관련 항목에는, 탄수화물 섭취(총 하루 섭취 에너지의 55% 이하), 지방 섭취(총 하루 섭취 에너지의 30%
미만), 나트륨 섭취(하루 5 g 미만), 콜레스테롤 섭취(하루 300 mg 미 만), 식이섬유 섭취(하루 25 g 이상), 포화지방산 섭취(총 하루 섭취 에 너지의 7% 미만) 관련 항목들이 포함되어 있어 이들을 영양 변수로 설정하였고, 이 중 콜레스테롤 및 포화지방산 관련 변수는 국민건강 영양조사 제 6기부터 추가된 변수로 제 6기(2013–2015년)에 해당하 는 대상자들의 값만 포함하였다.
3. 통계적 분석
모든 분석은 STATA version 14.1 (Stata Corp., College Station, TX, USA)을 이용하여 수행되었고, 대한민국 표준 인구를 추정하기 위한 가중치를 적용한 복합 표본 분석 통계 방법이 적용되었다. 일반적 특 성 변수 중 연속 변수에 대해서는 그 평균 값을 비교하기 위하여 un-
paired t-test를, 그 외 범주형 변수에 대해서는 조절 여부에 따른 분포 의 차이를 보기 위해 chi-square test를 이용하여 분석하였다. 이상지 질혈증 조절 여부와 행동 변수 간의 연관성을 보기 위해 나이, 복부 비만, 주관적 건강 상태, 교육 수준, 가계 소득에 대하여 보정하여 multivariate logistic regression을 시행하였으며, 이외에도 고혈압 및 당뇨 유병 여부, 지질강하제 투약 상태 및 고위험군의 비율에 대하여 도 추가로 보정하여 여러가지 보정 모형을 만들어 분석을 시행하였 다. 보정된 교차비(odds ratio, OR), 95% 신뢰구간(95% confidence in- terval, 95% CI), P-value는 각각의 연관성의 강도를 표현하기 위해 사 용되었고, 통계적 유의수준은 P<0.05로 정의하였다.
결 과
1. 일반적 특성 변수
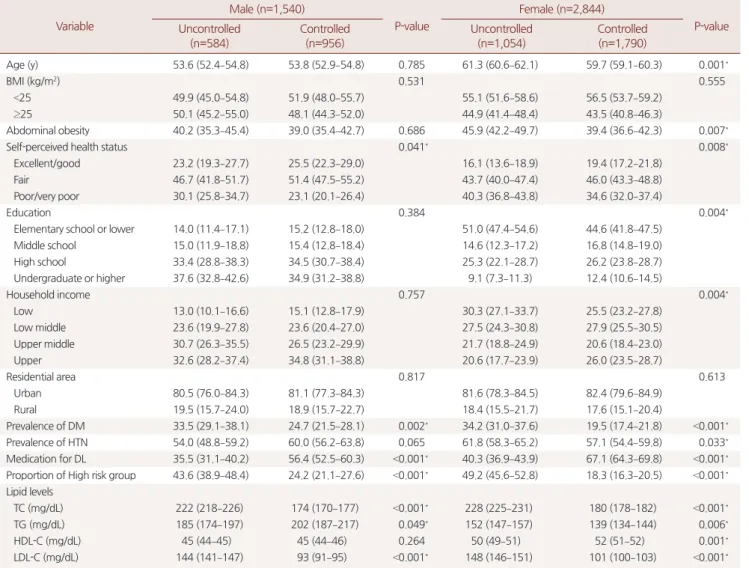
본 연구의 대상자는 총 4,384명이었고, 이 중 남자는 1,540명, 여자 는 2,844명이었다. 이 중 조절군은 총 2,746명으로 전체의 62.6%이었 고, 남자의 경우 956명 (62.1%), 여자의 경우 1,790명(62.9%)이 조절군 에 해당하였다(Table 1).
나이의 경우 남성은 조절군과 비조절군의 평균 연령이 각각 53.8 세, 53.6세로 유의한 차이가 없었으나, 여성은 조절군의 평균 연령이
Table 2. Behavioral factors depending on control of dyslipidemia Variable
Male (n=1,540)
P-value
Female (n=2,844)
P-value Uncontrolled
(n=584)
Controlled (n=956)
Uncontrolled (n=1,054)
Controlled (n=1,790) Current smoking
Crude proportion (%) 35.6 (31.0–40.5) 34.8 (31.0–38.9) 0.811 3.2 (2.2–4.7) 2.9 (2.1–4.0) 0.724
Model 1 1 0.99 (0.74–1.32) 0.939 1 0.91 (0.53–1.57) 0.729
Model 2 1 1.02 (0.76–1.36) 0.905 1 0.89 (0.52–1.55) 0.690
Model 3 1 0.98 (0.72–1.35) 0.914 1 0.80 (0.42–1.51) 0.495
Excessive alcohol consumption
Crude proportion (%) 45.9 (41.1–50.8) 53.6 (49.8–57.3) 0.013* 4.8 (3.4–6.6) 6.2 (4.9–7.8) 0.203
Model 1 1 1.45 (1.11–1.89) 0.006* 1 1.16 (0.76–1.77) 0.495
Model 2 1 1.42 (1.09–1.86) 0.010* 1 1.12 (0.73–1.73) 0.598
Model 3 1 1.38 (1.03–1.86) 0.033* 1 1.07 (0.67–1.71) 0.786
Adequate physical activity
Crude proportion (%) 21.6 (17.7–26.0) 27.9 (24.6–31.5) 0.026* 20.1 (17.4–23.2) 21.7 (19.4–24.3) 0.407
Model 1 1 1.42 (1.05–1.92) 0.024* 1 1.04 (0.83–1.31) 0.735
Model 2 1 1.43 (1.06–1.94) 0.020* 1 1.00 (0.79–1.26) 0.983
Model 3 1 1.42 (1.02–1.98) 0.037* 1 0.94 (0.72–1.23) 0.657
Data are presented as percentages or adjusted odds ratio with 95% confidence intervals, weighted to the Korean standard population. Crude proportions with P-values were obtained from chi-squared tests, and logistic regression analysis was performed to examine the association between control of dyslipidemia and each health be- havior with the adjustments specified.
Excessive alcohol consumption: >3–4 standard drinks/day in male, >2–3 standard drinks/day in female, Adequate physical activity: ≥30 min per session of moderate or higher intensity, 5 or more days a week, ≥200 min per week of moderate or higher intensity physical activity, Model 1: adjusted for age, abdominal obesity, self-per- ceived health status, education, household income, Model 2: adjusted for age, abdominal obesity, self-perceived health status, education, household income, preva- lence of diabetes, prevalence of hypertension, Model 3: adjusted for age, abdominal obesity, self-perceived health status, education, household income, prevalence of diabetes, prevalence of hypertension, medication for dyslipidemia, proportion of high risk group.
*Statistically significant P<0.05.
Su Hwan Cho, et al. The Association between Lifestyle Therapy and Dyslipidemia Control
Korean Journal of Family Practice
KJFP
59.7세로 비조절군의 61.3세보다 더 낮은 것으로 나타났다(P=0.001).
비만의 척도인 체질량지수(BMI)는 남녀 모두 조절군과 비조절군에 서 차이가 없었으나, 복부 둘레를 기준으로 한 복부 비만율의 경우 여성에서 조절군이 39.4%로, 비조절군의 45.9%에 비해 더 낮은 것을 알 수 있었다(P=0.007).
주관적 건강 상태의 경우 남녀 모두에서 조절군이 비조절군에 비 해 ‘좋다/매우 좋다’로 응답한 비율이 유의하게 높게 나타났고(각각 25.5% vs. 23.2%, 19.4% vs. 16.1%), ‘나쁘다/매우 나쁘다’로 응답한 비율 이 낮게 나타났다(각각 23.1% vs. 30.1%, 34.6% vs. 40.3%). 교육 수준의
경우 남성에서는 두 군 간의 유의한 차이를 보이지 않았으나, 여성의 경우 초등학교 졸업 이하의 학력인 경우가 조절군은 44.6%, 비조절 군은 51.0%로 유의한 차이를 보였다(P=0.004). 가계 소득도 비슷한 양상을 나타냈는데, 남성의 경우 그 분포가 두 군 간에 유의한 차이 를 나타내지 않았으나, 여성의 경우 가계 소득 4분위수에서 가장 높 은 구간에 해당하는 비율이 조절군은 26.0%, 비조절군은 20.6%로 조 절군이 더 높은 가계 소득을 보이는 것으로 나타났다(P=0.004).
당뇨의 유병률은 남녀 모두에서 조절군이 비조절군에 비해 더 낮 게 나타났다(각각 24.7% vs. 33.5%, 19.5% vs. 34.2%). 고혈압의 유병 정
Table 3. Nutritional factors depending on control of dyslipidemia Variable
Male (n=1,540)
P-value
Female (n=2,844)
P-value Uncontrolled
(n=584)
Controlled (n=956)
Uncontrolled (n=1,054)
Controlled (n=1,790) Adequate intake of carbohydrate
Crude proportion (%) 25.4 (21.4–29.9) 27.4 (24.0–31.1) 0.478 8.0 (6.2–10.3) 8.2 (6.8–9.9) 0.876
Model 1 1 1.12 (0.83–1.50) 0.456 1 0.91 (0.64–1.28) 0.582
Model 2 1 1.13 (0.84–1.52) 0.424 1 0.96 (0.67–1.36) 0.804
Model 3 1 1.02 (0.74–1.40) 0.927 1 1.06 (0.72–1.56) 0.774
Adequate intake of fat
Crude proportion (%) 92.5 (89.1–94.8) 93.4 (91.0–95.2) 0.612 95.2 (93.3–96.6) 93.9 (92.4–95.1) 0.240
Model 1 1 1.13 (0.67–1.92) 0.643 1 0.88 (0.57–1.36) 0.575
Model 2 1 1.09 (0.64–1.84) 0.754 1 0.81 (0.52–1.26) 0.350
Model 3 1 1.11 (0.66–1.86) 0.689 1 0.74 (0.46–1.18) 0.205
Adequate intake of saturated fat
Crude proportion (%) 80.8 (73.7–86.4) 81.9 (76.9–86.0) 0.776 85.2 (80.6–88.9) 85.7 (82.5–88.4) 0.842
Model 1 1 1.10 (0.65–1.87) 0.717 1 1.12 (0.75–1.67) 0.576
Model 2 1 1.11 (0.64–1.91) 0.717 1 1.10 (0.73–1.66) 0.635
Model 3 1 1.14 (0.66–1.98) 0.630 1 1.04 (0.65–1.66) 0.865
Adequate intake of cholesterol
Crude proportion (%) 68.6 (60.9–75.3) 70.6 (64.9–75.8) 0.662 84.3 (79.4–88.2) 80.4 (76.8–83.6) 0.181
Model 1 1 1.13 (0.72–1.78) 0.597 1 0.88 (0.59–1.32) 0.544
Model 2 1 1.15 (0.73–1.83) 0.544 1 0.90 (0.60–1.34) 0.592
Model 3 1 1.13 (0.69–1.86) 0.628 1 0.94 (0.60–1.48) 0.783
Adequate intake of fiber
Crude proportion (%) 21.2 (17.5–25.5) 24.8 (21.6–28.3) 0.187 18.5 (15.7–21.5) 22.1 (19.9–24.5) 0.051
Model 1 1 1.23 (0.91–1.66) 0.179 1 1.22 (0.97–1.53) 0.088
Model 2 1 1.27 (0.94–1.72) 0.125 1 1.19 (0.95–1.50) 0.126
Model 3 1 1.16 (0.84–1.61) 0.358 1 1.27 (0.98–1.63) 0.069
Adequate intake of sodium
Crude proportion (%) 53.9 (49.2–58.5) 55.0 (51.1–58.9) 0.704 81.4 (78.4–84.0) 81.0 (78.7–83.0) 0.822
Model 1 1 1.04 (0.81–1.33) 0.751 1 1.03 (0.82–1.30) 0.810
Model 2 1 1.04 (0.81–1.33) 0.769 1 1.02 (0.81–1.29) 0.871
Model 3 1 1.09 (0.83–1.44) 0.523 1 1.01 (0.78–1.32) 0.922
Data are presented as percentages or adjusted odds ratio with 95% confidence intervals, weighted to the Korean standard population. Crude proportions with P-values were obtained from chi-squared tests, and logistic regression analysis was performed to examine the association between control of dyslipidemia and each health be- havior with the adjustments specified.
Adequate intake of carbohydrate: ≤55% of total calories per day, Adequate intake of fat: <30% of total calories per day, Adequate intake of saturated fat: <7% of total calories per day, only the participants in Korean National Health and Nutrition Examination Survey (KNHANES) VI were available for analysis, Adequate intake of choles- terol: <300 mg per day, only the participants in KNHANES VI were available for analysis, Adequate intake of fiber: ≥25 g per day, Adequate intake of sodium: <5 g per day, Model 1: adjusted for age, abdominal obesity, self-perceived health status, education, household income, Model 2: adjusted for age, abdominal obesity, self-per- ceived health status, education, household income, prevalence of diabetes, prevalence of hypertension, Model 3: adjusted for age, abdominal obesity, self-perceived health status, education, household income, prevalence of diabetes, prevalence of hypertension, medication for dyslipidemia, proportion of high risk group.
조수환 외. 이상지질혈증에 대한 조절과 생활요법과의 연관성
Korean Journal of Family PracticeKJFP
도는 남녀에서 차이를 보였는데, 남성에서는 두 군 간의 유의한 차이 가 없었던 반면 여성에서는 조절군이 57.1%로 비조절군의 61.8%에 비 해 더 낮은 유병률을 보였다(P=0.033). 지질강하제 복용율은 남녀 모
두 조절군이 비조절군에 비해 큰 차이로 높은 수치를 보였다(각각 56.4% vs. 35.5%, 67.1% vs. 40.3%). 고위험군의 비율 또한 남녀 모두에서 두 군 간의 큰 차이를 보였는데, 남성의 경우 24.2% vs. 43.6%, 여성의
Table 4. Subgroup analysis of health behavior in high risk group with medication Variable
Male (n=417)
P-value
Female (n=632)
P-value Uncontrolled
(n=197)
Controlled (n=220)
Uncontrolled (n=344)
Controlled (n=288) Behavioral risk factors
Current smoking
Crude proportion (%) 29.0 (21.4–38.0) 43.6 (35.7–51.8) 0.012* 2.3 (1.1–4.5) 2.3 (1.1–5.0) 0.944
Model 1 1 1.96 (1.15–3.36) 0.014* 1 1.17 (0.37–3.67) 0.786
Model 2 1 1.91 (1.10–3.30) 0.021* 1 1.12 (0.36–3.53) 0.845
Excessive alcohol consumption
Crude proportion (%) 33.7 (26.0–42.4) 39.1 (31.4–47.3) 0.354 2.7 (1.2–6.0) 4.0 (1.7–9.2) 0.500
Model 1 1 1.21 (0.72–2.05) 0.471 1 1.51 (0.49–4.65) 0.476
Model 2 1 1.16 (0.69–1.97) 0.575 1 1.74 (0.49–6.18) 0.388
Adequate physical activity
Crude proportion (%) 22.2 (16.3–29.7) 27.6 (20.9–35.4) 0.289 16.1 (11.8–21.6) 16.4 (12.1–21.9) 0.926
Model 1 1 1.38 (0.81–2.35) 0.230 1 1.02 (0.61–1.70) 0.945
Model 2 1 1.56 (0.86–2.83) 0.140 1 1.11 (0.63–1.96) 0.728
Nutritional risk factors
Adequate intake of carbohydrate
Crude proportion (%) 17.9 (12.3–25.2) 21.1 (15.0–28.9) 0.498 6.8 (4.2–10.8) 8.2 (4.9–13.5) 0.595
Model 1 1 1.14 (0.62–2.10) 0.676 1 1.13 (0.52–2.45) 0.759
Model 2 1 1.03 (0.56–1.90) 0.930 1 1.05 (0.42–2.59) 0.921
Adequate intake of fat
Crude proportion (%) 93.1 (86.7–96.6) 94.3 (88.6–97.2) 0.712 95.8 (92.3–97.8) 94.7 (90.5–97.1) 0.599
Model 1 1 1.22 (0.44–3.41) 0.705 1 0.79 (0.32–1.94) 0.607
Model 2 1 1.36 (0.50–3.67) 0.546 1 1.01 (0.38–2.64) 0.990
Adequate intake of saturated fat
Crude proportion (%) 83.6 (71.1–91.4) 83.2 (71.3–90.8) 0.953 88.8 (81.2–93.5) 88.0 (81.0–92.7) 0.859
Model 1 1 0.93 (0.33–2.57) 0.882 1 0.86 (0.37–1.99) 0.727
Model 2 1 0.82 (0.28–2.38) 0.717 1 0.86 (0.33–2.23) 0.761
Adequate intake of cholesterol
Crude proportion (%) 69.7 (56.9–80.0) 81.0 (68.9–89.2) 0.183 88.8 (81.3–93.6) 89.0 (82.1–93.5) 0.966
Model 1 1 2.82 (1.03–7.73) 0.044* 1 1.15 (0.50–2.63) 0.738
Model 2 1 2.39 (0.91–6.30) 0.078 1 0.92 (0.36–2.34) 0.866
Adequate intake of fiber
Crude proportion (%) 21.9 (15.8–29.5) 26.0 (19.8–33.4) 0.398 18.9 (14.5–24.4) 18.3 (13.9–23.7) 0.839
Model 1 1 1.24 (0.72–2.13) 0.445 1 0.98 (0.63–1.52) 0.928
Model 2 1 1.22 (0.69–2.16) 0.503 1 1.15 (0.72–1.84) 0.562
Adequate intake of sodium
Crude proportion (%) 57.4 (48.8–65.6) 68.2 (60.6–75.0) 0.052 83.2 (77.6–87.6) 80.3 (74.3–85.1) 0.417
Model 1 1 1.59 (0.98–2.58) 0.059 1 0.84 (0.52–1.36) 0.484
Model 2 1 1.76 (1.07–2.91) 0.027* 1 0.83 (0.50–1.39) 0.486
Data are presented as percentages or adjusted odds ratio with 95% confidence intervals, weighted to the Korean standard population. Crude proportions with P-values were obtained from chi-squared tests, and logistic regression analysis was performed to examine the association between control of dyslipidemia and each health be- havior with the adjustments specified.
Excessive alcohol consumption: >3–4 standard drinks/day in male, >2–3 standard drinks/day in female, Adequate physical activity: ≥30 min per session of moderate or higher intensity, 5 or more days a week, ≥200 min per week of moderate or higher intensity physical activity, Adequate intake of carbohydrate: ≤55% of total calories per day, Adequate intake of fat: <30% of total calories per day, Adequate intake of saturated fat: <7% of total calories per day, only the participants in Korean National Health and Nutrition Examination Survey (KNHANES) VI were available for analysis, Adequate intake of cholesterol: <300 mg per day, only the participants in KNHANES VI were available for analysis, Adequate intake of fiber: ≥25 g per day, Adequate intake of sodium: <5 g per day, Model 1: adjusted for age, abdominal obesity, self-per- ceived health status, education, household income, Model 2: adjusted for age, abdominal obesity, self-perceived health status, education, household income, preva- lence of diabetes, prevalence of hypertension.
*Statistically significant P<0.05.
Su Hwan Cho, et al. The Association between Lifestyle Therapy and Dyslipidemia Control
Korean Journal of Family Practice
KJFP
경우 18.3% vs. 49.2%로 조절군의 고위험군 비율이 크게 낮은 것으로 나타났다. 지질 관련 측정값들의 경우 남녀 모두에서 조절군이 비조 절군에 비해 더 낮은 TC, LDL-C 값을 보였으나, TG의 경우 남성에서
는 조절군이 더 높은 값을, 여성에서는 조절군이 더 낮은 값을 나타 냈으며, HDL-C의 경우 여성은 조절군에서 더 높은 값을 보였으나 남 성은 두 군 간의 차이가 없는 것으로 나타났다.
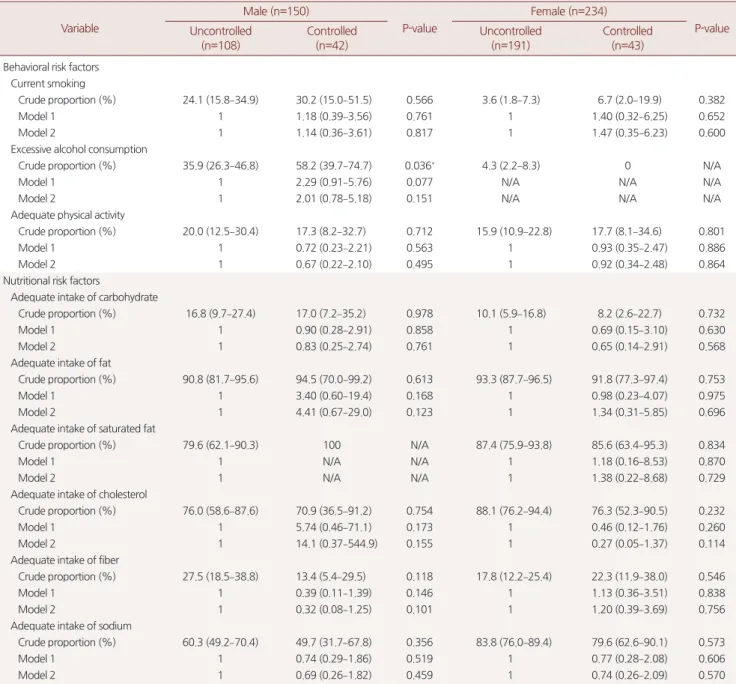
Table 5. Subgroup analysis of health behavior in high risk group without medication Variable
Male (n=150)
P-value
Female (n=234)
P-value Uncontrolled
(n=108)
Controlled (n=42)
Uncontrolled (n=191)
Controlled (n=43) Behavioral risk factors
Current smoking
Crude proportion (%) 24.1 (15.8–34.9) 30.2 (15.0–51.5) 0.566 3.6 (1.8–7.3) 6.7 (2.0–19.9) 0.382
Model 1 1 1.18 (0.39–3.56) 0.761 1 1.40 (0.32–6.25) 0.652
Model 2 1 1.14 (0.36–3.61) 0.817 1 1.47 (0.35–6.23) 0.600
Excessive alcohol consumption
Crude proportion (%) 35.9 (26.3–46.8) 58.2 (39.7–74.7) 0.036* 4.3 (2.2–8.3) 0 N/A
Model 1 1 2.29 (0.91–5.76) 0.077 N/A N/A N/A
Model 2 1 2.01 (0.78–5.18) 0.151 N/A N/A N/A
Adequate physical activity
Crude proportion (%) 20.0 (12.5–30.4) 17.3 (8.2–32.7) 0.712 15.9 (10.9–22.8) 17.7 (8.1–34.6) 0.801
Model 1 1 0.72 (0.23–2.21) 0.563 1 0.93 (0.35–2.47) 0.886
Model 2 1 0.67 (0.22–2.10) 0.495 1 0.92 (0.34–2.48) 0.864
Nutritional risk factors
Adequate intake of carbohydrate
Crude proportion (%) 16.8 (9.7–27.4) 17.0 (7.2–35.2) 0.978 10.1 (5.9–16.8) 8.2 (2.6–22.7) 0.732
Model 1 1 0.90 (0.28–2.91) 0.858 1 0.69 (0.15–3.10) 0.630
Model 2 1 0.83 (0.25–2.74) 0.761 1 0.65 (0.14–2.91) 0.568
Adequate intake of fat
Crude proportion (%) 90.8 (81.7–95.6) 94.5 (70.0–99.2) 0.613 93.3 (87.7–96.5) 91.8 (77.3–97.4) 0.753
Model 1 1 3.40 (0.60–19.4) 0.168 1 0.98 (0.23–4.07) 0.975
Model 2 1 4.41 (0.67–29.0) 0.123 1 1.34 (0.31–5.85) 0.696
Adequate intake of saturated fat
Crude proportion (%) 79.6 (62.1–90.3) 100 N/A 87.4 (75.9–93.8) 85.6 (63.4–95.3) 0.834
Model 1 1 N/A N/A 1 1.18 (0.16–8.53) 0.870
Model 2 1 N/A N/A 1 1.38 (0.22–8.68) 0.729
Adequate intake of cholesterol
Crude proportion (%) 76.0 (58.6–87.6) 70.9 (36.5–91.2) 0.754 88.1 (76.2–94.4) 76.3 (52.3–90.5) 0.232
Model 1 1 5.74 (0.46–71.1) 0.173 1 0.46 (0.12–1.76) 0.260
Model 2 1 14.1 (0.37–544.9) 0.155 1 0.27 (0.05–1.37) 0.114
Adequate intake of fiber
Crude proportion (%) 27.5 (18.5–38.8) 13.4 (5.4–29.5) 0.118 17.8 (12.2–25.4) 22.3 (11.9–38.0) 0.546
Model 1 1 0.39 (0.11–1.39) 0.146 1 1.13 (0.36–3.51) 0.838
Model 2 1 0.32 (0.08–1.25) 0.101 1 1.20 (0.39–3.69) 0.756
Adequate intake of sodium
Crude proportion (%) 60.3 (49.2–70.4) 49.7 (31.7–67.8) 0.356 83.8 (76.0–89.4) 79.6 (62.6–90.1) 0.573
Model 1 1 0.74 (0.29–1.86) 0.519 1 0.77 (0.28–2.08) 0.606
Model 2 1 0.69 (0.26–1.82) 0.459 1 0.74 (0.26–2.09) 0.570
Data are presented as percentages or adjusted odds ratio with 95% confidence intervals, weighted to the Korean standard population. Crude proportions with P-values were obtained from chi-squared tests, and logistic regression analysis was performed to examine the association between control of dyslipidemia and each health be- havior with the adjustments specified.
N/A, not available.
Excessive alcohol consumption: >3–4 standard drinks/day in male, >2–3 standard drinks/day in female, Adequate physical activity: ≥30 min per session of moderate or higher intensity, 5 or more days a week, ≥200 min per week of moderate or higher intensity physical activity, Adequate intake of carbohydrate: ≤55% of total calories per day, Adequate intake of fat: <30% of total calories per day, Adequate intake of saturated fat: <7% of total calories per day, only the participants in Korean National Health and Nutrition Examination Survey (KNHANES) VI were available for analysis, Adequate intake of cholesterol: <300 mg per day, only the participants in KNHANES VI were available for analysis, Adequate intake of fiber: ≥25 g per day, Adequate intake of sodium: <5 g per day, Model 1: adjusted for age, abdominal obesity, self-per- ceived health status, education, household income, Model 2: adjusted for age, abdominal obesity, self-perceived health status, education, household income, preva- lence of diabetes, prevalence of hypertension.
*Statistically significant P<0.05.
조수환 외. 이상지질혈증에 대한 조절과 생활요법과의 연관성
Korean Journal of Family PracticeKJFP
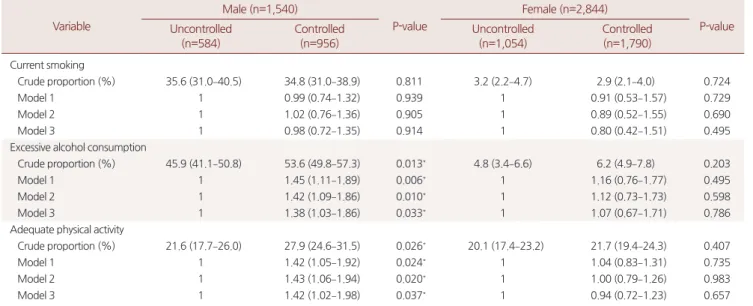
2. 행동 변수
남녀 모두에서 현재 흡연자의 비율은 조절군과 비조절군 사이에 유의한 차이를 보이지 않았다. 과도한 음주율의 경우 남성에서 조절
군이 53.6%, 비조절군이 45.9%로 조절군에서의 비율이 비조절군에 비해 오히려 높은 것으로 나타났으며, 다른 변수들에 대하여 모두 보 정한 모형에서도 교차비가 1.38 (95% CI 1.03–1.86, P=0.033)으로 유의
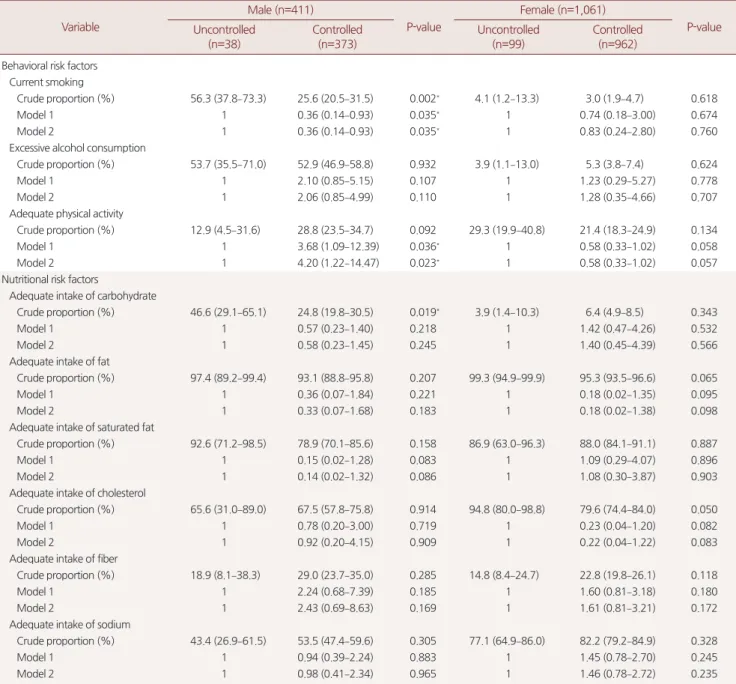
Table 6. Subgroup analysis of health behavior in low risk group with medication Variable
Male (n=411)
P-value
Female (n=1,061)
P-value Uncontrolled
(n=38)
Controlled (n=373)
Uncontrolled (n=99)
Controlled (n=962) Behavioral risk factors
Current smoking
Crude proportion (%) 56.3 (37.8–73.3) 25.6 (20.5–31.5) 0.002* 4.1 (1.2–13.3) 3.0 (1.9–4.7) 0.618
Model 1 1 0.36 (0.14–0.93) 0.035* 1 0.74 (0.18–3.00) 0.674
Model 2 1 0.36 (0.14–0.93) 0.035* 1 0.83 (0.24–2.80) 0.760
Excessive alcohol consumption
Crude proportion (%) 53.7 (35.5–71.0) 52.9 (46.9–58.8) 0.932 3.9 (1.1–13.0) 5.3 (3.8–7.4) 0.624
Model 1 1 2.10 (0.85–5.15) 0.107 1 1.23 (0.29–5.27) 0.778
Model 2 1 2.06 (0.85–4.99) 0.110 1 1.28 (0.35–4.66) 0.707
Adequate physical activity
Crude proportion (%) 12.9 (4.5–31.6) 28.8 (23.5–34.7) 0.092 29.3 (19.9–40.8) 21.4 (18.3–24.9) 0.134
Model 1 1 3.68 (1.09–12.39) 0.036* 1 0.58 (0.33–1.02) 0.058
Model 2 1 4.20 (1.22–14.47) 0.023* 1 0.58 (0.33–1.02) 0.057
Nutritional risk factors
Adequate intake of carbohydrate
Crude proportion (%) 46.6 (29.1–65.1) 24.8 (19.8–30.5) 0.019* 3.9 (1.4–10.3) 6.4 (4.9–8.5) 0.343
Model 1 1 0.57 (0.23–1.40) 0.218 1 1.42 (0.47–4.26) 0.532
Model 2 1 0.58 (0.23–1.45) 0.245 1 1.40 (0.45–4.39) 0.566
Adequate intake of fat
Crude proportion (%) 97.4 (89.2–99.4) 93.1 (88.8–95.8) 0.207 99.3 (94.9–99.9) 95.3 (93.5–96.6) 0.065
Model 1 1 0.36 (0.07–1.84) 0.221 1 0.18 (0.02–1.35) 0.095
Model 2 1 0.33 (0.07–1.68) 0.183 1 0.18 (0.02–1.38) 0.098
Adequate intake of saturated fat
Crude proportion (%) 92.6 (71.2–98.5) 78.9 (70.1–85.6) 0.158 86.9 (63.0–96.3) 88.0 (84.1–91.1) 0.887
Model 1 1 0.15 (0.02–1.28) 0.083 1 1.09 (0.29–4.07) 0.896
Model 2 1 0.14 (0.02–1.32) 0.086 1 1.08 (0.30–3.87) 0.903
Adequate intake of cholesterol
Crude proportion (%) 65.6 (31.0–89.0) 67.5 (57.8–75.8) 0.914 94.8 (80.0–98.8) 79.6 (74.4–84.0) 0.050
Model 1 1 0.78 (0.20–3.00) 0.719 1 0.23 (0.04–1.20) 0.082
Model 2 1 0.92 (0.20–4.15) 0.909 1 0.22 (0.04–1.22) 0.083
Adequate intake of fiber
Crude proportion (%) 18.9 (8.1–38.3) 29.0 (23.7–35.0) 0.285 14.8 (8.4–24.7) 22.8 (19.8–26.1) 0.118
Model 1 1 2.24 (0.68–7.39) 0.185 1 1.60 (0.81–3.18) 0.180
Model 2 1 2.43 (0.69–8.63) 0.169 1 1.61 (0.81–3.21) 0.172
Adequate intake of sodium
Crude proportion (%) 43.4 (26.9–61.5) 53.5 (47.4–59.6) 0.305 77.1 (64.9–86.0) 82.2 (79.2–84.9) 0.328
Model 1 1 0.94 (0.39–2.24) 0.883 1 1.45 (0.78–2.70) 0.245
Model 2 1 0.98 (0.41–2.34) 0.965 1 1.46 (0.78–2.72) 0.235
Data are presented as percentages or adjusted odds ratio with 95% confidence intervals, weighted to the Korean standard population. Crude proportions with P-values were obtained from chi-squared tests, and logistic regression analysis was performed to examine the association between control of dyslipidemia and each health be- havior with the adjustments specified.
Excessive alcohol consumption: >3–4 standard drinks/day in male, >2–3 standard drinks/day in female, Adequate physical activity: ≥30 min per session of moderate or higher intensity, 5 or more days a week, ≥200 min per week of moderate or higher intensity physical activity, Adequate intake of carbohydrate: ≤55% of total calories per day, Adequate intake of fat: <30% of total calories per day, Adequate intake of saturated fat: <7% of total calories per day, only the participants in Korean National Health and Nutrition Examination Survey (KNHANES) VI were available for analysis, Adequate intake of cholesterol: <300 mg per day, only the participants in KNHANES VI were available for analysis, Adequate intake of fiber: ≥25 g per day, Adequate intake of sodium: <5 g per day, Model 1: adjusted for age, abdominal obesity, self-per- ceived health status, education, household income, Model 2: adjusted for age, abdominal obesity, self-perceived health status, education, household income, preva- lence of diabetes, prevalence of hypertension.
*Statistically significant P<0.05.
Su Hwan Cho, et al. The Association between Lifestyle Therapy and Dyslipidemia Control
Korean Journal of Family Practice
KJFP
하게 높은 것으로 나타났다. 적절한 신체 활동의 경우 남성에서 조절 군이 비조절군에 비해 유의하게 높은 것으로 나타났으며(27.9% vs.
21.6%), 다른 변수들에 대하여 모두 보정한 모형에서도 교차비가 1.42
(95% CI 1.02–1.98, P=0.037)로 유의하게 높게 나타났다. 여성의 경우 과도한 음주율, 적절한 신체 활동 변수에서 두 군 간에 유의한 차이 를 보이지 않았다(Table 2).
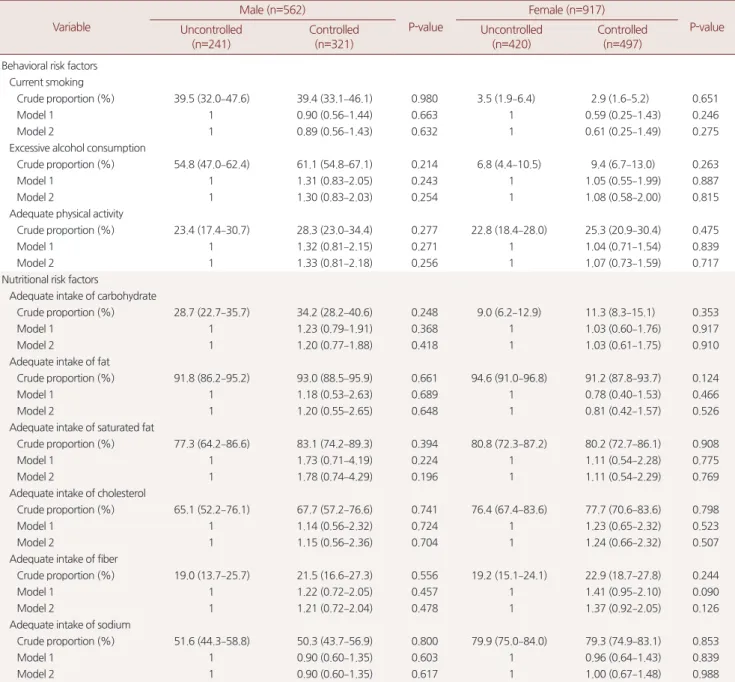
Table 7. Subgroup analysis of health behavior in low risk group without medication Variable
Male (n=562)
P-value
Female (n=917)
P-value Uncontrolled
(n=241)
Controlled (n=321)
Uncontrolled (n=420)
Controlled (n=497) Behavioral risk factors
Current smoking
Crude proportion (%) 39.5 (32.0–47.6) 39.4 (33.1–46.1) 0.980 3.5 (1.9–6.4) 2.9 (1.6–5.2) 0.651
Model 1 1 0.90 (0.56–1.44) 0.663 1 0.59 (0.25–1.43) 0.246
Model 2 1 0.89 (0.56–1.43) 0.632 1 0.61 (0.25–1.49) 0.275
Excessive alcohol consumption
Crude proportion (%) 54.8 (47.0–62.4) 61.1 (54.8–67.1) 0.214 6.8 (4.4–10.5) 9.4 (6.7–13.0) 0.263
Model 1 1 1.31 (0.83–2.05) 0.243 1 1.05 (0.55–1.99) 0.887
Model 2 1 1.30 (0.83–2.03) 0.254 1 1.08 (0.58–2.00) 0.815
Adequate physical activity
Crude proportion (%) 23.4 (17.4–30.7) 28.3 (23.0–34.4) 0.277 22.8 (18.4–28.0) 25.3 (20.9–30.4) 0.475
Model 1 1 1.32 (0.81–2.15) 0.271 1 1.04 (0.71–1.54) 0.839
Model 2 1 1.33 (0.81–2.18) 0.256 1 1.07 (0.73–1.59) 0.717
Nutritional risk factors
Adequate intake of carbohydrate
Crude proportion (%) 28.7 (22.7–35.7) 34.2 (28.2–40.6) 0.248 9.0 (6.2–12.9) 11.3 (8.3–15.1) 0.353
Model 1 1 1.23 (0.79–1.91) 0.368 1 1.03 (0.60–1.76) 0.917
Model 2 1 1.20 (0.77–1.88) 0.418 1 1.03 (0.61–1.75) 0.910
Adequate intake of fat
Crude proportion (%) 91.8 (86.2–95.2) 93.0 (88.5–95.9) 0.661 94.6 (91.0–96.8) 91.2 (87.8–93.7) 0.124
Model 1 1 1.18 (0.53–2.63) 0.689 1 0.78 (0.40–1.53) 0.466
Model 2 1 1.20 (0.55–2.65) 0.648 1 0.81 (0.42–1.57) 0.526
Adequate intake of saturated fat
Crude proportion (%) 77.3 (64.2–86.6) 83.1 (74.2–89.3) 0.394 80.8 (72.3–87.2) 80.2 (72.7–86.1) 0.908
Model 1 1 1.73 (0.71–4.19) 0.224 1 1.11 (0.54–2.28) 0.775
Model 2 1 1.78 (0.74–4.29) 0.196 1 1.11 (0.54–2.29) 0.769
Adequate intake of cholesterol
Crude proportion (%) 65.1 (52.2–76.1) 67.7 (57.2–76.6) 0.741 76.4 (67.4–83.6) 77.7 (70.6–83.6) 0.798
Model 1 1 1.14 (0.56–2.32) 0.724 1 1.23 (0.65–2.32) 0.523
Model 2 1 1.15 (0.56–2.36) 0.704 1 1.24 (0.66–2.32) 0.507
Adequate intake of fiber
Crude proportion (%) 19.0 (13.7–25.7) 21.5 (16.6–27.3) 0.556 19.2 (15.1–24.1) 22.9 (18.7–27.8) 0.244
Model 1 1 1.22 (0.72–2.05) 0.457 1 1.41 (0.95–2.10) 0.090
Model 2 1 1.21 (0.72–2.04) 0.478 1 1.37 (0.92–2.05) 0.126
Adequate intake of sodium
Crude proportion (%) 51.6 (44.3–58.8) 50.3 (43.7–56.9) 0.800 79.9 (75.0–84.0) 79.3 (74.9–83.1) 0.853
Model 1 1 0.90 (0.60–1.35) 0.603 1 0.96 (0.64–1.43) 0.839
Model 2 1 0.90 (0.60–1.35) 0.617 1 1.00 (0.67–1.48) 0.988
Data are presented as percentages or adjusted odds ratio with 95% confidence intervals, weighted to the Korean standard population. Crude proportions with P-values were obtained from chi-squared tests, and logistic regression analysis was performed to examine the association between control of dyslipidemia and each health be- havior with the adjustments specified.
Excessive alcohol consumption: >3–4 standard drinks/day in male, >2–3 standard drinks/day in female, Adequate physical activity: ≥30 min per session of moderate or higher intensity, 5 or more days a week, ≥200 min per week of moderate or higher intensity physical activity, Adequate intake of carbohydrate: ≤55% of total calories per day, Adequate intake of fat: <30% of total calories per day, Adequate intake of saturated fat: <7% of total calories per day, only the participants in Korean National Health and Nutrition Examination Survey (KNHANES) VI were available for analysis, Adequate intake of cholesterol: <300 mg per day, only the participants in KNHANES VI were available for analysis, Adequate intake of fiber: ≥25 g per day, Adequate intake of sodium: <5 g per day, Model 1: adjusted for age, abdominal obesity, self-per- ceived health status, education, household income, Model 2: adjusted for age, abdominal obesity, self-perceived health status, education, household income, preva- lence of diabetes, prevalence of hypertension.
조수환 외. 이상지질혈증에 대한 조절과 생활요법과의 연관성
Korean Journal of Family PracticeKJFP
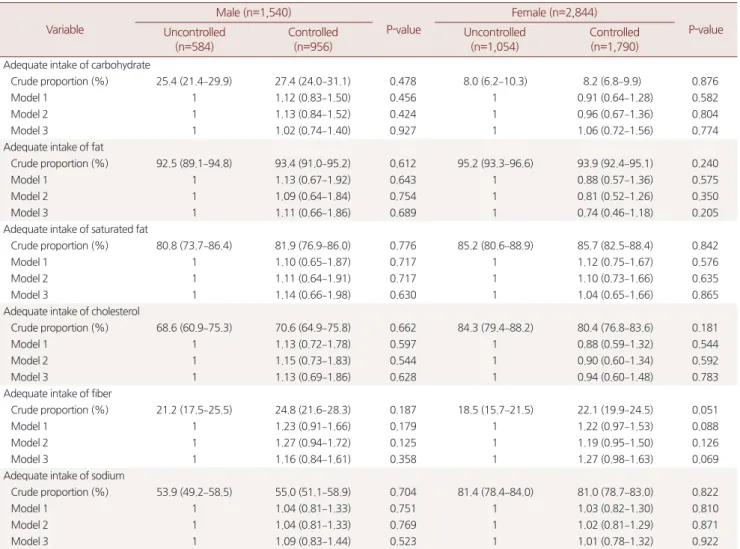
3. 영양 변수
적절한 탄수화물, 지방, 포화지방산, 콜레스테롤, 식이섬유, 나트륨 섭취 관련 변수에서 남녀 모두 두 군 간에 유의한 차이를 나타내지 않았다(Table 3).
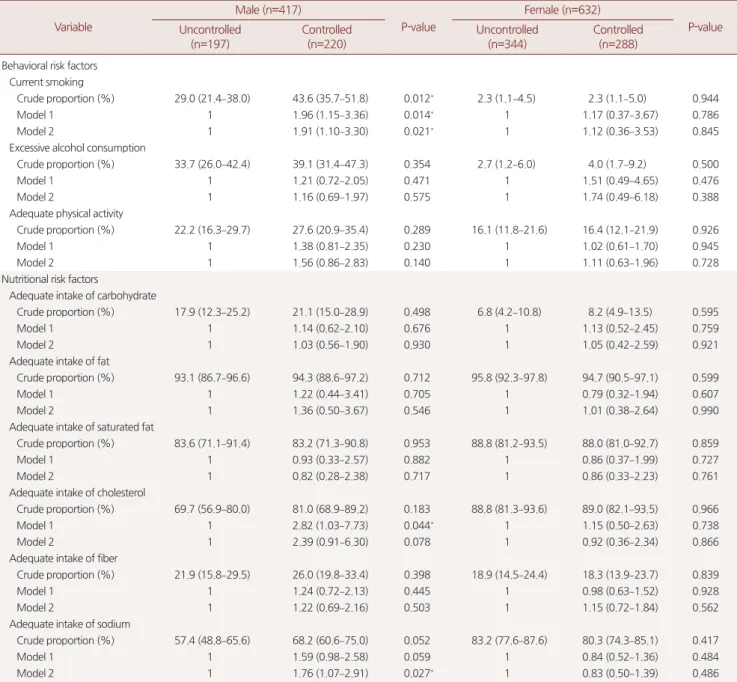
4. 하위 그룹 분석
일반적 특성 변수에서 조절군과 비조절군 사이의 가장 큰 차이를 나타냈던 변수는 현재 지질강하제 투약 여부 및 고위험군의 비율이 었는데, 이를 기준으로 지질강하제 투약 여부 및 고위험군의 여부에 따라 총 4개의 하위 그룹을 만들고 분석을 진행하였다. 먼저 고위험 군-투약군에서 남성 조절군이 비조절군보다 더 높은 흡연율을 보였 으며(OR 1.91, 95% CI 1.10–3.30), 나트륨 섭취의 경우 조절군이 비조절 군에 비해 더 적절한 섭취를 하는 것으로 나타났다(OR 1.76, 95% CI 1.07–2.91). 콜레스테롤 섭취의 경우 남성에서 기본 특성 변수에 대해 서만 보정한 모형 1에서는 조절군이 비조절군에 비해 더 적절한 섭 취를 하는 것으로 나타났으나(OR 2.82, 95% CI 1.03–7.73), 당뇨 및 고 혈압의 유병까지 함께 보정한 모형 2에서는 유의한 차이를 보이지 않았다(OR 2.39, 95% CI 0.91–6.30) (Table 4).
고위험군-비투약군 남성에서 조절군이 비조절군에 비해 과도한 음주율이 더 높은 것으로 나타났으나(58.2% vs. 35.9%), 보정 후의 모 형에서는 유의한 차이를 보이지 않는 것으로 나타났다(OR 2.01, 95%
CI 0.78–5.18) (Table 5).
저위험군-투약군은 남성에서 조절군이 비조절군에 비해 더 낮은 흡연율을 보였으며(OR 0.36, 95% CI 0.14–0.93), 더 높은 적정 신체 활 동 비율을 보였다(OR 4.20, 95% CI 1.22–14.47). 또한, 탄수화물 적정 섭취율이 비조절군에 비해 더 낮은 것으로 나타났는데(24.8% vs.
46.6%), 보정 후 모형에서는 유의한 차이를 보이지 않았다(OR 0.58, 95% CI 0.23–1.45) (Table 6). 저위험군-비투약군에서는 남녀 모두에서 조절군과 비조절군 간의 유의한 차이를 보이지 않았다(Table 7).
고 찰
중국 북동부 지역에서 수행된 이상지질혈증의 조절 여부와 연관 성이 있는 변수 탐색 연구에서는, 지질강하제 투약군에서 과체중이 거나 비만일 경우(OR 0.404, 95% CI 0.235–0.695) 및 운동 부족 상태 일 경우 (OR 0.423, 95% CI 0.215–0.830)에 해당할 경우에 이상지질혈 증 조절이 더 안 되는 것으로 나타났다.15) 그러나 해당 연구에는 기타 다른 생활요법에 해당하는 변수가 포함되지 않았고, 지질강하제 투 약을 하지 않고 있는 저위험군은 배제되었다는 한계점이 있다.
본 연구는 임상 진료지침에서 제시되는 생활요법과 이상지질혈증
의 조절 사이의 연관성을 보고자 수행되었고, 그 결과 이상지질혈증 의 조절과 생활요법 사이의 연관성은 성별로 차이를 보이는 것으로 나타났다. 남성의 경우 생활요법에서 권고하는 적절한 신체활동을 하는 비율이 조절군에서 비조절군에 비해 더 높은 결과를 보였고, 과도한 음주율의 경우 예상과 달리 조절군이 비조절군에 비해 높게 나타났다. 여성의 경우에는 이상지질혈증의 조절 여부와 생활요법 관련 변수들과의 연관성이 뚜렷하게 나타나지 않았다.
우선 과도한 음주율의 경우 남성 조절군이 비조절군에 비해 높게 나타난 것은, 조절군에서 저위험군의 비율이 높기 때문인 것으로 보 인다. 남성 총 연구 대상자 1,540명 중 63.2%에 해당하는 973명이 저위 험군인데, 하위 그룹 분석을 보면 고위험군에 비해 저위험군의 과도 한 음주율이 전반적으로 높은 것을 알 수 있다. 전체 조절군에서 저 위험군이 차지하는 비율은 75.8%로, 비조절군의 54.4%에 비해 상당 히 큰 차이로 더 높은 비율을 보였기 때문에, 조절군에서 오히려 과 도한 음주율이 높은 것과의 연관성을 보인 것은 저위험군의 비율이 높기 때문이라고 생각해 볼 수 있다. 남성에서의 과도한 음주는 전 세계적으로 15세에서 59세 사이에서 심혈관질환을 포함한 다양한 질병 및 사고를 유발하여 사망에 이르게 하는 가장 주요한 인자16)로 알려져 있기 때문에, 지속적으로 조절 여부에 상관없이 모든 이상지 질혈증 환자들에게 과도한 음주를 하지 말 것을 권고해야 할 것으로 판단된다.
남성의 경우 조절군에서 적절한 신체 활동을 하는 비율이 더 높 은 것과의 연관성을 보였는데, 이는 이전 연구들에서 얻어진 결론과 유사하다. 이전부터 적절한 신체활동이 심혈관질환을 줄이고 총 사 망률을 줄인다는 것이 여러 연구를 통해 알려져 왔으며,17,18) 이상지 질혈증 환자들의 지질 관련 측정값들을 더 좋게 만든다는 것도 역시 메타 분석을 통해 밝혀져 있는 사실이다.19) 또한, 덴마크에서 수행된 5년간의 신체활동 변화 관련한 연구에 따르면, 5년간 신체활동을 증 가시킨 경우 남녀 모두에서 TC, LDL-C, TG의 감소 및 남성에서의 HDL-C의 증가와 연관성을 보였다.20)
적절한 신체활동의 기준은 진료지침별로 약간의 차이가 있으나, American College of Sports Medicine은 심혈관질환을 유발하는 주범 인 동맥경화의 핵심 요소인 LDL-C을 낮추기 위해서는, 기존에 권고 하던 적정 운동량보다 더 많은 양의 운동을 시행하여 장기적으로 체중 감량까지 고려하기 위한 신체활동이 필요하다는 것을 권고하 고 있다.21) 이번 연구에서도 이러한 점을 고려하여 주당 5일 이상, 하 루 30분 이상, 주당 200분 이상의 중등도 강도 이상의 신체 활동을 할 것을 권고안으로 정한 2015 NLA 진료 지침8)을 기준으로 삼아 연 구를 수행하였고, 남성의 경우 조절군의 적절한 신체활동율이 유의 하게 높은 것으로 나타났기 때문에 이러한 신체활동의 효과가 이상
Su Hwan Cho, et al. The Association between Lifestyle Therapy and Dyslipidemia Control
Korean Journal of Family Practice
KJFP
지질혈증의 조절에 긍정적인 영향을 미쳤을 것이라 추측해 볼 수 있 다.
이상지질혈증 관리에서 LDL-C을 목표 수치로 조절하는 것은 매 우 중요하다. 이미 지질강하제를 투약하고 있는 사람들을 대상으로 한 메타분석 연구에서도 LDL-C을 더 낮추는 것이 심근경색과 허혈 성 뇌졸중의 발생을 줄일 수 있다는 것을 보여준 바 있기 때문에,5) 모 든 이상지질혈증 진료지침에서 강조하고 있는 것처럼 생활요법을 통 해 LDL-C을 추가적으로 더 낮추고 이를 통해 이상지질혈증을 적절 히 관리하는 것이 또 하나의 핵심적인 요소가 될 것이다.
이번 연구는 우리나라 일반 인구를 대표할 수 있는 국민건강영양 조사 자료를 이용하여 이상지질혈증 조절과 생활요법 사이의 연관 성을 본 최초의 연구라는 점, 생활요법 관련하여 수행된 이전 연구 들에 새롭게 추가된 근거를 포함하여 최신의 기준을 사용하여 분석 했다는 점, 9년에 걸친 자료를 이용하여 최대한 많은 대상자 수를 포 함하여 연구했다는 점에서 의의가 있다. 그러나 단면 연구이므로 생 활요법과 이상지질혈증의 조절 간의 인과적 관계를 알 수는 없었다 는 점, LDL-C만을 기준으로 이상지질혈증 조절군을 설정하여 고중 성지방혈증과 같은 변수를 고려하지 않았다는 점, 설문조사를 바탕 으로 한 생활요법 관련 변수들의 조사의 한계로 회상 치우침과 같은 오류가 발생할 수 있다는 점이 이번 연구의 한계점이다. 추후 국내에 서도 이러한 생활요법이 이상지질혈증 조절에 미치는 영향에 대해 좀 더 확실하고 타당한 결과를 얻기 위해선 추가적인 연구가 필요할 것으로 생각된다.
요 약
연구배경:
이상지질혈증은 심혈관질환의 주된 원인으로 알려져 있 는 질환으로, 유병률 또한 전세계적으로 꾸준히 증가하고 있는 질환 이다. 이상지질혈증의 치료율은 꾸준히 증가하고 있으나 아직 불충 분하며, 심혈관질환 예방을 위해 더 철저한 조절이 필요하다. 그러기 위해선 이상지질혈증 치료의 핵심인 지질강하제 사용과 더불어 생 활요법의 준수 또한 중요한데, 본 연구에서는 임상 진료지침에서 권 고하는 생활요법의 준수와 조절 여부 사이의 연관성을 알아보고자 하였다.방법:
국민건강영양조사 제 4–6기(2007–2015년) 자료를 이용하여 20세 이상의 성인 중 이상지질혈증 인지군 4,384명을 대상자로 선정 하였다. 조절 여부에 따른 이상지질혈증 임상 진료지침에서 권고되 는 생활요법(금연, 과도한 음주 제한, 적절한 신체활동, 적절한 영양 소 섭취)의 준수와의 연관성을 보기 위해 다변량 회귀분석을 수행 하였다.결과:
이상지질혈증 남성 조절군에서 더 높은 과도한 음주율(OR 1.38, 95% CI 1.03–1.86)을 보였고, 더 높은 적절한 신체활동율을 보이 는 것(OR 1.42, 95% CI 1.02–1.98)으로 나타났다. 적절한 영양소 섭취 는 조절군과 비조절군 사이에서 차이를 보이지 않았으며, 여성의 경 우 생활요법 준수와 조절 여부 사이의 어떠한 연관성도 보이지 않았 다. 하위 그룹 분석에서, 저위험군-치료군의 경우 남성 조절군이 더 낮은 흡연율(OR 0.36, 95% CI 0.14–0.93)과 더 높은 적절한 신체활동 율(OR 4.20, 95% CI 1.22–14.47)을 나타냈다.결론:
생활요법 중 적절한 신체활동을 하는 것이 이상지질혈증 조절 의 중요한 영향을 끼치는 것으로 보인다. 보다 더 적절한 이상지질혈 증의 조절을 위해서는, 환자들에 대한 충분한 교육과 사회문화적인 인식 제고를 통해 이러한 생활요법의 중요성이 더 강조되어야 할 것 이다.중심단어:
이상지질혈증; 생활 습관; 행동; 흡연; 음주; 운동; 임상지 침; 식이REFERENCES