Association between Nutrition Label Use and Chronic Disease in Korean Adults: The Fourth Korea National Health and Nutrition Examination Survey 2008-2009
Nutrition labels are helpful for chronic disease management in patients requiring balanced nutritional intake. This study aimed to investigate the association between the use of nutrition labels and chronic diseases (hypertension, diabetes mellitus, and hyperlipidemia) by using the 2008-2009 Korea National Health and Nutrition Examination Survey data. A total of 10,695 individuals aged 20 and over was included in the analysis. Using multiple logistic regressions, there was no difference in nutrition label use between the chronic disease and normal groups (men with hypertension OR, 0.97; 95% CI, 0.75-1.27; women with hypertension OR, 0.83; 95% CI, 0.67-1.03; men with diabetes OR, 0.70; 95% CI, 0.45-1.08; women with diabetes OR, 1.13; 95% CI, 0.84-1.53; men with hyperlipidemia OR, 0.85; 95% CI, 0.59-1.23; women with hyperlipidemia OR, 1.14; 95% CI, 0.91-1.44).
In hyperlipidemia patients, awareness (OR, 1.55; 95% CI, 1.03-2.35) and control (OR, 2.19; 95% CI, 2.32-3.63) of disease were related to nutrition label use; however, no significant associations were found for the hypertension and diabetes mellitus patients.
Considering the importance of dietary habits in the management of chronic diseases, an improvement in nutrition label use by patients with these diseases is required.
Keywords: Nutrition Labeling; Chronic Disease Sung-woo Hong,1 Seung-Won Oh,2
CheolMin Lee,2 Hyuktae Kwon,2 Jung-hyeon Hyeon,3 and Jong-seop Gwak3
1Gunsan Health Center, Gunsan; 2Department of Family Medicine, Seoul National University Hospital Healthcare System Gangnam Center, Seoul;
3Department of Family Medicine, Seoul National University Hospital, Seoul, Korea
Received: 1 April 2014 Accepted: 17 July 2014 Address for Correspondence:
Seung-Won Oh, MD
Gangnam Finance Center, 152 Teheran-ro, Gangnam-gu, Seoul 135-984, Korea
Tel: +82.2-2112-5643, Fax: +82.2-2112-5794 E-mail: [email protected]
Funding: This study was supported by a grant from the SK Telecom Research Fund (34-2013-0310).
http://dx.doi.org/10.3346/jkms.2014.29.11.1457 • J Korean Med Sci 2014; 29: 1457-1463
INTRODUCTION
The incidence of chronic diseases such as diabetes mellitus, hy- perlipidemia, and hypertension is increasing worldwide. The prevention and management of these diseases has become an important public health issue in Korea (1, 2). Several studies have shown an association between dietary habits and the de- velopment and progression of chronic disease (3-5). Further- more, many treatment guidelines emphasize the importance of a healthy diet for the prevention and management of these dis- eases (6, 7). As such, appropriate nutrition is an important as- pect of public health (8).
Globally, many countries have introduced policies to modify nutrition intake of the public. Of these, nutrition labels help con- sumers to modify their nutrition intake by providing the nutri- tional values or ingredient contents of the products that they purchase (8, 9). The United States introduced nutrition labeling in the 1990s, and this is currently a mandatory component of all processed foods (10). Recently, the US Food and Drug Admin- istration (FDA) proposed an update to the nutrition label to re- flect the latest research on chronic disease and nutrition (11).
Canada introduced voluntary nutrition labeling in 1988, which became mandatory in 2003 (8). In 1993, the US FDA predicted
that the introduction of mandatory nutrition labeling could prevent 39,200 cardiovascular disease and cancer cases and 12,902 deaths for 20 yr (12). Korea introduced nutrition labeling in 1994. Since then, various processed food products have been designated for nutrition labeling (13).
Nutrition labeling can provide chronic disease patients, who wish to maintain a healthy diet, with specific information about the food products they consume. A study using data from the US National Health and Nutrition Examination Survey (NHANES) reported that chronic disease patients who had received nutri- tion education were 50% more likely to read nutrition labels.
Furthermore, those who read nutrition labels tended to con- sume less calories, saturated fatty acids, and carbohydrates (14).
A study using data from the Korea National Health and Nutri- tion Examination Survey (KNHANES) showed that consumers who use nutrition labeling had a lower risk of developing meta- bolic syndromes (15).
Chronic disease patients should actively use nutrition labels;
however, limited studies have investigated the use of nutrition labels and its associated factors in patients with chronic diseas- es. Several studies reported that chronic disease patients use nutrition labels more frequently than healthy persons (16, 17);
however, a study showed no association between nutrition la- Medicine General & Social Medicine
bel use and diabetes mellitus among Latino Americans (18).
Se veral studies analyzed the effect of various factors on the use of nutrition labels and the perception of nutrition labels in con- sumers (19-21); however, to the best of our knowledge, no study has investigated the use of nutrition labels by chronic disease patients in Korea. Therefore, the aim of this study was to inves- tigate the association between the use of nutrition labels and chronic diseases in adult Koreans.
MATERIALS AND METHODS Study participants
Data were collected from the fourth KNHANES, which is a na- tional project that investigates the health status, health aware- ness and actions, and food and nutritional intake of all house- holds and citizens living in the Republic of Korea. The survey, based on the Population and Housing Census Report conduct- ed by the National Statistical Office in 2005, selected and inter- viewed household members aged 1 yr and above from approxi- mately 13,800 households in 600 districts. The samples were se- lected using a 3-step stratified cluster sampling method. The Rolling Survey Sample method was used so that each rolling sample of a year represents a probability sample of the country.
The rolling samples were made to be independent and homo- geneous. Health surveys and examinations were performed in a mobile health examination center, and the nutrition surveys were performed by visiting the households.
In total 20,277 people completed the survey and health ex- amination. Excluded from analysis were 5,371 people who were under the age of 20 yr, 3,404 people who did not answer ques- tions on history of chronic disease and the use of nutrition la- bels, and 807 people who had a history of stroke, myocardial infarction, angina, and cancer. The final study population con- sisted of 10,695 participants.
Variables associated with chronic disease and the use of nutrition labels
Hypertension was defined as having a systolic blood pressure of ≥ 140 mmHg or a diastolic blood pressure of ≥ 90 mmHg (measured in the arm at the heart level), or taking antihyper- tensive medications at the time of the study. Diabetes was de- fined as having fasting glucose concentration of ≥ 126 mg/dL or as taking diabetic medications at the time of the study. Hy- perlipidemia was defined as having total cholesterol of ≥ 240 mg/dL or as taking hyperlipidemia medications at the time of the study. Those who answered that they had been diagnosed by a medical professional with one or more chronic diseases were defined as having an awareness of these diseases. Partici- pants that were considered in control of their chronic disease were defined as having a systolic blood pressure < 140 mmHg or a diastolic blood pressure < 90 mmHg for hypertension; a
HbA1c level of ≤ 6.5% for diabetes; or a total cholesterol con- centration ≤ 200 mg/dL for hyperlipidemia. For the use of nu- trition labels, the question “Do you read the nutrition label when buying or choosing processed foods?” was asked. Those who answered “I do not know what a nutrition label is” or “I do not read nutrition labels” were classified as those who did not use the nutrition label, whereas those who answered “I do read nu- trition labels” were classified into the group that read the nutri- tion labels.
Socio-demographic variables
A trained investigator conducted interviews to collect the par- ticipants’ socio-demographic data, from which variables were selected that were closely associated with nutrition labels using previous studies as references (14, 22). The final variables se- lected were age, gender, household income, number of house- hold members (1, 2, 3, or 4 or more persons), marital status (sin- gle, separated or divorced, married), duration of education (6 yr or under, 7 to 12 yr, 13 yr or more), obesity, smoking status (non- smoker, ex-smoker, current smoker), and the frequency of alco- hol intake (non-drinker, once a week or less, at least twice per week). Those who answered “yes” to the question “Have you received nutrition education or consultation from a public health center, government office, social welfare facility, school, or hos- pital in the past 12 months?” were classified as having received nutrition education.
Statistical analyses
In order to represent all Korean adults without biased estimates, sampling weights were applied to account for the complex sam- pling. The chi-square test and t-test were conducted to investi- gate the general characteristics of the participants depending on nutrition label use. The Mantel-Haenszel homogeneity method was used to confirm that gender stratified analysis was possi- ble. Subsequently, the participants were analyzed according to gender. Multiple logistic regression analysis was performed, while controlling for the previously identified variables that were asso- ciated with nutrition label use, to confirm the association be- tween chronic disease and the use of nutrition labels. The same method was used to investigate the association between the state of chronic disease, as defined by the self-report, and the use of nutrition labels. Lastly, the association between the aware- ness and controls of chronic disease, and the use of nutrition label was analyzed among patients with each chronic disease.
All data were statistically analyzed using STATA 12.0 for Win- dows, and two-sided tests were conducted to set the P value at 0.05 or below.
Ethics statement
This study was approved by the institutional review board of Seoul National University Hospital in Seoul, Korea (IRB num-
ber: 1407-003-591). Informed consent was exempted by the in- stitutional review board.
RESULTS
General characteristics of the study participants
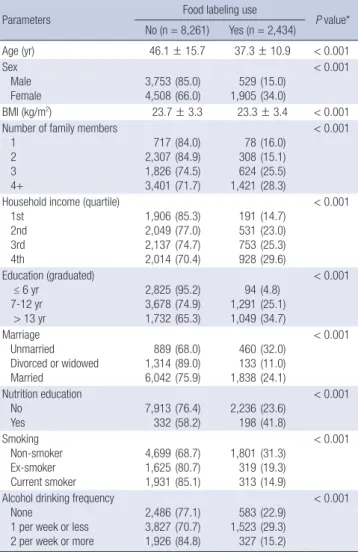
The basic characteristics of the study participants are shown in Table 1. Of the 10,695 participants, 2,434 (24.4%) used nutrition labels and 8,261 (75.6%) did not use nutrition labels. Nutrition labels were used by 15.0% of men and 34.0% of women, indi- cating that women were more likely to use nutrition labels. The mean age of those using nutrition labels was 37.3 yr, whereas the mean age of those not using nutrition labels was 46.1 yr, in- dicating that younger people were more likely to use nutrition labels. Study participants who used nutrition labels had a lower BMI than those who did not use nutrition labels. Furthermore, people who had a larger number of household members, had a higher household income, or had a higher level of education
were more likely to use nutrition labels. Of those who had re- ceived nutrition education, 41.8% used nutrition labels, where- as only 23.6% of those who did not receive nutrition education used nutrition labels. Non-smokers were more likely to use nu- trition labels compared with current or ex-smokers. In addition, those who drank alcohol once or less per week were more likely to use nutrition labels compared with non-drinkers or those who drank alcohol twice or more per week.
The association between chronic disease and the use of nutrition labels
Patients with a chronic disease were less likely to use nutrition labels than people without a chronic disease (hypertension 12.2%
vs. 27.8%; diabetes 13.2% vs. 25.4%; hyperlipidemia 18.7% vs.
25.1%). Similarly, when the status of chronic disease was de- fined by self-report, those who had answered that they were di- agnosed with chronic disease by a medical professional had a lower rate of nutrition label use (Table 2).
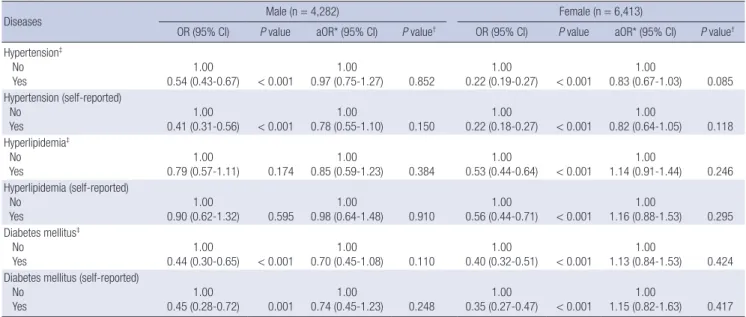
The association between chronic disease and the use of nu- trition labels was analyzed by dividing the participants into their respective gender group and controlling for variables that are associated with nutrition label use (Table 3). There was no signi- ficant difference in the use of nutrition labels between the group with chronic disease and the group without, for both genders (men with hypertension odds ratio [OR], 0.97; 95% confidence interval [CI], 0.75-1.27; women with hypertension OR, 0.83; 95%
CI, 0.67-1.03; men with diabetes OR, 0.70; 95% CI, 0.45-1.08; wo- men with diabetes OR, 1.13; 95% CI, 0.84-1.53; men with hyper- Table 1. General characteristics of the study population (n = 10,695)
Parameters Food labeling use
P value*
No (n = 8,261) Yes (n = 2,434)
Age (yr) 46.1 ± 15.7 37.3 ± 10.9 < 0.001
Sex Male
Female 3,753
4,508(85.0)
(66.0) 529
1,905(15.0) (34.0)
< 0.001
BMI (kg/m2) 23.7 ± 3.3 23.3 ± 3.4 < 0.001
Number of family members 1
2 3 4+
717 2,307 1,826 3,401
(84.0) (84.9) (74.5) (71.7)
78 308 624 1,421
(16.0) (15.1) (25.5) (28.3)
< 0.001
Household income (quartile) 1st
2nd 3rd 4th
1,906 2,049 2,137 2,014
(85.3) (77.0) (74.7) (70.4)
191 531 753 928
(14.7) (23.0) (25.3) (29.6)
< 0.001
Education (graduated)
≤ 6 yr 7-12 yr
> 13 yr
2,825 3,678 1,732
(95.2) (74.9) (65.3)
94 1,291 1,049
(4.8) (25.1) (34.7)
< 0.001
Marriage Unmarried Divorced or widowed Married
889 1,314 6,042
(68.0) (89.0) (75.9)
460 133 1,838
(32.0) (11.0) (24.1)
< 0.001
Nutrition education No
Yes 7,913
332(76.4)
(58.2) 2,236 198(23.6)
(41.8)
< 0.001
Smoking Non-smoker Ex-smoker Current smoker
4,699 1,625 1,931
(68.7) (80.7) (85.1)
1,801 319 313
(31.3) (19.3) (14.9)
< 0.001
Alcohol drinking frequency None
1 per week or less 2 per week or more
2,486 3,827 1,926
(77.1) (70.7) (84.8)
583 1,523 327
(22.9) (29.3) (15.2)
< 0.001
Unit: weighted mean ± SD or number (weighted proportion). *P values were calcu- lated by chi-square test (categorical variables) or t-test (continuous variables). BMI, body mass index.
Table 2. Association between chronic disease status and food labeling use in the study population (n = 10,695)
Diseases Food labeling use
P value*
No (n = 8,261) Yes (n = 2,434) Hypertension†
No
Yes 5,770
2,491(72.2)
(87.8) 2,167 267(27.8)
(12.2)
< 0.001
Hypertension (self-reported) No
Yes 6,411
1,850(73.1)
(89.8) 2,261 173(26.9)
(10.2)
< 0.001
Hyperlipidemia† No
Yes 7,288
973(74.9)
(81.3) 2,246 188(25.1)
(18.7)
< 0.001
Hyperlipidemia (self-reported) No
Yes 7,635
626(75.1)
(82.3) 2,310 1243(24.9)
(17.7)
< 0.001
Diabetes mellitus† No
Yes 7,382
879(74.6)
(86.8) 2,324 110(25.4)
(13.2)
< 0.001
Diabetes mellitus (self-reported) No
Yes 7,600
661(74.9)
(86.4) 2,357 77(25.1)
(13.6)
< 0.001
Unit: number (weighted proportion). *P values were calculated by chi-square test;
†Hypertension: systolic blood pressure ≥ 140 mmHg or diastolic blood pressure ≥ 90 mmHg or taking anti-hypertensive medication; Hyperlipidemia: fasting serum total cholesterol ≥ 240 mg/dL or taking anti-hyperlipidemic medication; Diabetes mellitus:
fasting glucose ≥ 126 mg/dL or taking anti-diabetic medication or using insulin.
lipidemia OR, 0.85; 95% CI, 0.59-1.23; women with hyperlipid- emia OR, 1.14; 95% CI, 0.91-1.44). When the status of chronic disease was defined by self-report, there was no significant dif- ference in the use of nutrition labels between the group that was
diagnosed by a medical professional and the group that was not.
Analysis of the association between control or awareness of chronic disease and the use of nutrition labels showed that for hyperlipidemia, those who were aware of the disease (OR, 1.55;
95% CI, 1.03-2.35) or who had good control of cholesterol levels (OR, 2.19; 95% CI, 2.32-3.63) were more likely to use nutrition labels. On the other hand, there was no significant association between awareness or control of disease and nutrition label use in patients with hypertension or diabetes (Table 4).
DISCUSSION
In the current study, data from the fourth KNHANES were used to investigate the relationship between the use of nutrition la- bels and the presence of chronic disease in adults aged 20 yr and older. Those with chronic disease reported lower usage of nutrition labels compared to the usage for their healthy coun- terparts; however, analysis after correcting for other variables associated with the use of nutrition labels showed that there was no significant association between the use of nutrition la- bels and the presence of chronic disease. Furthermore, the re- sults indicated that those who had a good awareness of hyper- lipidemia and had good control of it were more likely to use nu- trition labels.
Previous studies on the use of nutrition labels in patients with chronic disease showed different results depending on the study method. For example, a study by Lewis and colleagues (16) us- ing the NHANES of the United States showed that patients with chronic diseases, such as hypertension, hypercholesterolemia, diabetes, obesity, and cardiovascular disease, used nutrition la- Table 3. Association between chronic disease status and food labeling use by multivariate analysis
Diseases Male (n = 4,282) Female (n = 6,413)
OR (95% CI) P value aOR* (95% CI) P value† OR (95% CI) P value aOR* (95% CI) P value† Hypertension‡
No
Yes 1.00
0.54 (0.43-0.67) < 0.001 1.00
0.97 (0.75-1.27) 0.852 1.00
0.22 (0.19-0.27) < 0.001 1.00
0.83 (0.67-1.03) 0.085 Hypertension (self-reported)
No
Yes 1.00
0.41 (0.31-0.56) < 0.001 1.00
0.78 (0.55-1.10) 0.150 1.00
0.22 (0.18-0.27) < 0.001 1.00
0.82 (0.64-1.05) 0.118 Hyperlipidemia‡
No
Yes 1.00
0.79 (0.57-1.11) 0.174 1.00
0.85 (0.59-1.23) 0.384 1.00
0.53 (0.44-0.64) < 0.001 1.00
1.14 (0.91-1.44) 0.246 Hyperlipidemia (self-reported)
No
Yes 1.00
0.90 (0.62-1.32) 0.595 1.00
0.98 (0.64-1.48) 0.910 1.00
0.56 (0.44-0.71) < 0.001 1.00
1.16 (0.88-1.53) 0.295 Diabetes mellitus‡
No
Yes 1.00
0.44 (0.30-0.65) < 0.001 1.00
0.70 (0.45-1.08) 0.110 1.00
0.40 (0.32-0.51) < 0.001 1.00
1.13 (0.84-1.53) 0.424 Diabetes mellitus (self-reported)
No
Yes 1.00
0.45 (0.28-0.72) 0.001 1.00
0.74 (0.45-1.23) 0.248 1.00
0.35 (0.27-0.47) < 0.001 1.00
1.15 (0.82-1.63) 0.417
*Adjusted for age, body mass index, education, family members, household income, nutrition education, smoking, alcohol, chronic disease status (hypertension, diabetes mellitus, hyperlipidemia); †P value were calculated by multiple logistic regression analysis; ‡Hypertension: systolic blood pressure ≥ 140 mmHg or diastolic blood pressure ≥ 90 mmHg or taking anti-hypertensive medication; Hyperlipidemia: fasting serum total cholesterol ≥ 240 mg/dL or taking anti-hyperlipidemic medication; Diabetes mellitus: fasting glucose
≥ 126 mg/dL or taking anti-diabetic medication or using insulin. OR, odds ratio; aOR, adjusted odds ratio; 95% CI, 95% confidence interval.
Table 4. Association between awareness and control of chronic disease and food la- beling use
Outcomes by disease OR (95% CI) P value aOR* (95% CI) P value† In hypertension patients (n = 2,655)
Awareness No Yes Control‡
No Yes
1.00 0.58 (0.45-0.75)
1.00 0.91 (0.65-1.27)
< 0.001
0.585
1.00 0.89 (0.64-1.22)
1.00 1.08 (0.74-1.57)
0.466
0.690 In hyperlipidemia patients (n = 1,123)
Awareness No Yes Control‡
No Yes
1.00 1.12 (0.81-1.53)
1.00 1.13 (0.77-1.64)
0.497
0.537
1.00 1.55 (1.03-2.35)
1.00 2.19 (1.32-3.63)
0.037
0.002 In diabetes mellitus patients (n = 945)
Awareness No Yes Control‡
No Yes
1.00 0.77 (0.50-1.19)
1.00 0.59 (0.36-0.98)
0.239
0.042
1.00 1.30 (0.75-2.26)
1.00 0.94 (0.51-1.74)
0.349
0.844
*Adjusted for sex, age, body mass index, education, family members, household in- come, nutrition education, smoking, alcohol, chronic disease status (hypertension, di- abetes mellitus, and hyperlipidemia); †P value were calculated by multiple logistic re- gression analysis; ‡Control of hypertension: systolic blood pressure < 140 mmHg and diastolic blood pressure < 90 mmHg; control of hyperlipidemia: serum total choles- terol < 200 mg/dL; control of diabetes mellitus: HbA1c < 6.5%. OR, odds ratio; aOR, adjusted odds ratio; 95% CI, 95% confidence interval.
bels more frequently than healthy people. In contrast, a study in a Latin population of diabetic patients showed that there was no significant difference in the use of nutrition labels between diabetic patients and non-diabetic participants; however, this study was limited in sample size, with approximately 100 par- ticipants in each group (18). In the current study, there was no significant association between the use of nutrition labels by participants without chronic disease and those with chronic disease, such as hypertension, diabetes, and hyperlipidemia.
Considering the importance of nutrition for these patients, nu- trition label usage by this population requires improvement.
The diagnosis of chronic disease will not affect health related behaviors unless the patient has awareness. In the study by Lew- is et al. (16), participants were defined as having a chronic dis- ease if they answered that they had been diagnosed with a chron- ic disease. In the current study, this definition was not associat- ed with the use of nutrition labels. Those with chronic disease are more likely to have unhealthy lifestyles compared with heal- thy persons, but patients who are diagnosed with chronic dis- ease can modify their lifestyles if they are interested in their health.
In contrast to the study by Lewis et al. (16), the current study may not have found a significant difference in the use of nutrition labels for those with and without chronic disease since nutri- tion labeling policy was introduced relatively late in Korea. Fur- thermore, the perception of nutrition labels differs among the Korean population. For example, a study by Chen et al. (22) re- ported that 80% of healthy adults over the age of 65 yr in the Unit- ed States used nutrition labels, whereas in the current study only 24.4% of the participants reported that they used nutrition labels.
Several factors can affect the use of nutrition labels. Socio- economic factors such as gender, age, education level, and in- come as well as the awareness of the relationship between food and chronic disease, and having nutrition knowledge are well known to affect the use of nutrition labels (22). In the current study, older male participants with a lower level of income and education and no exposure to nutrition education, were less likely to use nutrition labels, suggesting that the development of an approach to increase the use of nutrition labels in this po- pulation is required. A study by Post et al. (14) on patients with hypertension, diabetes, or hyperlipidemia, showed that those who were advised by a medical practitioner to reduce their in- take of calories or fat were 50% more likely to use nutrition la- bels. Furthermore, those who used nutrition labels consumed less calories, saturated fats, carbohydrates, and sugar, and had a higher intake of fiber. In the current study, participants who had received nutrition education were more likely to use nutrition labels. In contrast, despite the importance of nutrition manage- ment in those diagnosed with chronic diseases, these partici- pants did not show different usage of nutrition labels compared with healthy participants. Therefore, the results indicate that more active nutrition education in the management of patients
with chronic disease is required.
To the best of our knowledge, to date no study has analyzed the association between the use of nutrition labels and the aware- ness and control of chronic diseases. Patients who are actively involved in the management of their chronic disease are more likely to be interested in the nutrient content of foods. In the current study, patients who were aware of their diagnosis of hy- perlipidemia or who had good control of it, reported higher rates of nutrition label usage; however, this finding was not observed in participants diagnosed with hypertension and diabetes. The current results suggests that policies on nutrition labeling for- mat may need to be improved to help chronic disease manage- ment in patients with hypertension and diabetes mellitus. Re- cently, the US FDA proposed an update of their nutrition label, adding new nutrients such as added sugar, vitamin D, and po- tassium (11). This change reflects the latest scientific informa- tion, including the link between diet and chronic diseases.
An improved understanding of nutrition labels is required for nutrition label use to have an effect on the management of chronic disease. A study by De la Cruz-Gongora et al. (23) showed that 17% of adult Mexicans used nutrition labels, although only 1.2% of the participants answered all 5 questions on nutrition labels correctly. Sharf et al. (24) also reported that only 27.2% of 120 young adults understood the contents of nutrition labels correctly. In addition, Roberto et al. (25) reported that the ca- loric consumption was smaller when the daily recommended energy consumption was displayed on the nutrition labels com- pared with when only the caloric content was shown. These findings suggest that an appropriate nutrition labeling format together with the appropriate knowledge of nutrition labels, can improve the effect of nutrition labeling on chronic disease.
This study has several limitations. Firstly, the data analysis was limited as only the status of overall use of nutrition labels was questioned in the survey. Different nutrients are important in each disease, which can lead to differences in the use of nu- trition labels (16). In this study, patients who were aware of their diagnosis of hyperlipidemia or who had good control of it, were more likely to use nutrition labels, whereas this was not observed in those with hypertension and diabetes. Patients with hyper- lipidemia are likely to be more interested in the fat and caloric content of foods than other patients, whereas patients diagnos- ed with hypertension or diabetes are more interested in nutri- ents in foods that are closely associated to their diseases. Sec- ondly, this was cross-sectional study, and therefore, it cannot explain the causal relationship between nutrition label use and chronic disease. Healthy people may have healthier lifestyles and thus may have higher use of nutrition labels compared to the use in those with chronic diseases. On the other hand, ac- tive use of nutrition labels may prevent chronic diseases. Sever- al studies have shown that the use of nutrition labels is associ- ated with a healthier diet (25-27), but additional research is re-
quired to confirm this. Lastly, the use of nutrition labels was as- sessed by self-directed questionnaires and hence there may be recall bias.
In conclusion, there was no significant difference in the use of nutrition labels in participants with chronic diseases, such as hypertension, diabetes, and hyperlipidemia, compared to the use in those without chronic diseases. Considering the impor- tance of dietary habits in the management of chronic diseases, the use of nutrition labels in these patients requires improve- ment. In addition, the use of nutrition labels may differ depen- ding on the awareness and control of different types of diseases.
Additional research is required for the provision of a tailored approach.
DISCLOSURE
This study was supported by a grant from the SK Telecom Re- search Fund. The funder played no role in investigation of this study and writing this manuscript. The authors have no conflicts of interest to disclose.
ORCID
Sung-woo Hong http://orcid.org/0000-0002-5381-1363 Seung-Won Oh http://orcid.org/0000-0003-3800-0754
REFERENCES
1. Korea Centers for Disease Control and Prevention. The fourth korea national health and nutrition examination survey (KNHANES IV-3).
Available at https://knhanes.cdc.go.kr/ [accessed on 1 August 2012].
2. World Health Organization. Preventing chronic diseases: a vital invest- ment. Geneva: World Health Organization, 2005.
3. Sacks FM, Svetkey LP, Vollmer WM, Appel LJ, Bray GA, Harsha D, Obar- zanek E, Conlin PR, Miller ER 3rd, Simons-Morton DG, et al. Effects on blood pressure of reduced dietary sodium and the Dietary Approaches to Stop Hypertension (DASH) diet. DASH-Sodium Collaborative Research Group. N Engl J Med 2001; 344: 3-10.
4. Esmaillzadeh A, Kimiagar M, Mehrabi Y, Azadbakht L, Hu FB, Willett WC. Fruit and vegetable intakes, C-reactive protein, and the metabolic syndrome. Am J Clin Nutr 2006; 84: 1489-97.
5. Setayeshgar S, Whiting SJ, Vatanparast H. Prevalence of 10-year risk of cardiovascular diseases and associated risks in canadian adults: the contribution of cardiometabolic risk assessment introduction. Int J Hy- pertens 2013; 2013: 276564.
6. Taylor J. 2013 ESH/ESC guidelines for the management of arterial hy- pertension. Eur Heart J 2013; 34: 2108-9.
7. Evert AB, Boucher JL, Cypress M, Dunbar SA, Franz MJ, Mayer-Davis EJ, Neumiller JJ, Nwankwo R, Verdi CL, Urbanski P, et al. Nutrition ther- apy recommendations for the management of adults with diabetes. Dia- betes Care 2013; 36: 3821-42.
8. Hawkes C; World Health Organization. Nutrition labels and health claims:
the global regulatory environment. Geneva: World Health Organization, 2004.
9. Ministry Of Food And Drug Safety. Article 2.8 of the food sanitation act.
Available at http://www.law.go.kr/%EB%B2%95%EB%A0%B9/%EC%8 B%9D%ED%92%88%EC%9C%84%EC%83%9D%EB%B2%95 [accessed on 30 October 2013].
10. Taylor CL, Wilkening VL. How the nutrition food label was developed, part 1: the Nutrition Facts panel. J Am Diet Assoc 2008; 108: 437-42.
11. US Food and Drug Administration. FDA proposes updates to nutrition facts label on food packages. Available at http://www.fda.gov/NewsEv- ents/Newsroom/PressAnnouncements/ucm387418.htm [accessed on 10 March 2014].
12. Zarkin GA, Dean N, Mauskopf JA, Williams R. Potential health benefits of nutrition label changes. Am J Public Health 1993; 83: 717-24.
13. Ministry Of Food And Drug Safety. Article 11.1 of the food sanitation act and article 6.1 of the enforcement rule of the food sanitation act. Avail- able at http://www.law.go.kr/%EB%B2%95%EB%A0%B9/%EC%8B%9 D%ED%92%88%EC%9C%84%EC%83%9D%EB%B2%95 [accessed on 30 October 2013].
14. Post RE, Mainous AG 3rd, Diaz VA, Matheson EM, Everett CJ. Use of the nutrition facts label in chronic disease management: results from the National Health and Nutrition Examination Survey. J Am Diet Assoc 2010; 110: 628-32.
15. Kang HT, Shim JY, Lee YJ, Linton JA, Park BJ, Lee HR. Reading nutrition labels is associated with a lower risk of metabolic syndrome in Korean adults: the 2007-2008 Korean NHANES. Nutr Metab Cardiovasc Dis 2013;
23: 876-82.
16. Lewis JE, Arheart KL, LeBlanc WG, Fleming LE, Lee DJ, Davila EP, Cabán- Martinez AJ, Dietz NA, McCollister KE, Bandiera FC, et al. Food label use and awareness of nutritional information and recommendations among persons with chronic disease. Am J Clin Nutr 2009; 90: 1351-7.
17. Kessler H, Wunderlich SM. Relationship between use of food labels and nutrition knowledge of people with diabetes. Diabetes Educ 1999; 25:
549-59.
18. Fitzgerald N, Damio G, Segura-Pérez S, Pérez-Escamilla R. Nutrition knowledge, food label use, and food intake patterns among Latinas with and without type 2 diabetes. J Am Diet Assoc 2008; 108: 960-7.
19. Lee KA, Lee HJ, Park EJ. The effect of use of nutrition labelling on knowl- edge and perception of nutrition labelling, and awareness of nutrition labelling usefulness with among college students. J Korean Soc Food Sci Nutr 2010; 39: 253-66.
20. Kwon KI, Yoon SW, Kim SJ, Kang H, Kim HN, Kim JY, Kim SY, Kim K, Lee JH, Jung SM. A survey on customers’ perceptions of nutrition label- ing for processed food and restaurant meal. Korean J Nutr 2010; 43: 181-8.
21. Kim SY, Lee JH. Effect of nutrition labeling use on consumers’ food choic- es. J Consum Stud 2010; 21: 107-28.
22. Chen X, Jahns L, Gittelsohn J, Wang Y. Who is missing the message? Tar- geting strategies to increase food label use among US adults. Public Health Nutr 2012; 15: 760-72.
23. De la Cruz-Góngora V, Villalpando S, Rodríguez-Oliveros G, Castillo- García M, Mundo-Rosas V, Meneses-Navarro S. Use and understanding of the nutrition information panel of pre-packaged foods in a sample of Mexican consumers. Salud Publica Mex 2012; 54: 158-66.
24. Sharf M, Sela R, Zentner G, Shoob H, Shai I, Stein-Zamir C. Figuring out food labels. Young adults’ understanding of nutritional information
presented on food labels is inadequate. Appetite 2012; 58: 531-4.
25. Roberto CA, Larsen PD, Agnew H, Baik J, Brownell KD. Evaluating the impact of menu labeling on food choices and intake. Am J Public Health 2010; 100: 312-8.
26. Ollberding NJ, Wolf RL, Contento I. Food label use and its relation to di-
etary intake among US adults. J Am Diet Assoc 2010; 110: 1233-7.
27. Graham DJ, Laska MN. Nutrition label use partially mediates the relation- ship between attitude toward healthy eating and overall dietary quality among college students. J Acad Nutr Diet 2012; 112: 414-8.