www.jpis.org
pISSN 2093-2278 eISSN 2093-2286 Copyright © 2012 Korean Academy of PeriodontologyThis is an Open Access article distributed under the terms of the Creative Commons Attribution Non-Commercial License (http://creativecommons.org/licenses/by-nc/3.0/).
Surface characteristics of thermally treated titanium surfaces
Yang-Jin Lee1, De-Zhe Cui2, Ha-Ra Jeon1, Hyun-Ju Chung1, Yeong-Joon Park3, Ok-Su Kim1, Young-Joon Kim1,*
1Department of Periodontology, Dental Science Research Institute, Chonnam National University School of Dentistry, Gwangju, Korea
2Dental Hospital, Yanbian Medical University, Yanji, People’s Republic of China
3Department of Dental Materials, Dental Science Research Institute, Chonnam National University School of Dentistry, Gwangju, Korea
Purpose: The characteristics of oxidized titanium (Ti) surfaces varied according to treatment conditions such as duration time and temperature. Thermal oxidation can change Ti surface characteristics, which affect many cellular responses such as cell adhesion, proliferation, and differentiation. Thus, this study was conducted to evaluate the surface characteristics and cell re- sponse of thermally treated Ti surfaces.
Methods: The samples were divided into 4 groups. Control: machined smooth titanium (Ti-S) was untreated. Group I: Ti-S was treated in a furnace at 300°C for 30 minutes. Group II: Ti-S was treated at 500°C for 30 minutes. Group III: Ti-S was treated at 750°C for 30 minutes. A scanning electron microscope, atomic force microscope, and X-ray diffraction were used to assess surface characteristics and chemical composition. The water contact angle and surface energy were measured to assess physi- cal properties.
Results: The titanium dioxide (TiO2) thickness increased as the treatment temperature increased. Additional peaks belonging to rutile TiO2 were only found in group III. The contact angle in group III was significantly lower than any of the other groups.
The surface energy significantly increased as the treatment temperature increased, especially in group III. In the 3-(4,5-Dimeth- ylthiazol-2-yl)-2,5-diphenyltetrazolium bromide assay, after 24 hours of incubation, the assessment of cell viability showed that the optical density of the control had a higher tendency than any other group, but there was no significant difference. However, the alkaline phosphatase activity increased as the temperature increased, especially in group III.
Conclusions: Consequently, the surface characteristics and biocompatibility increased as the temperature increased. This in- dicates that surface modification by thermal treatment could be another useful method for medical and dental implants.
Keywords: Phase transition, Titanium, Transition temperature, Wettability.
INTRODUCTION
Titanium and titanium alloys have been widely used in den- tistry and orthopedics due to their excellent biocompatibility and physical properties. Although titanium is biologically in- ert, it reacts with oxygen in the air and spontaneously forms a dense and stable oxide layer with a thickness of 1.5 to 10 nm [1], which has a low level of electronic conductivity [2], great thermodynamic stability [3], and a low tendency toward ion-
formation in aqueous environments [4]. Thus, the biocom- patibility of titanium and its high corrosion resistance are at- tributed to this surface oxide film.
Although the “osseointegration” phenomenon was first de- scribed by Branemark et al. [5], integration between titanium and tissue depends on mainly morphological connection rather than chemical bonding [6]. Albrektsson et al. [7] ob- served that the bone-implant interface consisted of a fibrous tissue-free zone with a 20 to 40 nm thick proteoglycan coat Received: Feb. 17, 2012; Accepted: May 13, 2012
*Correspondence: Young-Joon Kim
Department of Periodontology, Dental Science Research Institute, Chonnam National University School of Dentistry, 33 Yongbong-ro, Buk-gu, Gwangju 500-757, Korea
E-mail: [email protected], Tel: +82-62-530-5648, Fax: +82-62-530-5649
the implant. Thus, many studies have been conducted to im- prove the bioactivity of the titanium surface. It has been re- ported that the activity of TiO2 is influenced by the crystal structure, surface area, size distribution, porosity, and surface hydroxyl density [8,9].
In its native form, the TiO2 layer has poor mechanical prop- erties and is easily fractured under fretting and sliding wear conditions [10]. Thus, various techniques such as the sol-gel method, anodizing, and hydrothermal methods have been applied to change the layer’s characteristics [11]. However, the sol-gel and anodizing methods have disadvantages such as cost and time needed. On the other hand, titanium with iso- thermal treatment has been found to be desirable for bio- medical applications due to its controllable oxide layer thick- ness, good uniformity, and conformability over large areas at low cost. Furthermore, TiO2 with a rutile structure was typi- cally formed by thermal treatment [8]. Studies have reported that a thick oxide layer could enhance the mechanical and biological properties of titanium [12,13]. Surface topography, crystalline structure, and roughness could be changed by thermal treatment, and the transition temperatures ranged from 400°C to 1,000°C according to the kind of titanium used [9,14,15]. Furthermore, surface topography and rough- ness can affect the surface energy [16].
During implantation of titanium implants, titanium con- tact with blood originated from bone marrow and surround- ing tissue. Because blood-surface interactions are influenced by surface energy [17], the change in the surface composition and the increase in the specific surface area could be attrib- uted to the high surface energy. Furthermore, cell spreading increases on the substratum with higher surface energy in both the presence and absence of serum proteins [18].
The morphology of cells grown on titanium can be infor- mative of their interactions with the surface, especially in the early phase of culture, i.e., attachment and adhesion [19]. Some studies have reported that cell attachment to material and cell proliferation is sensitive to the micro-topography of the titanium surface [20,21].
Thermal treatment is a relatively simple method for surface modification of titanium to enhance its surface characteris- tics and bioactivity. Therefore, the aim of this study was to evaluate the surface characteristics and the response of osteo- blasts on titanium (Ti-S) discs with different thermal treat- ments.
MATERIALS AND METHODS
Sample preparation
In this study, five samples of commercially pure titanium
sample surfaces were ultrasonically degreased in acetone and ethanol for 10 minutes each, with deionized water rinsing between applications of each solvent. To assess the chemical composition and surface characteristics of the TiO2 layer ac- cording to the treatment temperature, untreated machined smooth titanium (Ti-S) samples were treated by isothermal oxidation for 30 minutes in a tube furnace at 300°C, 500°C, or 750°C. Since moisture in the air which can enter the tube fur- nace could affect the oxidation, the air was passed through a drying tower filled with zeolite. The samples were divided into the following 4 groups: The control was untreated ma- chined Ti-S, group I was Ti-S treated in the furnace at 300°C for 30 minutes, group II was Ti-S treated at 500°C for 30 min- utes, and group III was Ti-S treated at 750°C for 30 minutes.
Surface characteristics
Surface roughness test and atomic force microscope (AFM) The surface roughness and micro-topography were exam- ined by a surface roughness tester (Asmeto AG, Richterswil, Germany) and atomic force microscopy (AFM; Nano Scope IIIa, Digital Instruments, Santa Barbara, CA, USA).
Scanning electron microscope (SEM)
To assess the oxide layer thickness, test samples were em- bedded in resin and then cross-sectioned. The surface topog- raphy and oxide layer thickness were observed by scanning electron microscoy (SEM; S-4700, Hitachi, Tokyo, Japan).
X-ray diffraction (XRD)
The chemical compositions of the titanium surfaces were determined by an X-ray diffractometer (XRD; D/MAX-1200, Rigaku, Japan) using CuKα1 incident radiation, a tube voltage of 40 kV, and a current of 40 mA. The scanning speed was 2°/
min and the scanning angle ranged from 20° to 90° 2θ.
Contact angle measurement
The contact angle of each sample was measured using an image analyzing microscope (Camscope, Sometech Inc., Seoul, Korea). The contact angles were determined using drops of distilled water at room temperature. The image of the water droplet was captured at 30 seconds after delivery.
Then the contact angle was analyzed by using the image an- alyzing software (Surftens QA 3.0, OEG GmbH, Frankfurt, Germany).
Surface energy
The surface energy was calculated by Young’s equation and Good and van Oss model using the following parameters and measured contact angles.
asolid surface are:
- Solid-Liquid interfacial tension ϒSL
- Solid-Vapor interfacial tension ϒSV (ϒS) - Liquid-Vapor interfacial tension ϒLV (ϒL)
These three parameters are linked with the contact angle θ by Young’s equation:
ϒS=ϒL cos θ+ϒSL
In the van Oss et al. [22], the surface energy is written as:
ϒS=ϒdS+2 ϒ+SϒS-
- ϒdS dispersive component (Lifshitz-van der Waals inter- actions)
- ϒS+, ϒS- polar components (polar interactions, Lewis acid- base)
The relation between surface energy components, liquid components, and contact angle is written as:
ϒL(1+cosθ)=2 { ϒdSϒdL + ϒS+ϒL- + ϒ+LϒS- }
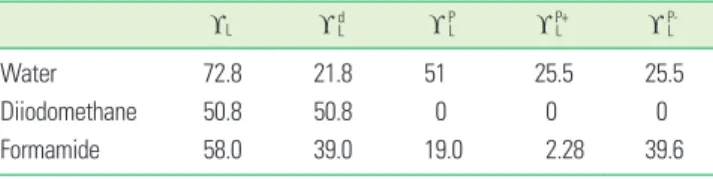
Depositing a drop of 3 different liquids with known disper- sive and polar components, one can calculate the solid surface energy. Table 1 gives the values of components of typical liq- uids used in the determination of surface energy.
Biologic characteristics
3-(4,5-Dimethylthiazol-2-yl)-2,5-diphenyltetrazolium bromide (MTT) assay
Cells were seeded on each disc in a 12-well plate at a density of 5×10⁴ cells/mL in BGJb media supplemented with 10% fe- tal bovine serum (FBS). Following incubation, cell viability was assessed after 3 days following the manufacturer’s guide- lines. In these experiments, the amount of reduced Formosan product is directly proportional to the number of viable cells.
Formosan accumulation was quantitated by absorbance at 490 nm by an enzyme-linked immunoabsorbent assay plate reader and analyzed.
Alkaline Phosphatase (ALP) activity
To measure the ALP activity, MC3T3-E1 cells were seeded on each group of discs in a 12-well plate at a density of 1×10⁴
mined on day 7. To induce differentiation into osteoblasts, 40 μg/mL ascorbate and 20 μg/mL β-glycerol phosphate were added to the α-MEM media. Determination of ALP activity was performed at day 7. Briefly, cells were lysed in Triton 0.1%
(Triton X-100) in phosphate buffered saline, then frozen at -70°C and thawed. One hundred microliters of cell lysates was mixed with 200 μL of 10 mM p-nitrophenol phosphate and 100 μL of 1.5 M 2-amino-2-methyl-1-propanol buffer, and then incubated for 60 minutes in the oven at 60°C. ALP activity was measured by absorbance reading at 405 nm with a spectrophotometer (Bio-Rad Laboratories Inc., Hercules, CA, USA). All experiments were carried out in triplicate.
Statistical analysis
The SPSS ver. 12.0 (SPSS Inc., Chicago, IL, USA) was used to assess the data on the contact angle, surface energy, and MTT assay for each group with one way analysis of variance and Turkey’s test. A P-value<0.05 was considered statistically sig- nificant.
RESULTS
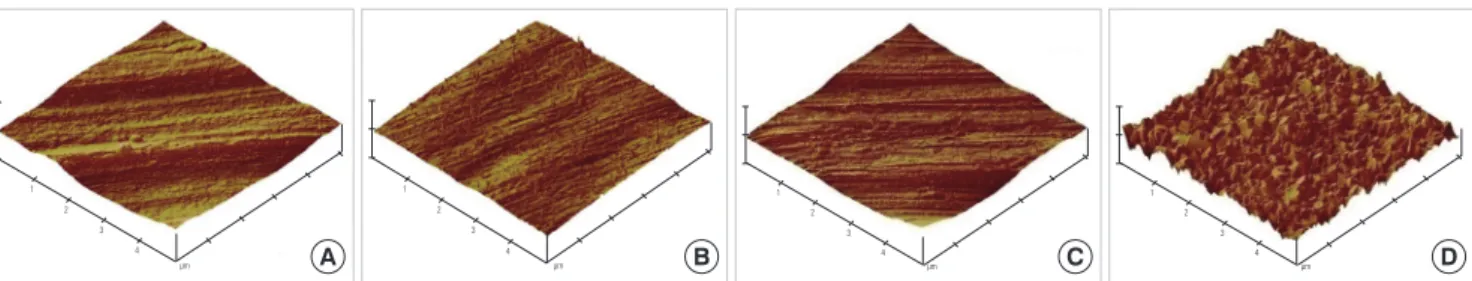
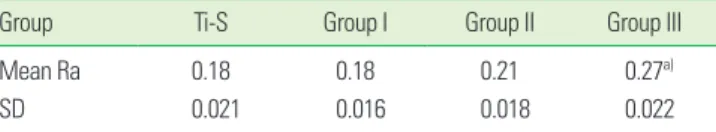
The surface morphology and topography of control and thermally treated Ti-S are shown in Figs 1 and 2. There was a tendency toward an increase in the mean average surface roughness (Ra) as the treatment temperature increased (Table 2). The most noticeable surface change was observed in group III. In group III, most of the crystallites tended to be larger and the surface topography had a more spiked shape than the other groups. As shown in Fig. 3, the cross-sectioned image also showed that the thickness of the TiO2 layer in- creased as the temperature increased.
Fig. 4 shows the XRD patterns of the samples. For the con- trol, group I, and group II samples, the XRD patterns are al- most the same, presenting only the peaks of titanium. For group III, there are additional peaks belonging to rutile TiO2. This indicates that titanium was further oxidized in group III and formed oxide layers with a rutile structure instead of an- atase.
The contact angles and surface energies are shown in Fig. 5 and Table 3. The water contact angle of the samples gradually decreased as the temperature increased. Although there was no statistical difference between group I and group II, group III had a statistically significantly lower contact angle than the other groups. In contrast, the surface energies (dyne/cm) significantly increased as the temperature increased.
In the MTT assay, after 24 hours of incubation, the assess- ment of cell viability showed that the optical density of the control tended to be higher than the other groups, but there Table 1. Energy components of typical liquids [28].
ϒL ϒdL ϒPL ϒPL+ ϒPL-
Water 72.8 21.8 51 25.5 25.5
Diiodomethane 50.8 50.8 0 0 0
Formamide 58.0 39.0 19.0 2.28 39.6
Units: mJ/m2.
Figure 2. Atomic force microscopy shows the surface topographies of control group (A), group I (B), group II (C), and group III (D).
A B C D
1 1 1 1
2 2 2 2
3 3 3 3
4 4 4 4
μm μm μm μm
Figure 3. The cross-sectioned image from the scanning electron microscope shows the thickness of the group I (A), group II (B), and group III (C) surface oxide layers.
A B C
Acc.V Spot Magn Det WD
10.0 kV 3.0 20,000x SE 5.0 Acc.V Spot Magn Det WD
10.0 kV 3.0 20,000x SE 5.0 Acc.V Spot Magn Det WD
10.0 kV 3.0 20,000x SE 4.9
1 μm 1 μm 1 μm
218 nm
1.57 μm
Figure 1. Scanning electron microscope images show the surface topographies of control group (A), group I (B), group II (C), and group III (D).
A B C D
CPTi 15.0kV 11.4mm ×100k SE(U) 500nm 300 15.0kV 9.3mm ×100k SE(M) 500nm 500 15.0kV 9.3mm ×100k SE(M) 500nm 750 15.0kV 9.4mm ×100k SE(M) 500nm
Figure 4. X-ray diffraction patterns of the samples.
Relative intensity (a.u.) 110 110100101 102
750°C 500°C 300°C Cp-Ti
101
Rutile Titanium
20 30 40 50 60 70 80 90
2-Theta
Contact angle (°) Surface energy (dyne/cm) 80.00
70.00 60.00 50.00 40.00 30.00 20.00 10.00
0.00 Ti-S
b),c),d)
c),d)
300°C
c),d)
c),d)
500°C
a),d)
a),b),d)
750°C
a),b),c) a),b),c)
Figure 5. Contact angle and surface energy of samples. Ti-S: smooth titanium. a)P<0.05, vs. Ti-S. b)P<0.05, vs. group I. c)P<0.05, vs. group II. d)P<0.05, vs. group III.
was no significant difference (Fig. 6). However, the ALP activi- ty increased as the temperature increased, especially in group III (Fig. 7).
DISCUSSION
Osseointegration depends on the behaviors of cells at the bone-implant interface, such as their initial attachment, ad- hesion, and spreading [23]. These events can be affected by the surface characteristics of the implant, including chemical composition, wettability, and topography [20]. Theoretically, pure Ti surfaces exhibit high surface energy due to the oxide layer that grows spontaneously at room temperature [4]. Such oxide surfaces are known to be spontaneously nucleated cal- cium phosphate layers (apatite) in contact with simulated body fluid [8]. However, inorganic anions or organic hydro- carbon contaminants from the atmosphere were absorbed into surface with high energy within seconds. As a result, the surface chemical composition might change and the surface hydrophilicity decrease. Thus, many studies have been con- ducted to increase the wettability and surface energy. One study [14] reported that the anatase/rutile transition could oc- cur at temperatures ranging from 400°C to 1,000°C and the transition could affect the surface morphology, chemical composition, crystal structure, and surface roughness [9], which could, in turn, increase the wetability and surface en- ergy [8]. In this study, SEM and AFM examination also revealed that the crystal structure and surface topography changed as the treatment temperature increased. Although all of the tested samples showed differences among the groups, promi- nent changes could be seen in group III. This indicated that the anatase/rutile phase transition occurred only in group III,
and XRD patterns confirmed this.
It has been reported [24] that as the treatment temperature is raised, the oxygen solubility of the titanium matrix is en- hanced. Furthermore, the plane of rutile had the highest atomic density [25]. The higher density of titanium ions on the surfaces was responsible for more active sites. This indi- cated that a thicker oxide layer could be created by the rutile plane. Our cross-sectioned image also showed a significant increase in the oxide layer thickness in group III compared with group I and group II.
Some studies [8,17,18] have reported increased wettability due to high surface energy and enhanced interaction between the implant surface and biologic environment. Because the Gibb’s function of the thermal-treated samples with higher surface energies should be greater, absorption and reaction occur more easily on such surfaces [8]. The present study showed a decrease in the contact angle and increase in the surface energy as the treatment temperature increased. Fur- thermore, group III showed a prominent difference in sur- face characteristics and physical properties from the other groups. This indicated that the phase transition of the oxide layer is another important factor in surface modification.
Table 3. Contact angle and surface energy of samples.
Contact angle (°) SD Surface energy (dyne/cm) SD
Ti-S 70.75b)-d) 2.45 35.87c),d) 1.20
Group I 62.94a),d) 1.63 35.62c),d) 2.39
Group II 55.08a),d) 5.02 42.36a),b),d) 5.67
Group III 43.32a)-c) 3.48 50.88a)-c) 3.27
SD: standard deviation, Ti-S: smooth titanium.
P<0.05 was considered statistical significant.
a)P<0.05, vs. Ti-S. b)P<0.05, vs. group I. c)P<0.05, vs. group II. d)P<0.05, vs. group III.
Optical density
Abs. 490 nm
0.25 0.20 0.15 0.10 0.05
0.00 Ti-S 300°C 500°C 750°C
Figure 6. Cell viability assessed by 3-(4,5-Dimethylthiazol-2-yl)-2,5- diphenyltetrazolium bromide (MTT) assay (day 1). Abs.: absorbance, Ti-S: commercially pure titanium
Figure 7. Alkaline phosphatase activity (U/μg/protein) after 7 days.
a)Significantly different compared to other groups (P<0.05). Ti-S:
commercially pure titanium.
U/μg/protein
500
400
300
200
100
0 Ti-S 300°C 500°C 750°C
a)
Group Ti-S Group I Group II Group III
Mean Ra 0.18 0.18 0.21 0.27a)
SD 0.021 0.016 0.018 0.022
Ti-S: smooth titanium, SD: standard deviation.
a)Statistically significant difference compared with that of the other groups (P<0.01).
minimally rough surface and the differences are not sub- stantial, but a surface topographical change was observed.
Even though both the spiky surface and the undulating sur- face had the same Ra, the cells on the former surface would have influence on the behavior of cell adhesion than those on the latter [26]. It is generally known that as surface micro- roughness increases, osteoblast proliferation decreases, whereas as differentiation increases on such surfaces, the cells tend to increase production of factors like transforming growth factor-β1 that promote osteogenesis while decreas- ing osteoclastic activity [20]. Twenty-four hours is generally considered a key point in time in the analysis of short-term cellular interactions with biomaterials in vitro [19]. In this study, at 1 day, the MTT assay showed that the cell viability was higher in the untreated group; however, micro-rough- ness and ALP activity increased as the temperature increased, especially in group III. The ALP activity is used as a biomark- er for expressing osteoblastic activity because ALP can medi- ate bone mineralization by decomposing phosphate com- pounds and stimulating the combination of phosphate and calcium in the extracellular matrix [27].
In this study, the surface characteristics of thermally treated titanium discs were observed. Consequently, the surface characteristics and bioactivities improved as the temperature increased. This indicates that surface modification by thermal treatment could be a useful method for medical and dental implants.
In the present study, the surface characteristics of Ti-S discs treated by different thermal conditions were evaluated. The results are as follows:
1) The TiO2 layer thickness increased as the treatment tem- perature increased.
2) For the control, group I, and group II samples, the XRD patterns were almost the same and there were only peaks of titanium. For group III, there were additional peaks belonging to rutile TiO2.
3) The contact angle in group III was significantly lower than any of the other groups, but there was no significant difference between group I and group II. The surface en- ergy increased significantly as the treatment temperature increased.
4) The surface roughness increased as the treatment tem- perature increased.
5) After 1 day, cell viability was higher in the untreated group, but the difference was not significant.
6) ALP activity increased as the treatment temperature in- creased.
The micro-morphology, crystal structure, and cellular inter- actions of the TiO2 layer were influenced by the treatment
greater improvement in surface characteristics compared with the other groups.
CONFLICT OF INTEREST
No potential conflict of interest relevant to this article was reported.
REFERENCES
1. Kasemo B, Lausmaa J. Aspects of surface physics on titani- um implants. Swed Dent J Suppl 1985;28:19-36.
2. Zitter H, Plenk H Jr. The electrochemical behavior of me- tallic implant materials as an indicator of their biocom- patibility. J Biomed Mater Res 1987;21:881-96.
3. Solar RJ, Pollack SR, Korostoff E. In vitro corrosion testing of titanium surgical implant alloys: an approach to under- standing titanium release from implants. J Biomed Mater Res 1979;13:217-50.
4. Tengvall P, Lundstrom I. Physico-chemical considerations of titanium as a biomaterial. Clin Mater 1992;9:115-34.
5. Branemark PI, Adell R, Breine U, Hansson BO, Lindström J, Ohlsson A. Intra-osseous anchorage of dental prosthe- ses. I. Experimental studies. Scand J Plast Reconstr Surg 1969;3:81-100.
6. Van Noort R. Titanium: the implant material of today. J Mater Sci 1987;22:3801-11.
7. Albrektsson T, Hansson HA, Ivarsson B. Interface analysis of titanium and zirconium bone implants. Biomaterials 1985;6:97-101.
8. Feng B, Chen JY, Qi SK, He L, Zhao JZ, Zhang XD. Charac- terization of surface oxide films on titanium and bioactiv- ity. J Mater Sci Mater Med 2002;13:457-64.
9. Neupane MP, Kim VK, Park IS, Lee MH, Bae TS. Charac- terization of surface oxide films and cell toxicity evaluations with a quenched titanium surface. Met Mater Int 2008;14:
443-8.
10. Gilbert JL, Buckley CA, Lautenschlager EP. Titanium oxide film fracture and repassivation: the effect of potential, pH and aeration. Philadelphia: ASTM special technical publi- cation; 1996.
11. Choi JW, Heo SJ, Koak JY, Kim SK, Lim YJ, Kim SH, et al.
Biological responses of anodized titanium implants under different current voltages. J Oral Rehabil 2006;33:889-97.
12. Pilliar RM. Medical device materials. Materials Park: ASM International; 2004.
13. Sunny MC, Sharma CP. Titanium-protein interaction:
changes with oxide layer thickness. J Biomater Appl 1991;
6:89-98.
rutile transition of titania thin films prepared by MOCVD.
Mater Res Bull 1997;32:431-40.
15. Barksdale J. Titanium, its occurrence, chemistry, and tech- nology. Soil Sci 1950;70:414.
16. Lim YJ, Oshida Y, Andres CJ, Barco MT. Surface character- izations of variously treated titanium materials. Int J Oral Maxillofac Implants 2001;16:333-42.
17. Schrader ME. On adhesion of biological substances to low- energy solid-surfaces. J Colloid Interface Sci 1982;88:296-7.
18. Schakenraad JM, Busscher HJ, Wildevuur CR, Arends J.
The influence of substratum surface free energy on growth and spreading of human fibroblasts in the presence and absence of serum proteins. J Biomed Mater Res 1986;20:
773-84.
19. Anselme K, Bigerelle M. Statistical demonstration of the relative effect of surface chemistry and roughness on hu- man osteoblast short-term adhesion. J Mater Sci Mater Med 2006;17:471-9.
20. Boyan BD, Lossdorfer S, Wang L, Zhao G, Lohmann CH, Cochran DL, et al. Osteoblasts generate an osteogenic microenvironment when grown on surfaces with rough microtopographies. Eur Cell Mater 2003;6:22-7.
21. Passeri G, Cacchioli A, Ravanetti F, Galli C, Elezi E, Ma-
man osteoblastic cells on five commercially available tita- nium surfaces. Clin Oral Implants Res 2010;21:756-65.
22. van Oss CJ, Chaudhury MK, Good RJ. Monopolar surfaces.
Adv Colloid Interface Sci 1987;28:35-64.
23. Anselme K. Osteoblast adhesion on biomaterials. Bioma- terials 2000;21:667-81.
24. Vaquila I, Vergara LI, Passeggi MC, Vidal RA, Ferr J. Chem- ical reactions at surfaces: titanium oxidation. Surf Coat Technol 1999;122:67-71.
25. Jones P, Hockey JA. Infra-red studies of rutile surfaces.
Part 2. Hydroxylation, hydration and structure of rutile surfaces. Trans Faraday Soc 1971;67:2679-85.
26. Schwartz Z, Lohmann CH, Oefinger J, Bonewald LF, Dean DD, Boyan BD. Implant surface characteristics modulate differentiation behavior of cells in the osteoblastic lineage.
Adv Dent Res 1999;13:38-48.
27. Gerstenfeld LC, Chipman SD, Glowacki J, Lian JB. Expres- sion of differentiated function by mineralizing cultures of chicken osteoblasts. Dev Biol 1987;122:49-60.
28. Combe EC, Owen BA, Hodges JS. A protocol for determin- ing the surface free energy of dental materials. Dent Ma- ter 2004;20:262-8.