Genetic Diversity and Population Genetic Structure of Cephalotaxus koreana in South Korea
Kyung Nak Hong*, Young Mi Kim, Yu Jin Park and Jei Wan Lee
Division of Forest Genetic Resources, Korea Forest Research Institute, Suwon 441-350, Korea
Abstract - The Korean plum yew (Cephalotaxus koreana Nakai) is a shade-tolerant, coniferous shrub. The seeds have been
used as a folk medicine in Korea, and an alkaloid extract (HTT) is known to have anticancer properties. We estimated the genetic diversity of 429 trees in 16 populations in South Korea using 194 polymorphic amplicons from seven combinations of AFLP primer-restriction enzymes. The average number of effective alleles and the percentage of polymorphic loci were 1.37 and 79.4%, respectively. Shannon’s diversity index and the expected heterozygosity were 0.344 and 0.244, respectively.
We divided 16 populations into four groups on the UPGMA dendrogram and the PCA biplot. The first two principal components explained 84% of the total genetic variation. Genetic differentiation between populations explained 14% of total genetic variation, and the remaining 86% came from difference between individuals within populations, as determined by an analysis of molecular variance (AMOVA). However, the genetic differentiation did not correlate with the geographic distance between populations from the Mantel test. The Bayesian statistics, which are comparable to Wright’s F
STand Nei’s G
ST, were θ
I= 0.406 and θ
II= 0.172, respectively. The population genetic diversity was slightly lower, and the strength of genetic differentiation was much weaker, than the average of those plants having similar life histories, as assessed using arbitrary marker systems. We discuss strategies for the genetic conservation of the plum yew in Korea.
Key words -
Genetic differentiation, AFLP, Cluster analysis, Bayesian inference, Conservation*Corresponding author. E-mail : [email protected]
Introduction
There is still no agreement on the taxonomy of the genus Cephalotaxus, but it is generally presumed to consist of seven to nine species (Lang et al., 2011). In Korea, two species and one variety, including C. koreana, C. harringtonia, and C.
harringtonia var. nana are registered (KPNI Committee, 2008), although only two species, C. harringtonia and C. koreana, were acknowledged as native species (Tripp, 1995). Otherwise, C. koreana was classified as a variety or subspecies of C.
harringtonia, and C. harringtonia var. nana was designated as a species (Zhang et al., 2000; Lang et al., 2013). C.
harringtonia var. nana with creeping was treated as a female of C. koreana (Lee, 1974), or every plum yew in Korea was classified as C. harringtonia (Chang et al., 2011).
Korean plum yews (Cephalotaxus koreana Nakai) are distributed in Korea, China, and Japan (Lee, 1974). They grow at rocky sites in valleys or at the feet of mountains at 100-1,300
m above sea level, at 37-38° latitude in Korea, except for Jeju Island and Ulleung Island. They are mainly dioecious or rarely monoecious, and have 2n = 24 chromosomes (Chang et al., 2011). Their flowers bloom in April, and the ripening of seeds with edible sweet arils occurs from September to October in the following year. Around 80% of their seeds germinate in a nursery bed, and clonal propagation by cuttings or layerings is also possible (Lee, 1974).
The seeds of the Korean plum yew have been used as a folk medicine in Korea (Kim and Jeong, 2008). Alkaloids and terpenoids extracted from Cephalotaxus spp. are valuable medical resources (Abdelkafi and Nay, 2012; Jung et al., 2010).
Homoharringtonine (HTT) is an alkaloid from C. harringtonia, and it has an effect against hematological cancer, and it is being developed as a commercial medicine in the USA (Sisodiya, 2013). Natural homoharringtonine was superior to a synthetic one in anticancer essays (Abdelkafi and Nay, 2012), and its content was significantly different between plum yew populations in Korea (Jung et al., 2005). Cephalotaxus spp. are now rare and endangered worldwide (Farjon et al.,
Original Research Article
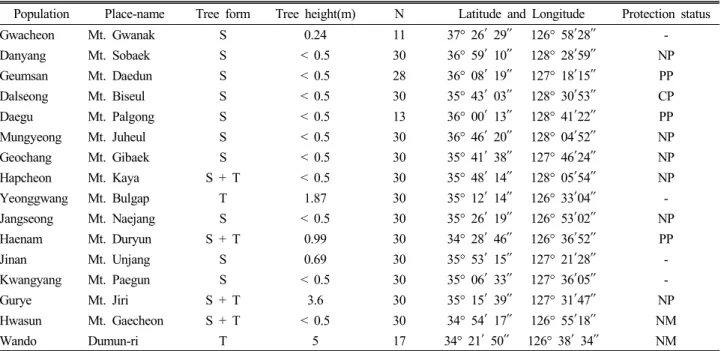
Table 1. Population locations and growth performances of the samples in Cephalotaxus koreana populations in Korea
zPopulation Place-name Tree form Tree height(m) N Latitude and Longitude Protection status
Gwacheon Mt. Gwanak S 0.24 11 37° 26′ 29″ 126° 58′28″ -
Danyang Mt. Sobaek S < 0.5 30 36° 59′ 10″ 128° 28′59″ NP
Geumsan Mt. Daedun S < 0.5 28 36° 08′ 19″ 127° 18′15″ PP
Dalseong Mt. Biseul S < 0.5 30 35° 43′ 03″ 128° 30′53″ CP
Daegu Mt. Palgong S < 0.5 13 36° 00′ 13″ 128° 41′22″ PP
Mungyeong Mt. Juheul S < 0.5 30 36° 46′ 20″ 128° 04′52″ NP
Geochang Mt. Gibaek S < 0.5 30 35° 41′ 38″ 127° 46′24″ NP
Hapcheon Mt. Kaya S + T < 0.5 30 35° 48′ 14″ 128° 05′54″ NP
Yeonggwang Mt. Bulgap T 1.87 30 35° 12′ 14″ 126° 33′04″ -
Jangseong Mt. Naejang S < 0.5 30 35° 26′ 19″ 126° 53′02″ NP
Haenam Mt. Duryun S + T 0.99 30 34° 28′ 46″ 126° 36′52″ PP
Jinan Mt. Unjang S 0.69 30 35° 53′ 15″ 127° 21′28″ -
Kwangyang Mt. Paegun S < 0.5 30 35° 06′ 33″ 127° 36′05″ -
Gurye Mt. Jiri S + T 3.6 30 35° 15′ 39″ 127° 31′47″ NP
Hwasun Mt. Gaecheon S + T < 0.5 30 34° 54′ 17″ 126° 55′18″ NM
Wando Dumun-ri T 5 17 34° 21′ 50″ 126° 38′ 34″ NM
zS or T = shrub or tall tree in tree form, N = number of samples, NP = national park, PP = provincial park, CP = county park, NM = natural monument by the law.
1993). The Korean plum yew also is designated as one of the specific plants whose habitats are threatened regionally in Korea (Oh et al., 2011).
Amplified fragment length polymorphism (AFLP) is a dominant marker having limitations to estimate precisely heterozygosity, and it requires rather complicated techniques, high-purity template DNAs, and a DNA sequencer. However, its reproducibility is higher than that of other arbitrary markers, such as randomly amplified polymorphic DNAs (RAPD) (Mba and Tohme, 2005). AFLP, unlike microsatellite markers, is easily applicable to non-model species with a lack of sequence information, and it generates many polymorphic markers per assay (Campbell et al., 2003). Thus, AFLPs have been useful for studies of genetic variation in plant species.
Most studies of population genetic diversity using AFLP employed more than 100 loci, and optimally 200 to 600 loci, to obtain qualified results (Rieseberg et al., 2012; Nybom, 2004). A large number of loci are more efficient than a large number of individuals for estimating genetic diversity and genetic distance (Nei and Roychoudhury, 1974; Nei, 1978).
Even with an unknown level of genetic diversity in a population, a total of 20 to 30 individuals using five to 10 microsatellite loci was an adequate sample size to assess genetic diversity
(Pruett and Winker, 2008). For AFLP, at least 10 times more dominant markers should be used to attain the same efficiency of codominant markers as simple sequence repeats (SSR) (Mariette et al., 2002). However, it is not difficult to obtain more than 100 AFLP markers; therefore, AFLPs could be easily applied to non-model plant species.
We estimated the genetic diversity and relationships of C.koreana populations in Korea using an AFLP marker system to obtain information on the in situ conservation of their genetic resources.
Materials and Methods
Sample collection
We chose 16 populations that have a sufficient sample size
(n ≥ 30, except for some populations; Table 1) through
literature searches and field surveys. The needles of 429 plum
yews from the 16 populations were collected, and their growth
was measured. We also collected the needles of 30 Torreya
nucifera Sieb. et Zucc. in Jeju Island as an outgroup. Total
DNA was isolated using the DNeasy Plant Mini Kit (QIAGEN
Inc., Valencia, CA, USA).
AFLP PCR
AFLP analysis carried out using a slightly modified protocol of Vos et al. (1995). The genomic DNA (0.5 ㎍) was digested with each 10 units of EcoRI and MseI endonuclease (New England Biolabs, Ipswich, MA, USA) in a total volume of 25 ㎕ for 2 h at 37℃. Five ㎕ of the digestion reaction was mixed with 15 ㎕ of ligation solution, which contained 5 pmole of EcoRI adaptor, 50 pmole of MseI adaptor (Applied Biosystems, Foster City, CA, USA), and 100 units of T4 DNA ligase (New Engalnd Biolabs). The mixture was incubated for 3 h at 37℃
and was diluted 10-fold with H
2O.
Preselective amplification was conducted in a 10 ㎕ reaction volume, using 3 ㎕ of the ligation mixture, 1 pmol each of MseI + C and EcoRI + A preselective primers (Applied Biosystems), 0.2 mM dNTPs, 1 x PCR buffer containing 2 mM MgCl
2, and 2 units of Taq DNA polymerase (RBC Bioscience Corp., Taipei, Taiwan). The PCR was run for 29 cycles of 15 s at 94℃, 30 s at 60℃, and 1 min at 72℃, increasing the ramp time by 1 s for every extension and keeping the last extension for 2 min at 72℃. The pre-amplification product was diluted 10-fold with H
2O for selective amplification.
The selective amplification was performed using a 12 ㎕ reaction volume, including 4 ㎕ of diluted pre-amplification product, a selective primer combination of 2.5 pmol of MseI- primer and 0.5 pmol of EcoRI-primer tagged with a fluorescent dye (Applied Biosystems), 0.22 mM dNTPs, 1 × PCR buffer containing 2 mM MgCl
2, and 1 unit of Taq DNA polymerase (RBC Bioscience Corp.). Seven selective-primer combinations were used (Table 1). The PCR started with 12 cycles of 10 s at 94℃, 30 s at 65℃, decreasing by 0.7℃ for each subsequent annealing step, and 1 min at 72℃, followed by 25 cycles of 10 s at 94℃, 30 s at 56℃, and 1 min at 72℃, increasing the ramp time by 1 s for every extension and keeping the last extension for 2 min at 72℃.
A solution including 3 ㎕ of selective amplification products, 11.64 ㎕ of deionized formamide, and 0.36 ㎕ of GeneScan 500 ROX dye size standard was denatured for 5 min at 95℃, cooled on ice, and analyzed by automatic electrophoresis in the ABI 3130xl Genetic Analyzer (Applied Biosystems). We scored the peaks between 100 and 350 base pairs in GeneMapper version 4.0 (Applied Biosystems) and exported data on the peak height of all scored fragments with >100 relative
fluorescence units (rfus).
Statistical analysis
Estimation of genetic diversity and analysis of molecular variance (AMOVA) were conducted using the GenAlEx program (Peakall and Smouse 2006). For Bayesian clustering, we followed Pritchard et al. (2000) using the STRUCTURE program, and estimated the optimal number of groups (Evanno et al., 2005). We estimated the parameters with a burn-in of 100,000 and a Markov Chain Monte Carlo (MCMC) repetition of 100,000 per run. The average heterozygosity within each population was estimated with the Bayesian computation, including a MCMC with a burn-in of 50,000 and a sampling run of 250,000 iterations using the Hickory program (Holsinger et al., 2002). Population-specific Wright’s F statistics for each population were estimated with Approximate Bayesian Computation using the ABC4F program (Foll et al., 2008).
Results
Genetic diversity of Cephalotaxus koreana
A total 194 polymorphic amplicons were harvested from 429 individual trees in 16 populations using seven combinations of AFLP primer-restriction enzymes. By adding 30 samples of one Torreya nucifera population, we obtained 208 polymorphic amplicons. The average number of effective alleles and the percentage of polymorphic loci were 1.373 and 79.4%, respectively (Table 2). The average Shannon’s diversity index (I) and the expected heterozygosity were 0.344 and 0.224, respectively. The genetic diversity (I) of Chephalotaxus was lower than that of Tilia amurensis (0.416;
KFRI, 2013), using AFLP, and Taxus cuspidata (0.478; Kwon
and Kim, 2002) and Torreya nucifera (0.353; Hong et al.,
2000) using inter-simple sequence repeats (ISSRs) in South
Korea. The genetic diversity was higher in Danyang, Jinan,
and Youngkwang, and lowest in Gwacheon (Table 2). However,
using Baysian inference, the expected heterozygosity was
higher in Hwasoon, Gwacheon, and Danyang. The average
inbreeding coefficient within populations was as high as
0.861, and that in Wando was exceptionally low, 0.315.
Table 2. Genetic diversity index with AFLP markers of Cephalotaxus koreana populations in Korea
zPopulation Ae I He %P hs PS-FIS PS-FST
Gwacheon 1.199 (0.021) 0.201 (0.017) 0.125 (0.012) 53.85% 0.296 (0.004) 0.953 (0.893∼1.000)
0.753 (0.587∼0.947) Danyang 1.537 (0.028) 0.435 (0.019) 0.298 (0.014) 79.81% 0.279 (0.004) 0.855
(0.704∼1.000)
0.329 (0.252∼0.405) Geumsan 1.435 (0.023) 0.400 (0.017) 0.263 (0.012) 82.21% 0.249 (0.004) 0.977
(0.950∼1.000)
0.096 (0.044∼0.144) Dalseong 1.354 (0.025) 0.333 (0.018) 0.215 (0.013) 75.00% 0.294 (0.004) 0.993
(0.985∼1.000)
0.121 (0.074∼0.166) Daegu 1.374 (0.027) 0.328 (0.019) 0.217 (0.014) 67.31% 0.265 (0.005) 0.976
(0.945∼1.000)
0.340 (0.262∼0.419) Mungyeong 1.342 (0.022) 0.333 (0.017) 0.214 (0.012) 75.48% 0.205 (0.007) 0.980
(0.955∼1.000)
0.135 (0.071∼0.196) Geochang 1.324 (0.021) 0.325 (0.017) 0.206 (0.012) 77.40% 0.274 (0.004) 0.998
(0.996∼1.000)
0.104 (0.055∼0.147) Hapcheon 1.294 (0.021) 0.298 (0.017) 0.188 (0.012) 73.08% 0.264 (0.004) 0.997
(0.993∼1.000)
0.172 (0.107∼0.234) Yeonggwang 1.504 (0.028) 0.418 (0.019) 0.283 (0.014) 83.17% 0.259 (0.005) 0.889
(0.756∼1.000)
0.210 (0.150∼0.272) Jangseong 1.349 (0.023) 0.335 (0.018) 0.216 (0.012) 75.00% 0.273 (0.004) 0.977
(0.947∼1.000)
0.151 (0.084∼0.207) Haenam 1.281 (0.019) 0.303 (0.015) 0.187 (0.011) 78.37% 0.217 (0.005) 0.999
(0.997∼1.000)
0.076 (0.044∼0.105) Jinan 1.505 (0.027) 0.426 (0.018) 0.287 (0.013) 82.69% 0.265 (0.004) 0.952
(0.894∼1.000)
0.155 (0.094∼0.207) Kwangyang 1.301 (0.020) 0.307 (0.017) 0.195 (0.012) 71.15% 0.270 (0.006) 0.989
(0.975∼1.000)
0.239 (0.173∼0.302) Gurye 1.273 (0.022) 0.283 (0.016) 0.174 (0.011) 78.85% 0.274 (0.005) 0.997
(0.993∼1.000)
0.338 (0.253∼0.410) Hwasun 1.442 (0.026) 0.383 (0.019) 0.257 (0.014) 74.04% 0.303 (0.004) 0.783
(0.579∼1.000)
0.552 (0.414∼0.729) Wando 1.461 (0.026) 0.392 (0.019) 0.265 (0.014) 71.63% 0.271 (0.006) 0.315
(0.039∼0.616)
0.583 (0.436∼0.762)
Mean 1.373 (0.006) 0.344 (0.005) 0.224 (0.003) 74.94% 0.266 0.861 0.256
zAe = number of effective alleles, I = Shannon’s diversity index, He = expected heterozygosity, and %P = percentage of polymorphic loci. Population heterozygosity (hs) and population-specific FIS and FST estimated by Bayesian methods. The values in parenthesis were the standard deviation and the highest posterior density interval at 90% credible level.
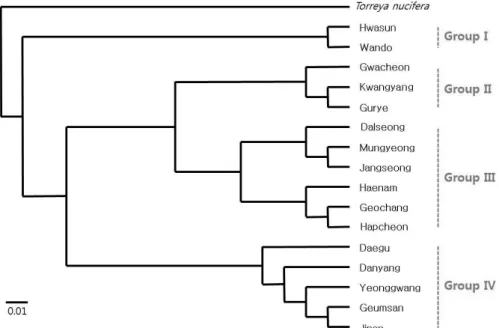
Genetic relatedness between Cephalotaxus populations We divided the 16 populations into four groups based on their genetic relationships in the unweighted pair group method with arithmetic mean (UPGMA) dendrogram, putting the Torreya nucifera population on Jeju Island as an outgroup (Fig. 1). Its criterion was a genetic distance of 0.07. This grouping pattern was the same as that of the principal component analysis (PCA) (Fig. 2). The first and the second principal components in the PCA scatterplot explained
84.0% of the total genetic variation. The first axis (the 1
stPC)
explained 66% of the variation, and it classified three groups
(Group I, Group IV, and the others), and the second axis
explained 18% of the variation, and divided the others into
Group II and Group III. The grouping supported 11.3% of the
total genetic variation in the hierarchical AMOVA, 5.5% was
among-population variation, and 83.2% was within-population
variation. The genetic differentiation did not correlate with
the geographic distance between populations (Mantel’s r =
Fig. 1. Dendrogram based on Nei’s genetic distance by UPGMA method of Cephalotaxus koreana populations in Korea.
Fig. 2. Biplot from principal component analysis (PCA) with the genetic distance matrix of Cephalotaxus koreana populations using AFLP markers in Korea. The 1
stprincipal component (PC 1) and the 2
nd(PC 2) explained 65.6% and 18.4% of total variation, respectively.
0.208, P > 0.10), and this was also confirmed from the results of the cluster analysis (UPGMA) and the PCA.
Bayesian clustering was conducted under Hardy-Weinberg equilibrium and the linkage equilibrium for 16 populations.
With the optimal number of populations (K = 2) by Evanno et al. (2005) method, one group was represented by Wando,
Hawsoon, etc., and the other included Gwacheon, Gurye, etc.
(Table 3). We could not find any biogeographical trend in the
discrimination of the groups because the proximal populations
were showing similar genetic architecture, such as the results
of the clustering analysis (Fig. 1). The optimal number of
populations using the STRUCTURE program represents the
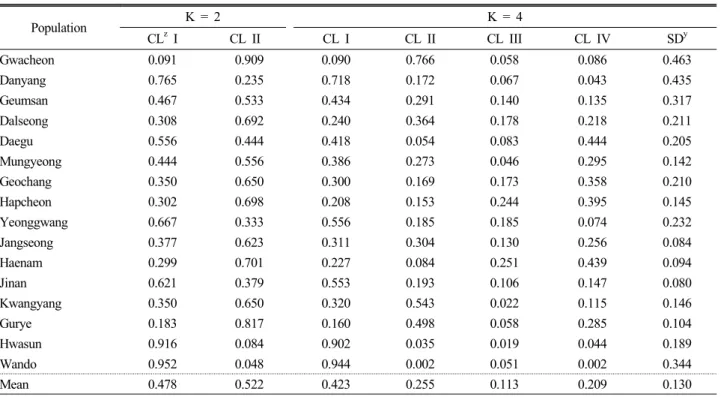
Table 3. Posterior distribution probabilities for each population from Bayesian clustering with the given number of clusters (K) using STRUCTURE (Pritchard et al., 2000) of Cephalotaxus koreana populations in Korea
Population K = 2 K = 4
CLz I CL II CL I CL II CL III CL IV SDy
Gwacheon 0.091 0.909 0.090 0.766 0.058 0.086 0.463
Danyang 0.765 0.235 0.718 0.172 0.067 0.043 0.435
Geumsan 0.467 0.533 0.434 0.291 0.140 0.135 0.317
Dalseong 0.308 0.692 0.240 0.364 0.178 0.218 0.211
Daegu 0.556 0.444 0.418 0.054 0.083 0.444 0.205
Mungyeong 0.444 0.556 0.386 0.273 0.046 0.295 0.142
Geochang 0.350 0.650 0.300 0.169 0.173 0.358 0.210
Hapcheon 0.302 0.698 0.208 0.153 0.244 0.395 0.145
Yeonggwang 0.667 0.333 0.556 0.185 0.185 0.074 0.232
Jangseong 0.377 0.623 0.311 0.304 0.130 0.256 0.084
Haenam 0.299 0.701 0.227 0.084 0.251 0.439 0.094
Jinan 0.621 0.379 0.553 0.193 0.106 0.147 0.080
Kwangyang 0.350 0.650 0.320 0.543 0.022 0.115 0.146
Gurye 0.183 0.817 0.160 0.498 0.058 0.285 0.104
Hwasun 0.916 0.084 0.902 0.035 0.019 0.044 0.189
Wando 0.952 0.048 0.944 0.002 0.051 0.002 0.344
Mean 0.478 0.522 0.423 0.255 0.113 0.209 0.130
zCL = cluster, ySD = standard deviation.
Table 4. Distribution of genetic variations in Cephalotaxus koreana populations in Korea from Analysis of Molecular Variance (AMOVA)
Source of
variation d.f. Sum of squares
Variance components
Percentage of variance Among
populations 15 2584.0 5.25 13.9%
Within
populations 411 13389.9 32.58 86.1%
Total 426 15973.9 37.83 100.0%
number of groups at the highest level for the given data; it is not a measure to designate biological populations themselves (Pritchard et al., 2000; Evanno et al., 2005). Occasionally, we needed to adjust the number according to a reasonable explanation. Setting the number to K = 4, which showed the second highest ΔK (data not shown) and was also the same as the number of groups in the clustering analyses (Fig. 1 and 2), we reallocated the 16 populations and counted the proportion of inferred ancestry of an individual (q). As a result, the average proportion (
) for Cluster I was the highest, 0.423, and Wando and Hawsoon were the representatives (Table 3).
The genotypes of Cluster II (
= 0.255) and Cluster III (0.113) were abundant in Gwacheon and in Haenam, respectively.
The frequencies of the genotypes of Cluster IV (0.209) were relatively high in Daegu and Hapcheon. Additionally, the four genotypes were evenly distributed in Jangsung, Haenam, and Jinan (SD < 0.1).
Population genetic differentiation of Cephalotaxus The genetic differences between populations explained 14% of the total genetic variation and the remaining 86%
came from differences between individuals within populations, as assessed by AMOVA for the 16 populations of C. koreana (Table 4). The genetic differentiation of C. koreana populations ( Φ
ST= 0.139) was higher than that of Tilia amurensis ( Φ
ST= 0.105; KFRI, 2013), using AFLP, and those of Taxus cuspidata ( Φ
ST= 0.092; Kwon and Kim, 2002) and Torreya nucifera ( Φ
ST= 0.094; Hong et al., 2000) using ISSR in Korea. The
distribution of genetic variation in C. koreana populations
corresponded to the general trend that shrub species have a
higher total genetic diversity and lower population genetic
differentiation than tall tree species (Nybom and Bartish, 2000).
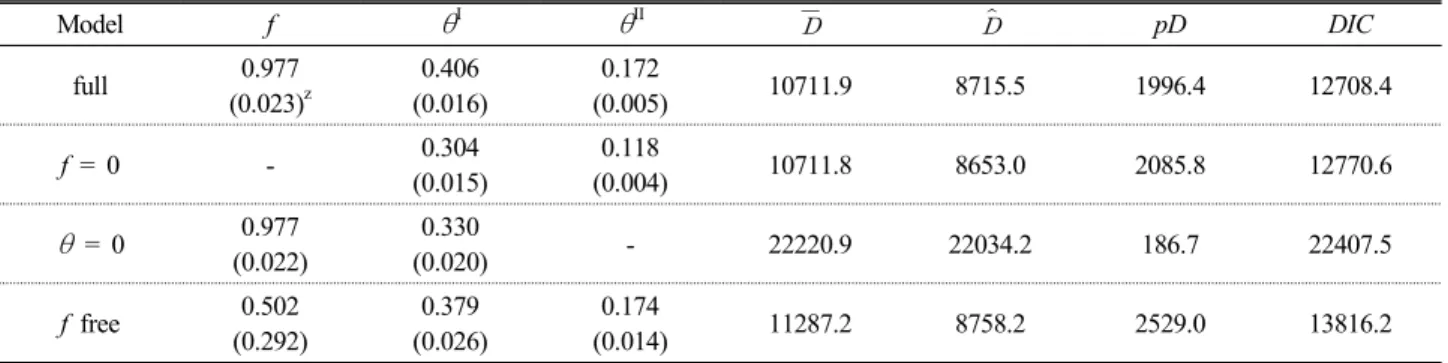
Table 5. Coefficients of inbreeding (f) and genetic differentiation (θ
Iand θ
II), and DIC statistics calculating under four alternative models in Bayesian approach (Holsinger et al., 2002) of Cephalotaxus koreana populations in Korea
Model f
θ
Iθ
II pD DICfull 0.977
(0.023)z
0.406 (0.016)
0.172
(0.005) 10711.9 8715.5 1996.4 12708.4
f = 0 - 0.304
(0.015)
0.118
(0.004) 10711.8 8653.0 2085.8 12770.6
θ
= 0 0.977(0.022)
0.330
(0.020) - 22220.9 22034.2 186.7 22407.5
f free 0.502
(0.292)
0.379 (0.026)
0.174
(0.014) 11287.2 8758.2 2529.0 13816.2
zStandard deviation in parenthesis.